| Param | Original file | Final file |
|---|---|---|
| Filename | modeM0/AS1A05_015T01_9000002650_17819cztM0_level2.evt | modeM0/AS1A05_015T01_9000002650_17819cztM0_level2_quad_clean.evt |
| Size (bytes) | 468,829,440 | 104,048,640 |
| Size | 447.1 MB | 99.2 MB |
| Events in quadrant A | 3,131,123 | 678,601 |
| Events in quadrant B | 3,916,114 | 700,800 |
| Events in quadrant C | 3,229,330 | 667,196 |
| Events in quadrant D | 3,477,395 | 648,492 |
| Mode SS | |||
|---|---|---|---|
| Quadrant | BADHDUFLAG | Total packets | Discarded packets |
| A | 0 | 134 | 0 |
| B | 0 | 134 | 0 |
| C | 0 | 134 | 0 |
| D | 0 | 134 | 0 |
| Mode M9 | |||
|---|---|---|---|
| Quadrant | BADHDUFLAG | Total packets | Discarded packets |
| A | 0 | 21 | 0 |
| B | 0 | 22 | 0 |
| C | 0 | 22 | 0 |
| D | 0 | 22 | 0 |
| Mode M0 | |||
|---|---|---|---|
| Quadrant | BADHDUFLAG | Total packets | Discarded packets |
| A | 0 | 13586 | 2 |
| B | 0 | 15770 | 2 |
| C | 0 | 13775 | 2 |
| D | 0 | 14955 | 2 |
| Quadrant | Total seconds | Saturated seconds | Saturation percentage |
|---|---|---|---|
| A | 6538 | 38 | 0.581217% |
| B | 6538 | 337 | 5.154481% |
| C | 6538 | 83 | 1.269501% |
| D | 6538 | 69 | 1.055369% |
Noise dominated data is calculated using 1-second bins in cleaned event files. If a bin has >2000 counts, and if more than 50% of those come from <1% of pixels, then it is considered to be noise-dominated and hence unusable.
| Quadrant | # 1 sec bins | Bins with >0 counts | Bins with >2000 counts | High rate bins dominated by noise | Noise dominated (total time) | Noise dominated (detector-on time) | Marked lightcurve |
|---|---|---|---|---|---|---|---|
| A | 7853 | 6539 | 0 | 0 | 0.00% | 0.00% | 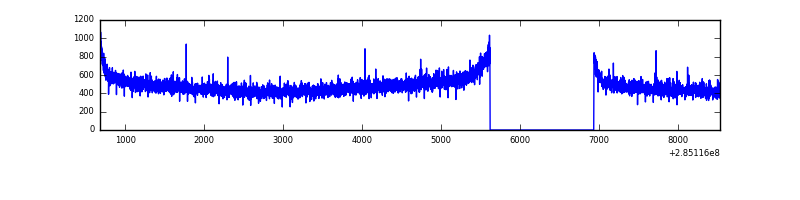 |
| B | 7853 | 6539 | 187 | 187 | 2.38% | 2.86% | 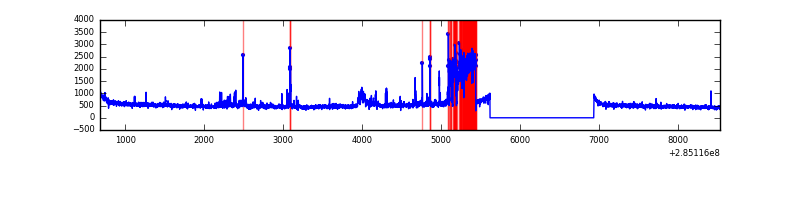 |
| C | 7853 | 6539 | 0 | 0 | 0.00% | 0.00% | 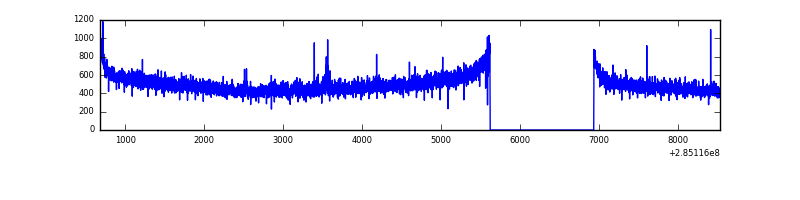 |
| D | 7853 | 6539 | 40 | 40 | 0.51% | 0.61% | 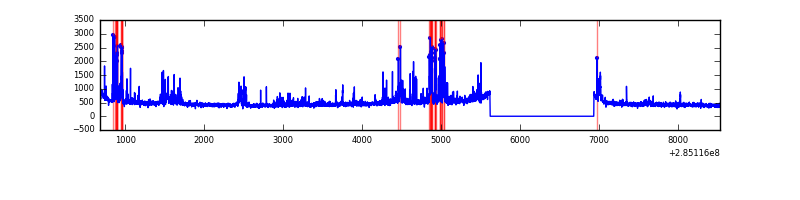 |
Top three noisy pixels from each quadrant. If the there are fewer than three noisy pixels in the level2.evt file, extra rows are filled as -1
| Pixel properties | Quadrant properties | ||||||
|---|---|---|---|---|---|---|---|
| Quadrant | DetID | PixID | Counts | Sigma | Mean | Median | Sigma |
| A | 0 | 226 | 7038 | 38.26 | 815 | 799 | 163.0 |
| A | 12 | 194 | 5841 | 30.92 | 815 | 799 | 163.0 |
| A | 3 | 137 | 5744 | 30.33 | 815 | 799 | 163.0 |
| B | 10 | 245 | 598838 | 3954.47 | 809 | 791 | 151.2 |
| B | 15 | 222 | 109705 | 720.17 | 809 | 791 | 151.2 |
| B | 0 | 230 | 29935 | 192.71 | 809 | 791 | 151.2 |
| C | 14 | 238 | 124893 | 681.34 | 788 | 796 | 182.1 |
| C | 5 | 218 | 11845 | 60.66 | 788 | 796 | 182.1 |
| C | 9 | 160 | 8179 | 40.54 | 788 | 796 | 182.1 |
| D | 10 | 70 | 269799 | 1436.39 | 783 | 762 | 187.3 |
| D | 7 | 238 | 151120 | 802.76 | 783 | 762 | 187.3 |
| D | 1 | 52 | 73752 | 389.69 | 783 | 762 | 187.3 |
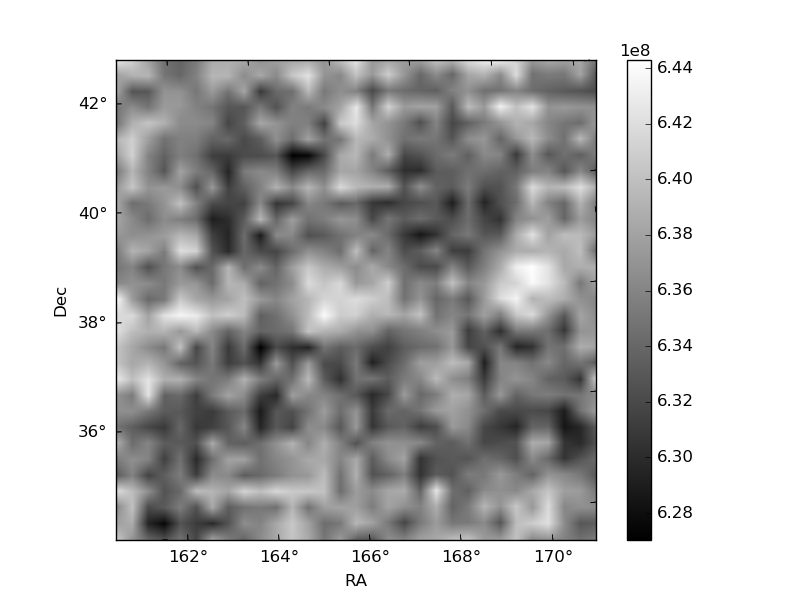
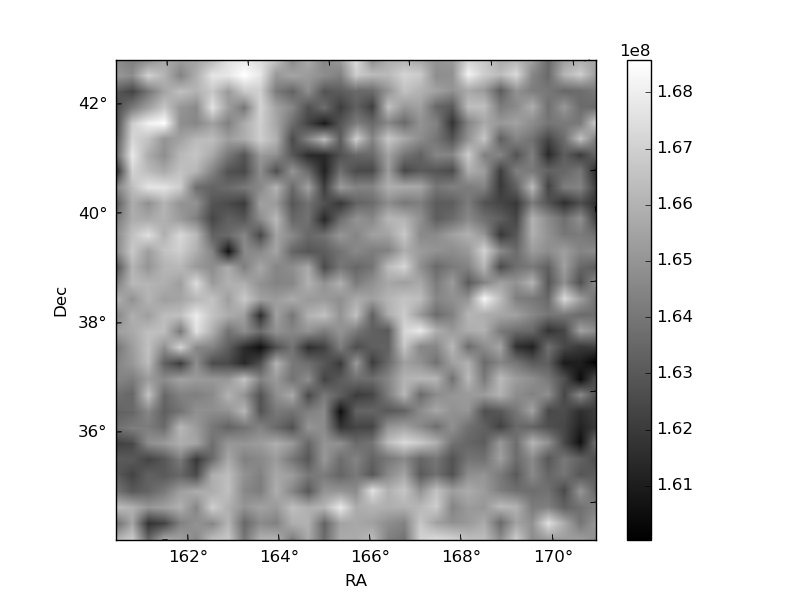
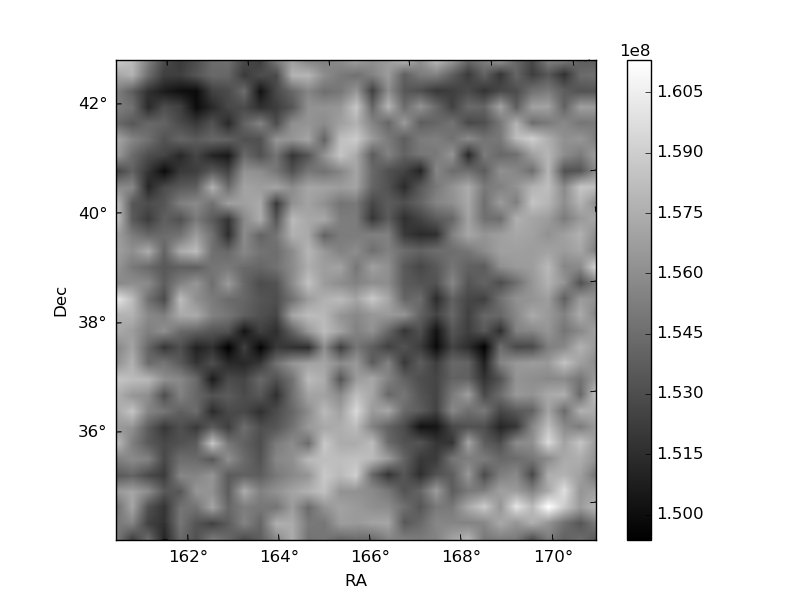
Histogram calculated using DETX and DETY for each event in the final _common_clean file
| Quadrant A | 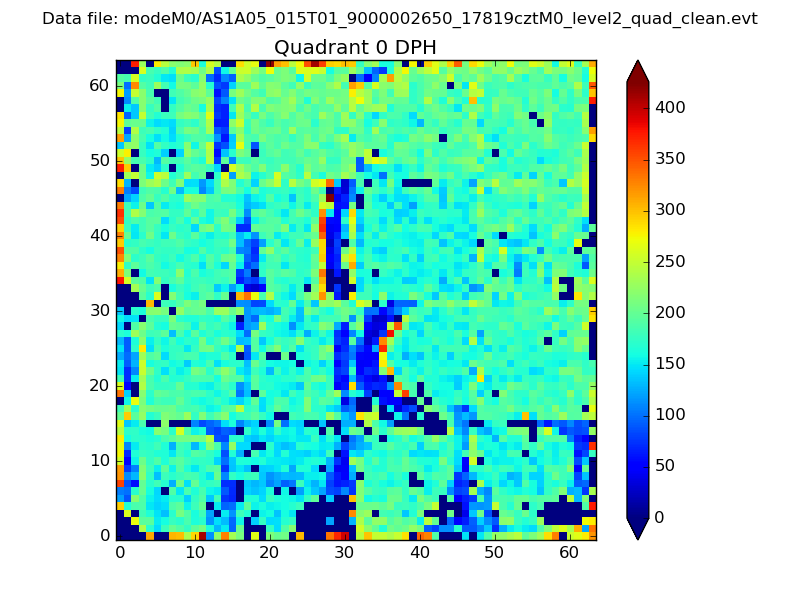 |
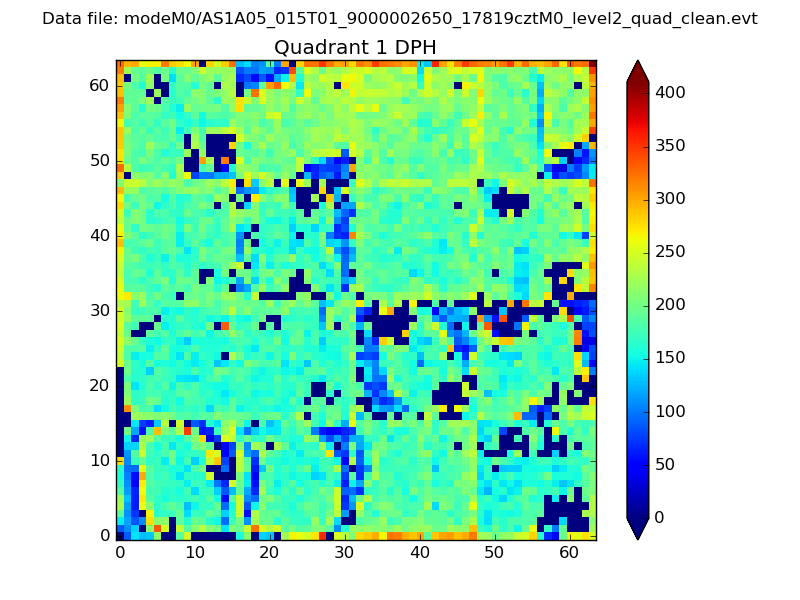 |
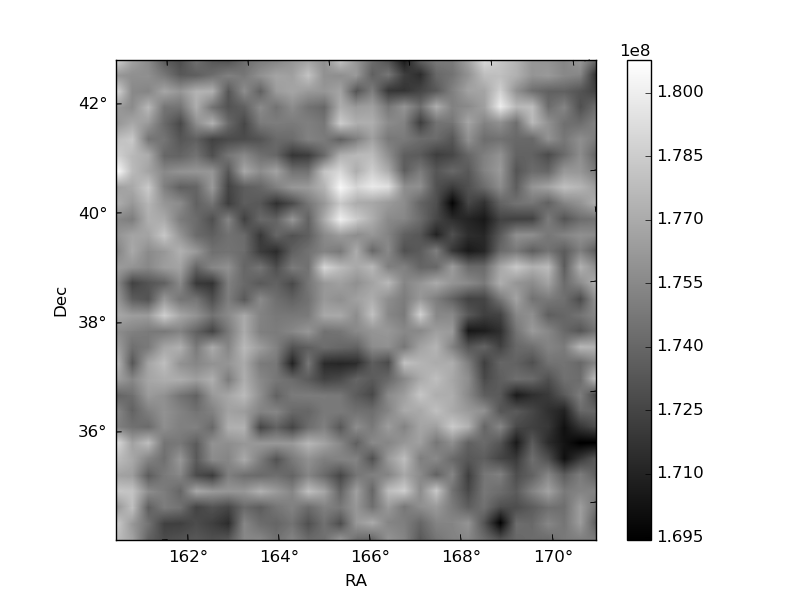
Quadrant B |
|---|---|---|---|
| Quadrant D | 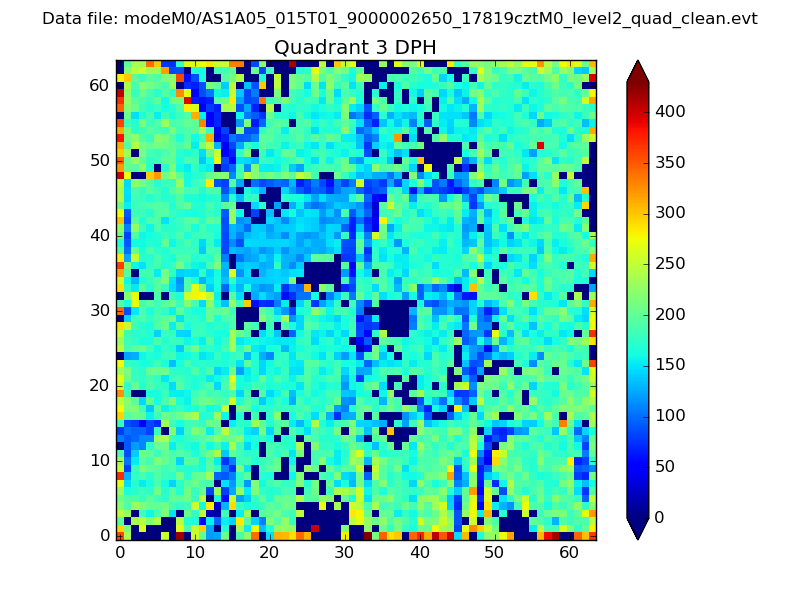 |
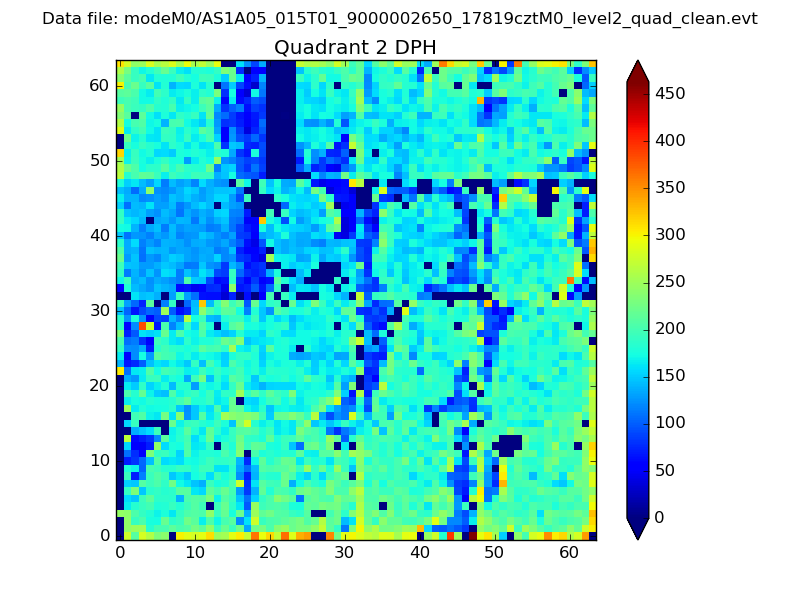 |
Quadrant C |
| Plot type | Count rate plots | Images |
|---|---|---|
| Comparison with Poisson distribution Blue bars denote a histogram of data divided into 1 sec bins. Red curve is a Poisson curve with rate = median count rate of data. |
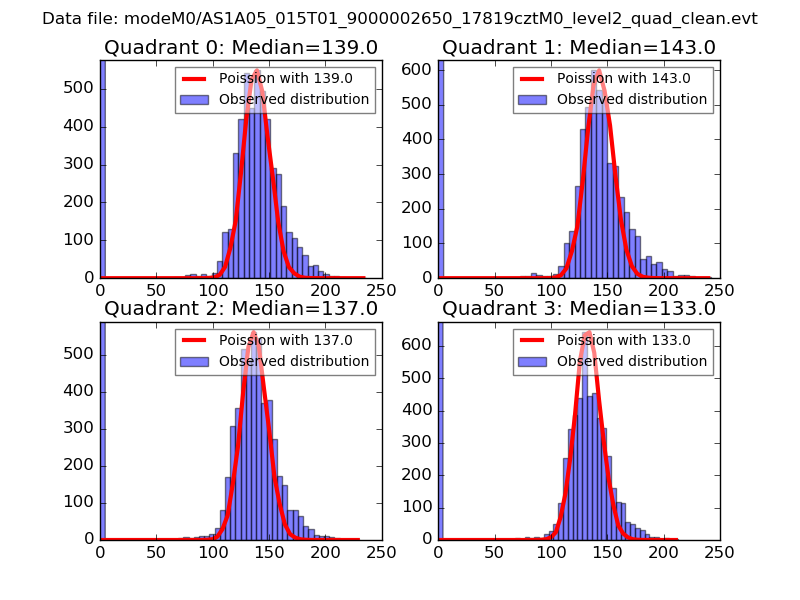 |
 |
| Quadrant-wise count rates Data is divided into 100 sec bins |
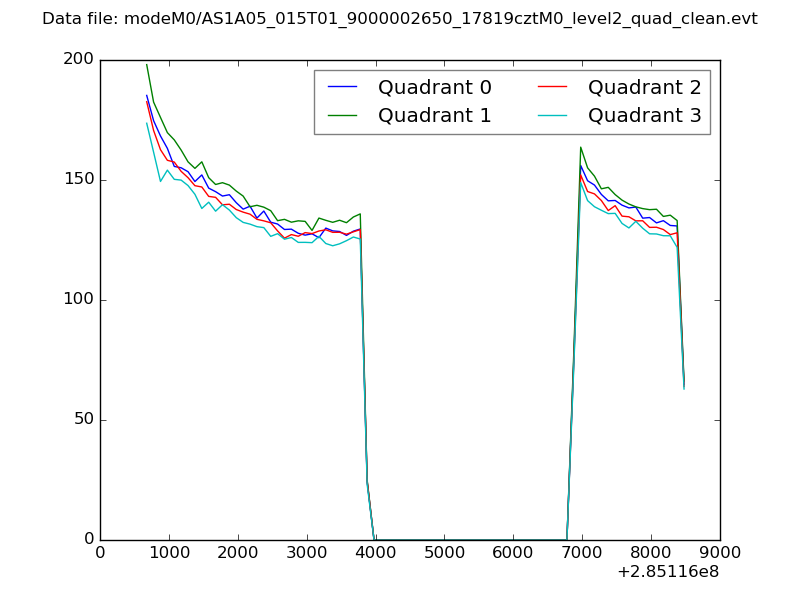 |
|
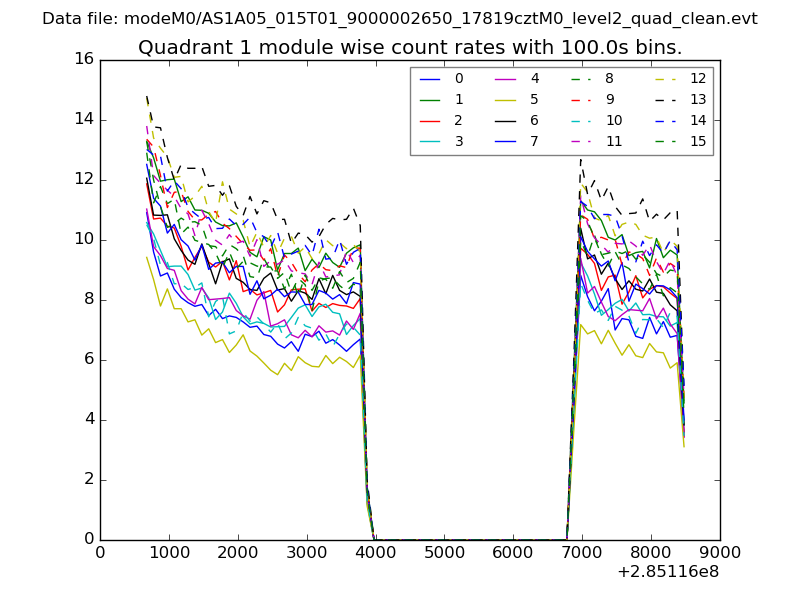
| Module-wise count rates for Quadrant A Data is divided into 100 sec bins |
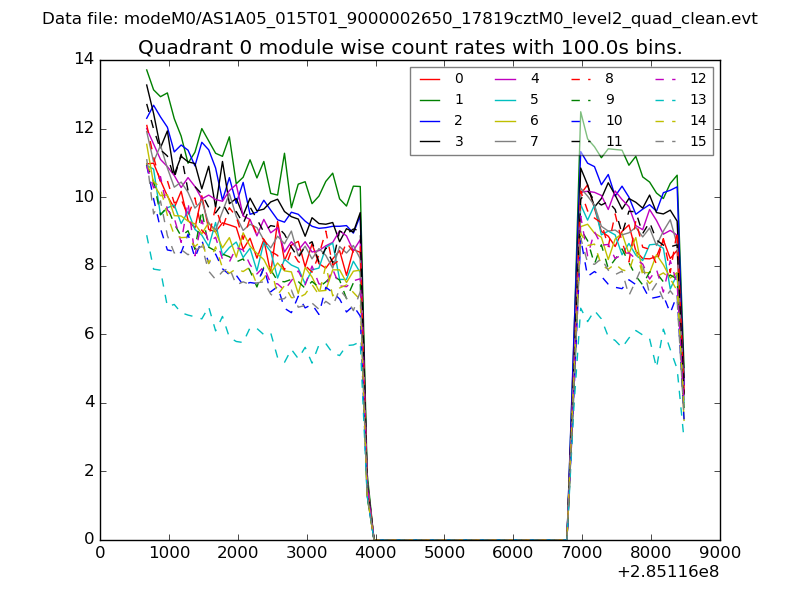 |
 |
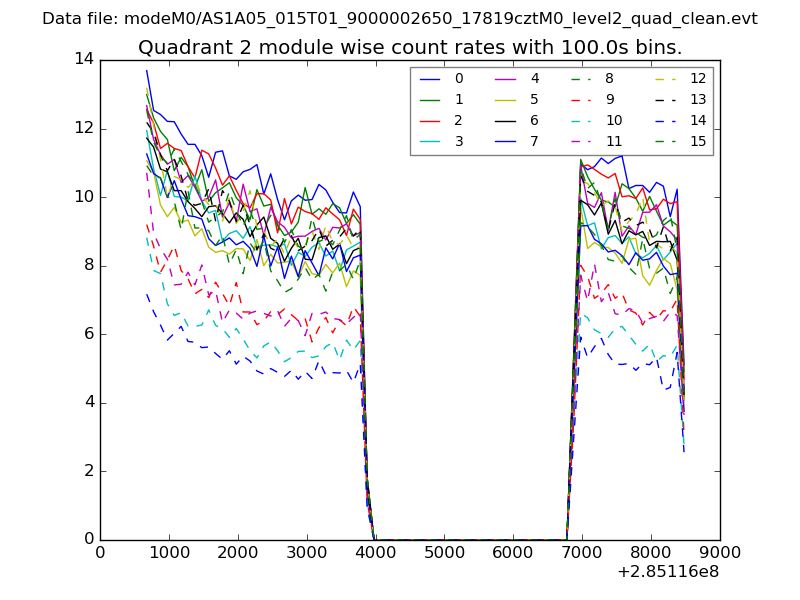
| Module-wise count rates for Quadrant B Data is divided into 100 sec bins |
 |
 |
| Module-wise count rates for Quadrant C Data is divided into 100 sec bins |
 |
 |
| Module-wise count rates for Quadrant D Data is divided into 100 sec bins |
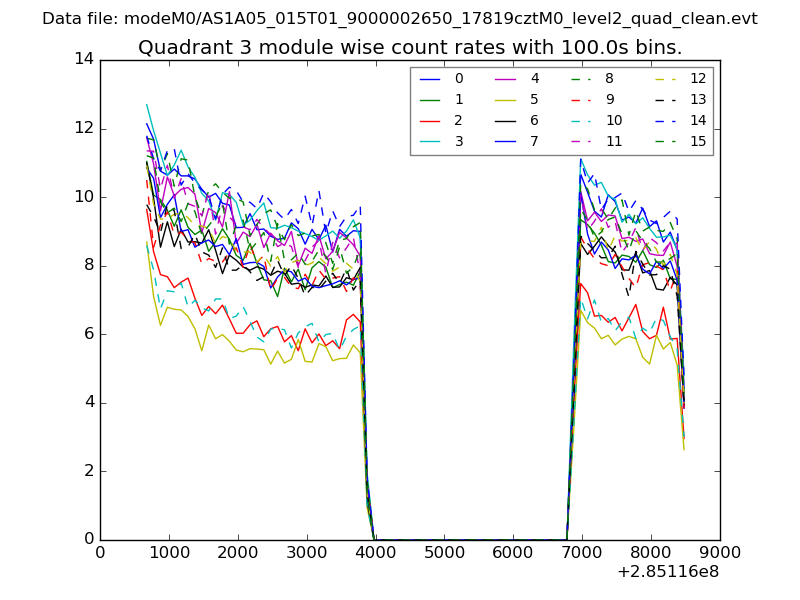 |
 |
| Parameter | Plot |
|---|---|
| CZT HV Monitor | 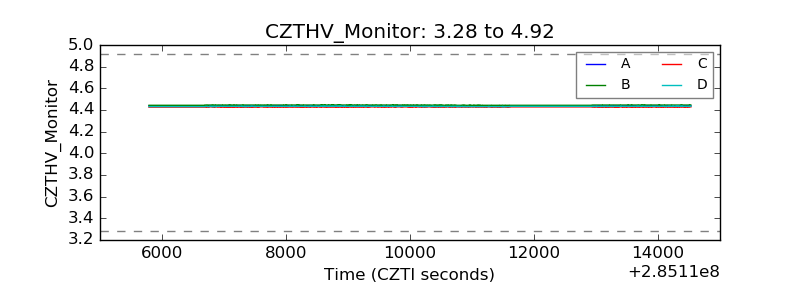 |
| D_VDD | 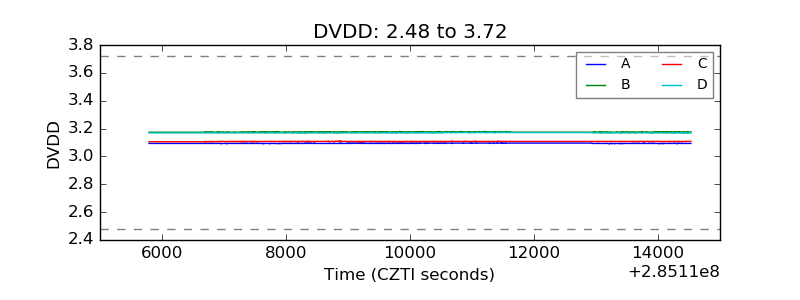 |
| Temperature 1 | 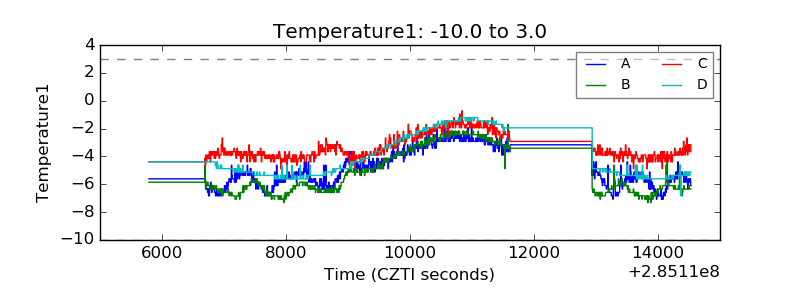 |
| Veto HV Monitor |  |
| Veto LLD | 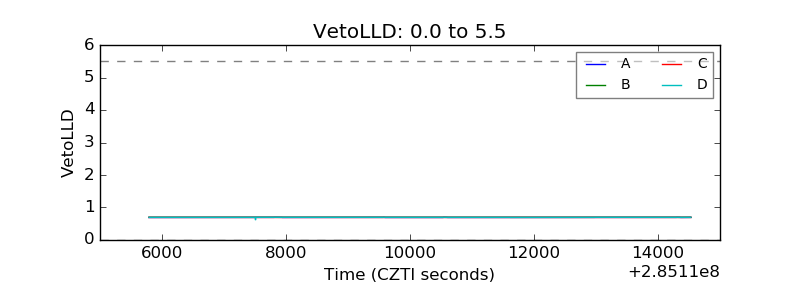 |
| Alpha Counter | 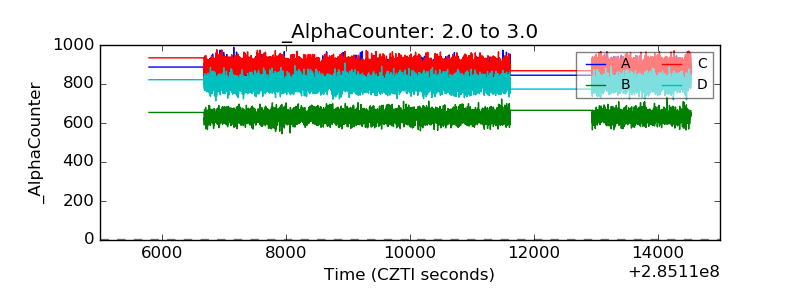 |
| _CPM_Rate | 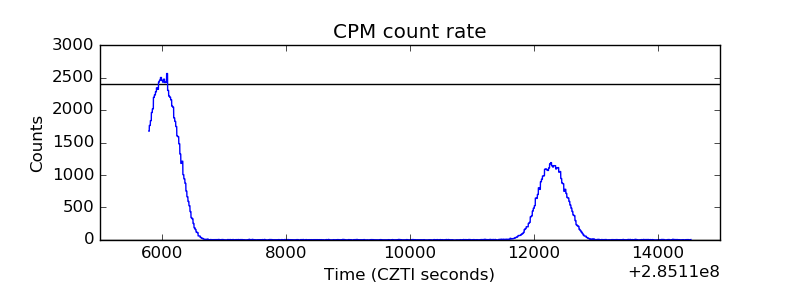 |
| CZT Counter | 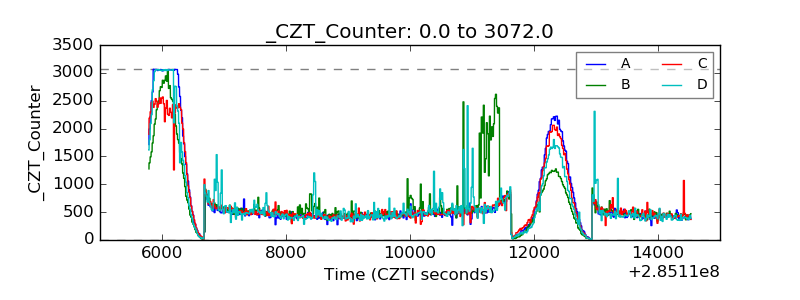 |
| +2.5 Volts monitor |  |
| +5 Volts monitor |  |
| _ROLL_ROT | 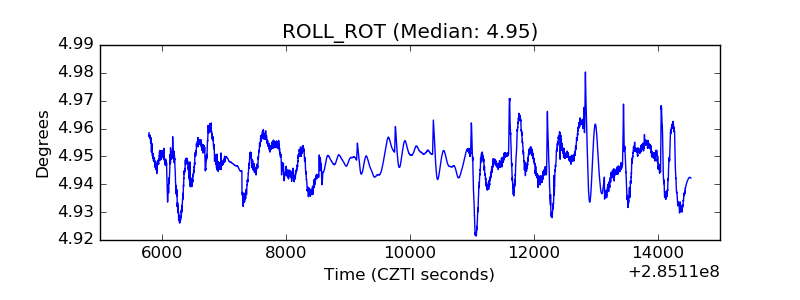 |
| _Roll_DEC | 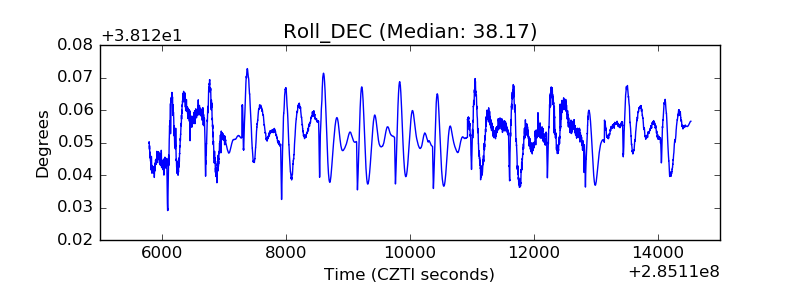 |
| _Roll_RA | 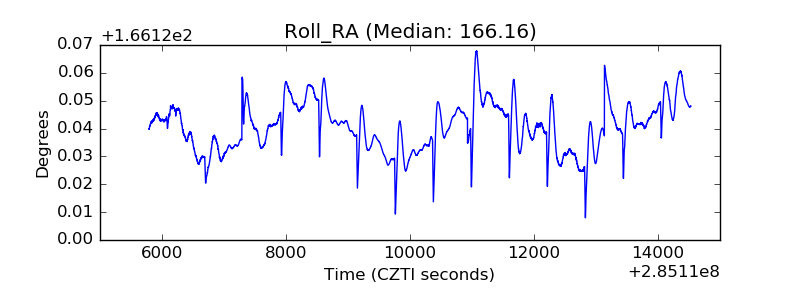 |
| Veto Counter |  |