| Param | Original file | Final file |
|---|---|---|
| Filename | modeM0/AS1A05_015T01_9000002650_17824cztM0_level2.evt | modeM0/AS1A05_015T01_9000002650_17824cztM0_level2_quad_clean.evt |
| Size (bytes) | 492,298,560 | 83,448,000 |
| Size | 469.5 MB | 79.6 MB |
| Events in quadrant A | 3,298,554 | 511,794 |
| Events in quadrant B | 3,891,266 | 520,465 |
| Events in quadrant C | 3,306,092 | 502,036 |
| Events in quadrant D | 3,924,198 | 491,260 |
| Mode SS | |||
|---|---|---|---|
| Quadrant | BADHDUFLAG | Total packets | Discarded packets |
| A | 0 | 146 | 0 |
| B | 0 | 146 | 0 |
| C | 0 | 146 | 0 |
| D | 0 | 146 | 0 |
| Mode M9 | |||
|---|---|---|---|
| Quadrant | BADHDUFLAG | Total packets | Discarded packets |
| A | 0 | 4 | 0 |
| B | 0 | 4 | 0 |
| C | 0 | 4 | 0 |
| D | 0 | 4 | 0 |
| Mode M0 | |||
|---|---|---|---|
| Quadrant | BADHDUFLAG | Total packets | Discarded packets |
| A | 0 | 14688 | 1 |
| B | 0 | 16122 | 1 |
| C | 0 | 14604 | 1 |
| D | 0 | 16708 | 1 |
| Quadrant | Total seconds | Saturated seconds | Saturation percentage |
|---|---|---|---|
| A | 7197 | 106 | 1.472836% |
| B | 7198 | 211 | 2.931370% |
| C | 7198 | 117 | 1.625452% |
| D | 7197 | 220 | 3.056829% |
Noise dominated data is calculated using 1-second bins in cleaned event files. If a bin has >2000 counts, and if more than 50% of those come from <1% of pixels, then it is considered to be noise-dominated and hence unusable.
| Quadrant | # 1 sec bins | Bins with >0 counts | Bins with >2000 counts | High rate bins dominated by noise | Noise dominated (total time) | Noise dominated (detector-on time) | Marked lightcurve |
|---|---|---|---|---|---|---|---|
| A | 7557 | 7198 | 0 | 0 | 0.00% | 0.00% | 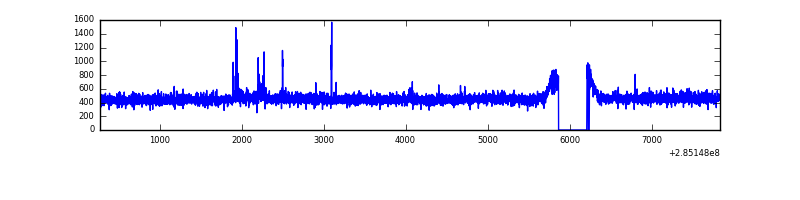 |
| B | 7558 | 7200 | 73 | 73 | 0.97% | 1.01% | 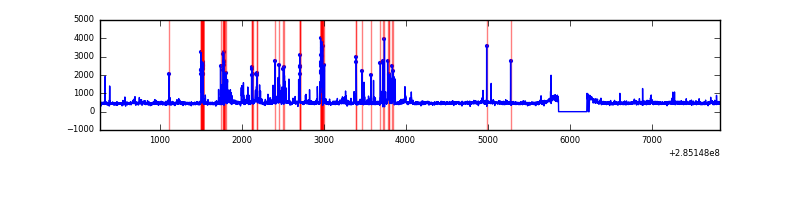 |
| C | 7558 | 7199 | 0 | 0 | 0.00% | 0.00% | 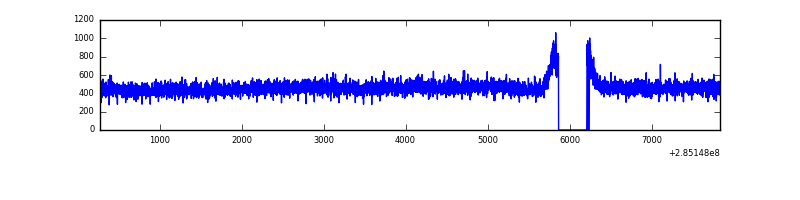 |
| D | 7557 | 7198 | 92 | 92 | 1.22% | 1.28% | 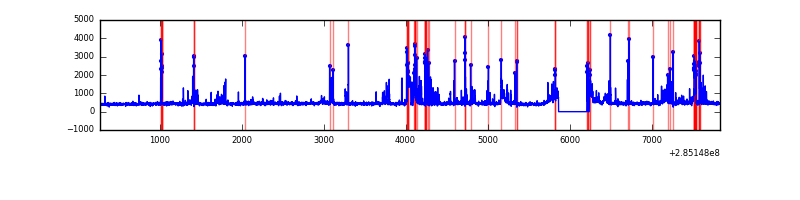 |
Top three noisy pixels from each quadrant. If the there are fewer than three noisy pixels in the level2.evt file, extra rows are filled as -1
| Pixel properties | Quadrant properties | ||||||
|---|---|---|---|---|---|---|---|
| Quadrant | DetID | PixID | Counts | Sigma | Mean | Median | Sigma |
| A | 15 | 174 | 26161 | 144.94 | 849 | 828 | 174.8 |
| A | 3 | 0 | 9832 | 51.52 | 849 | 828 | 174.8 |
| A | 0 | 226 | 7327 | 37.18 | 849 | 828 | 174.8 |
| B | 10 | 16 | 238469 | 1452.47 | 845 | 823 | 163.6 |
| B | 10 | 245 | 172578 | 1049.75 | 845 | 823 | 163.6 |
| B | 0 | 219 | 66578 | 401.89 | 845 | 823 | 163.6 |
| C | 14 | 238 | 124323 | 640.71 | 814 | 819 | 192.8 |
| C | 13 | 61 | 5818 | 25.93 | 814 | 819 | 192.8 |
| C | 1 | 16 | 4803 | 20.67 | 814 | 819 | 192.8 |
| D | 7 | 238 | 603670 | 3052.71 | 814 | 792 | 197.5 |
| D | 13 | 104 | 82948 | 416.0 | 814 | 792 | 197.5 |
| D | 10 | 70 | 80715 | 404.69 | 814 | 792 | 197.5 |
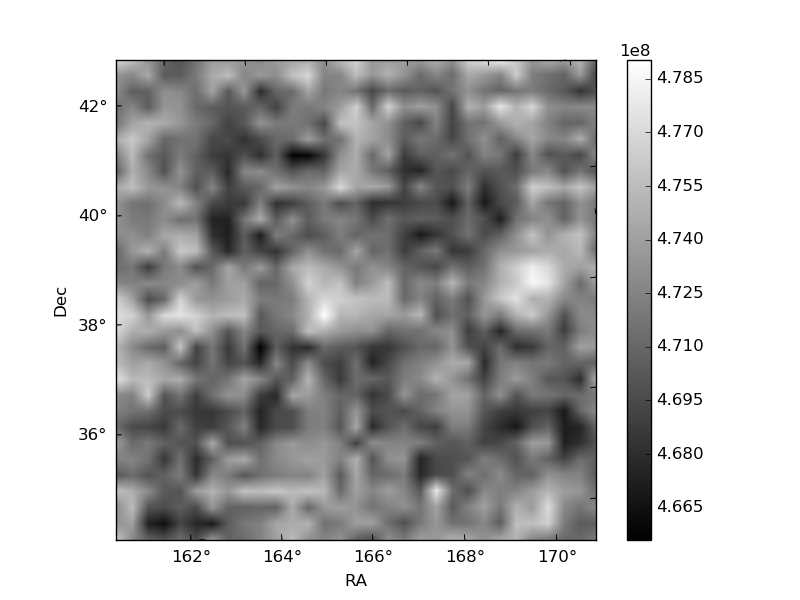
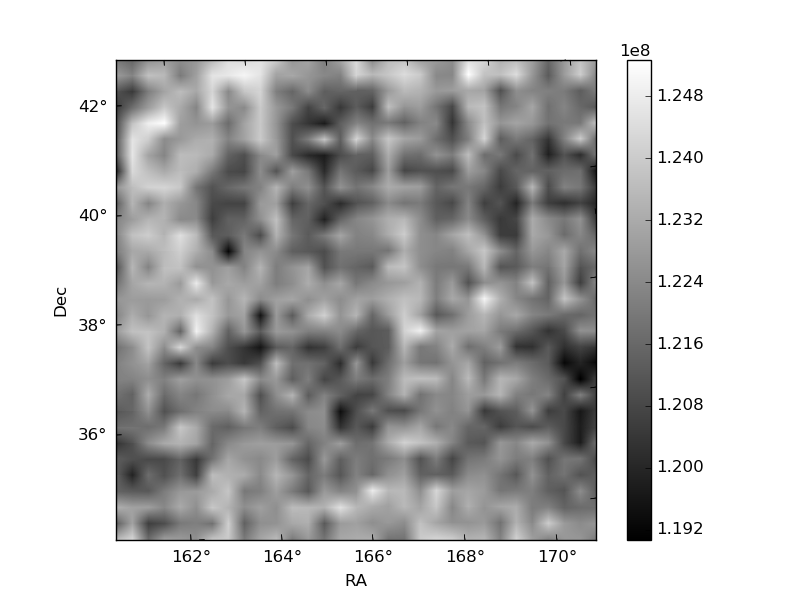
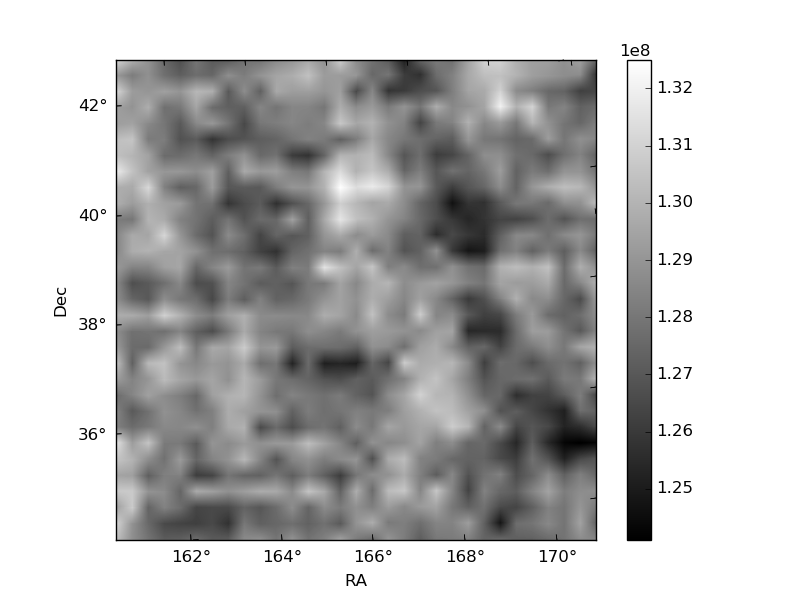
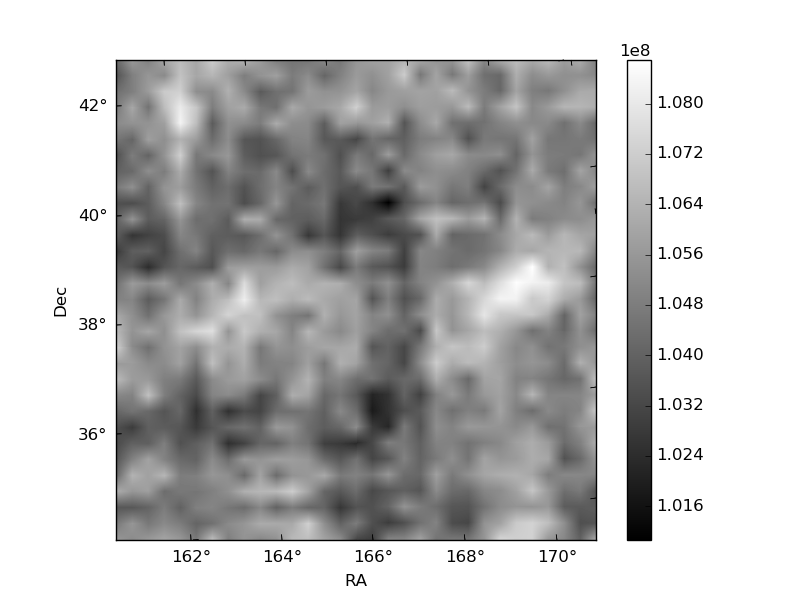
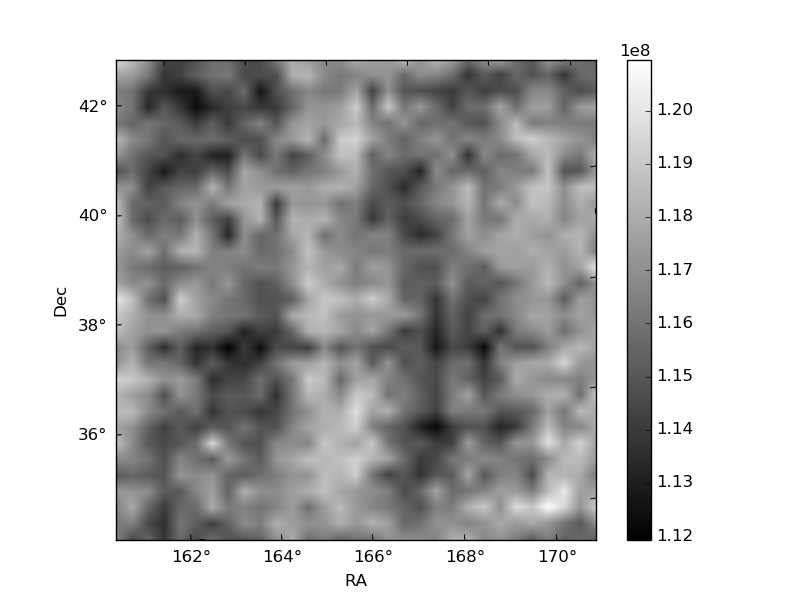
Histogram calculated using DETX and DETY for each event in the final _common_clean file
| Quadrant A | 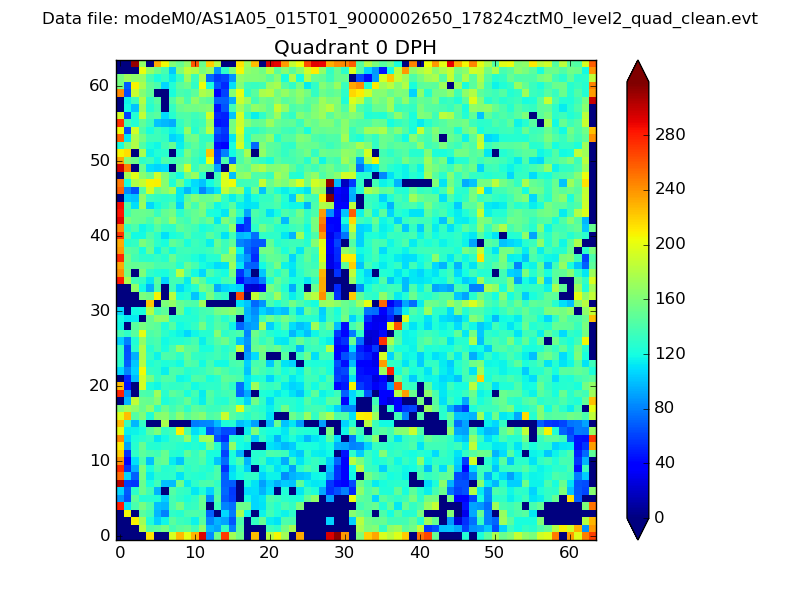 |
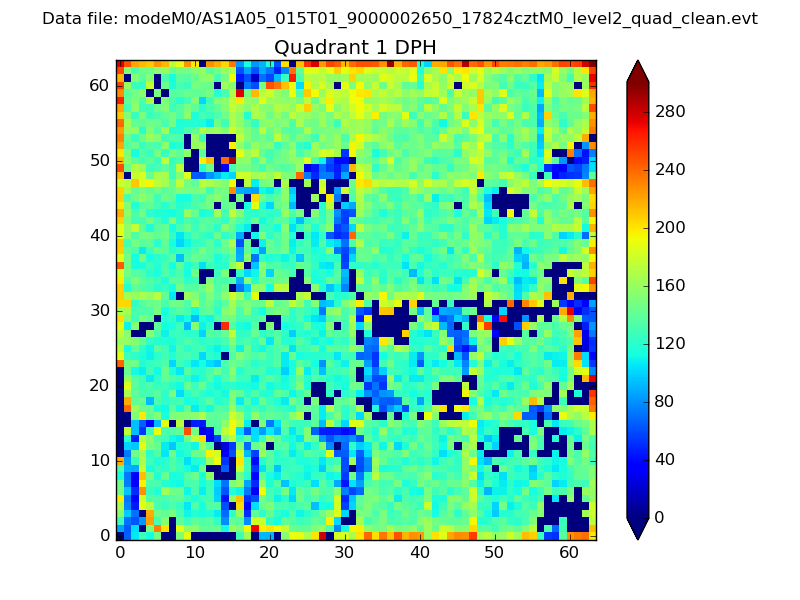 |
Quadrant B |
|---|---|---|---|
| Quadrant D | 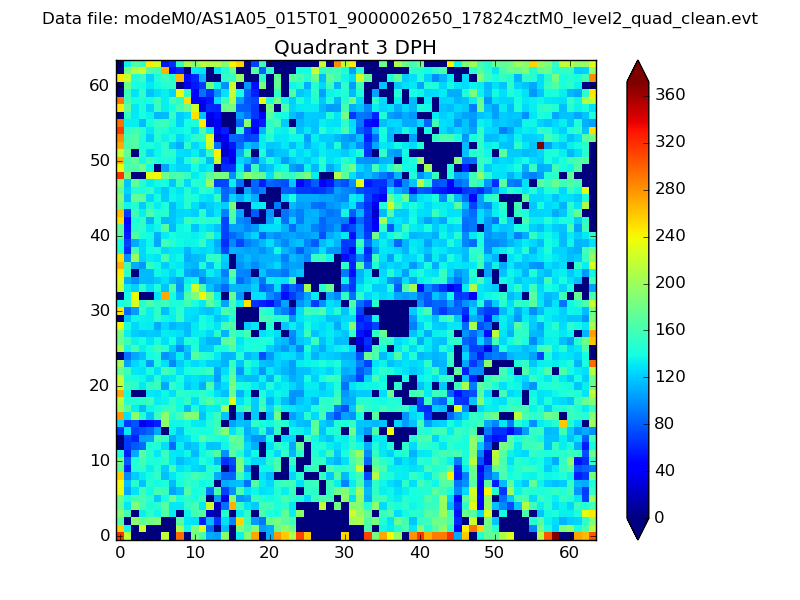 |
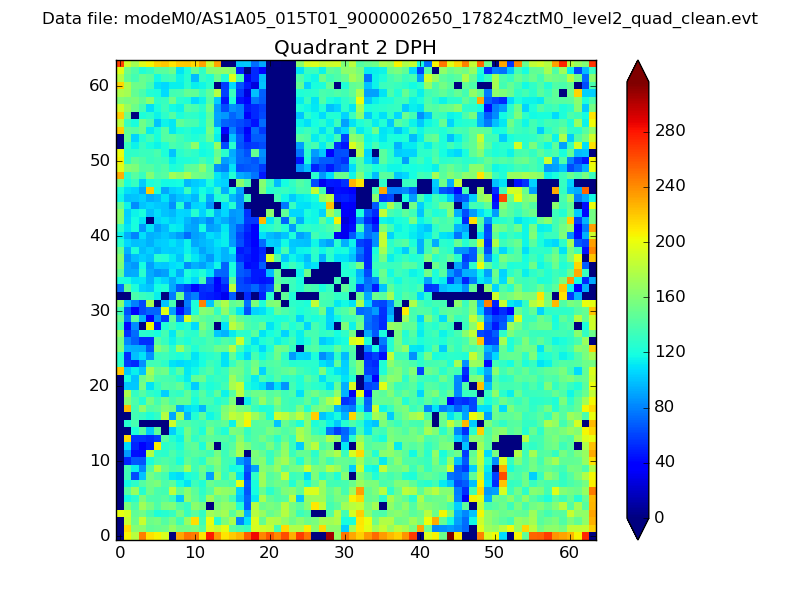 |
Quadrant C |
| Plot type | Count rate plots | Images |
|---|---|---|
| Comparison with Poisson distribution Blue bars denote a histogram of data divided into 1 sec bins. Red curve is a Poisson curve with rate = median count rate of data. |
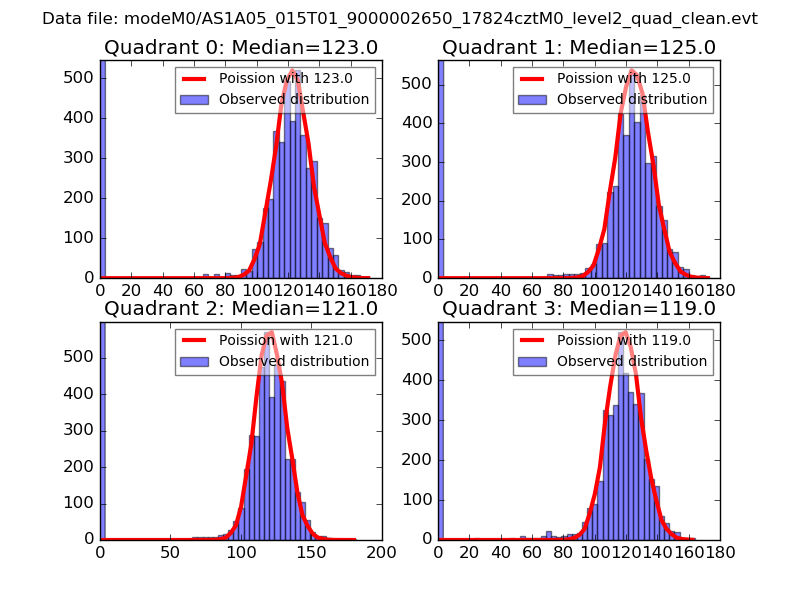 |
 |
| Quadrant-wise count rates Data is divided into 100 sec bins |
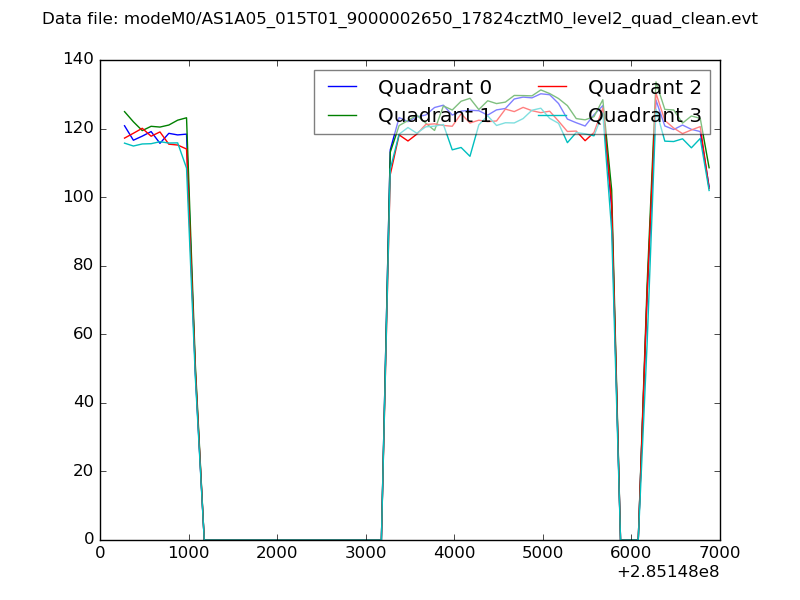 |
|
| Module-wise count rates for Quadrant A Data is divided into 100 sec bins |
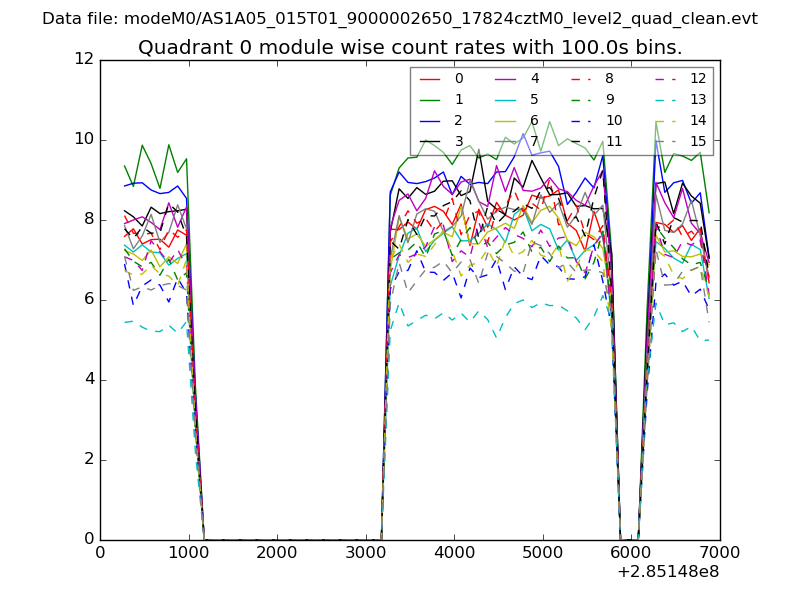 |
 |
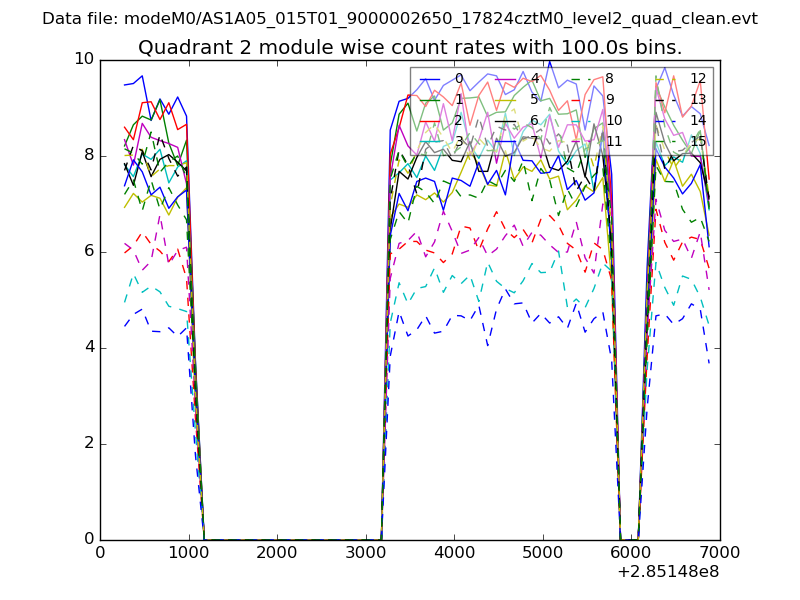
| Module-wise count rates for Quadrant B Data is divided into 100 sec bins |
 |
 |
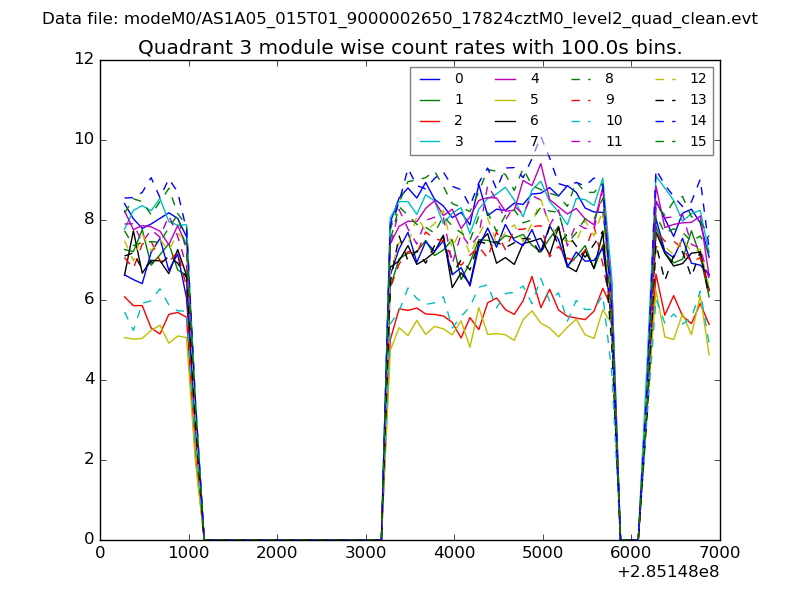
| Module-wise count rates for Quadrant C Data is divided into 100 sec bins |
 |
 |
| Module-wise count rates for Quadrant D Data is divided into 100 sec bins |
 |
 |
| Parameter | Plot |
|---|---|
| CZT HV Monitor | 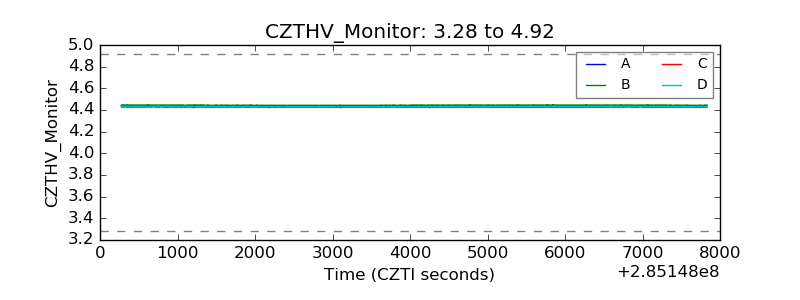 |
| D_VDD | 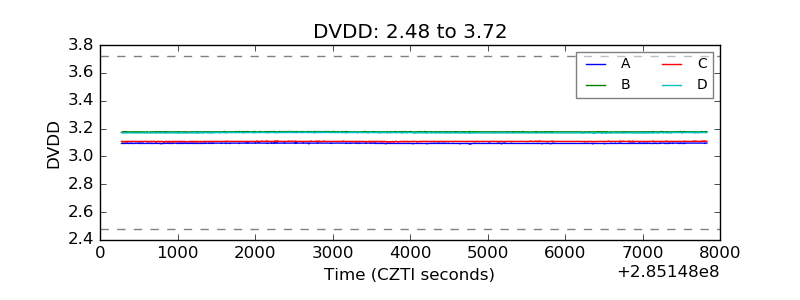 |
| Temperature 1 | 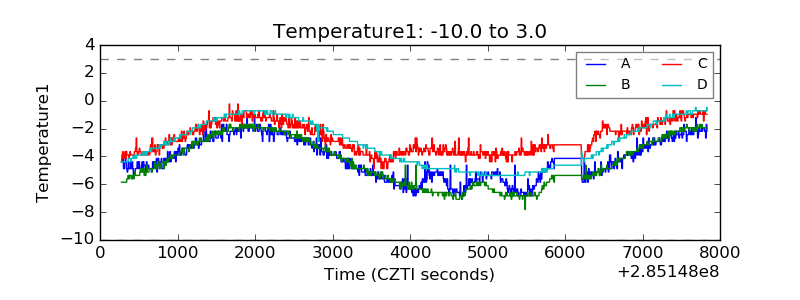 |
| Veto HV Monitor | 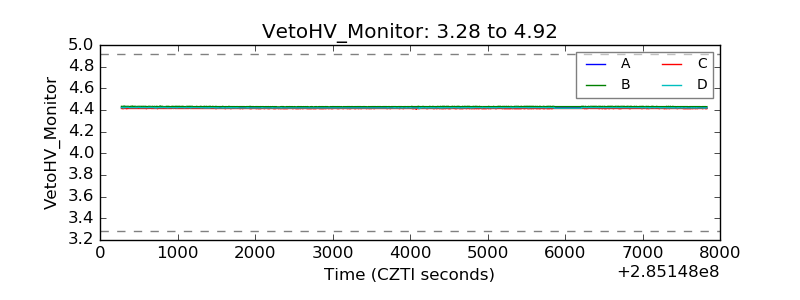 |
| Veto LLD | 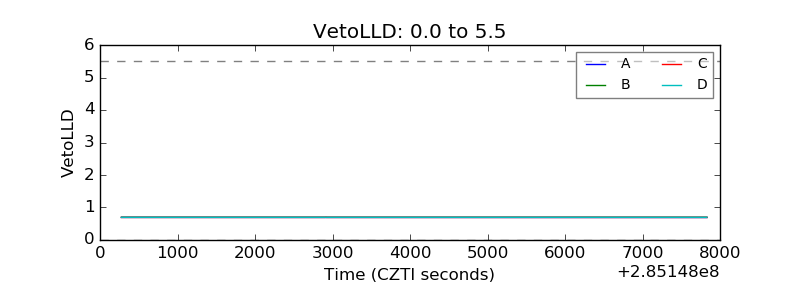 |
| Alpha Counter | 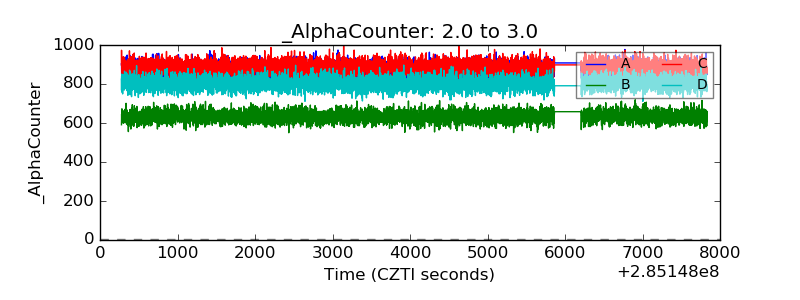 |
| _CPM_Rate | 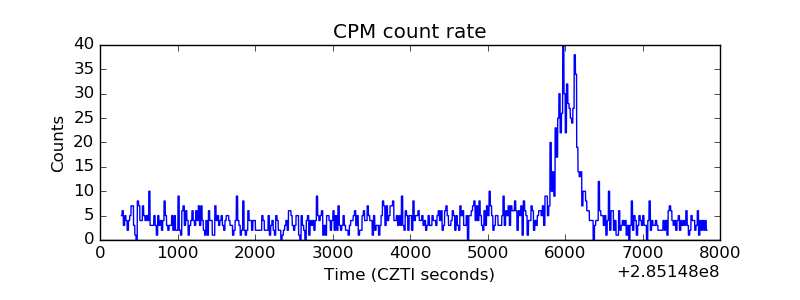 |
| CZT Counter | 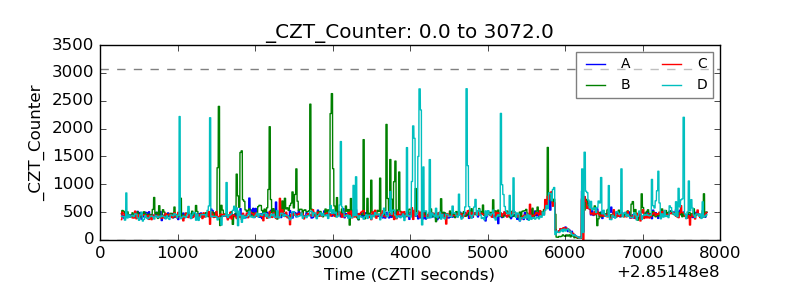 |
| +2.5 Volts monitor |  |
| +5 Volts monitor | 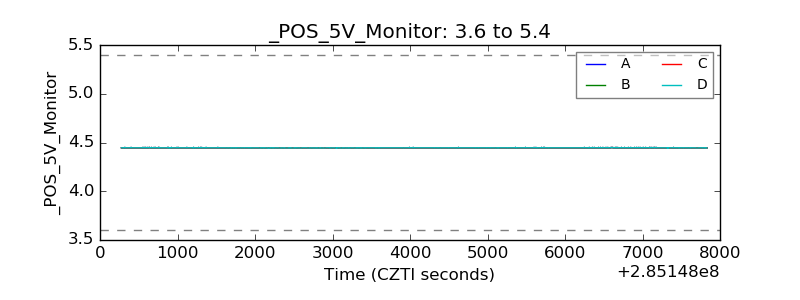 |
| _ROLL_ROT | 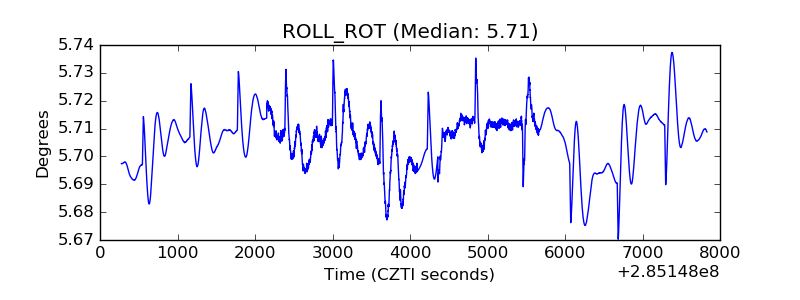 |
| _Roll_DEC | 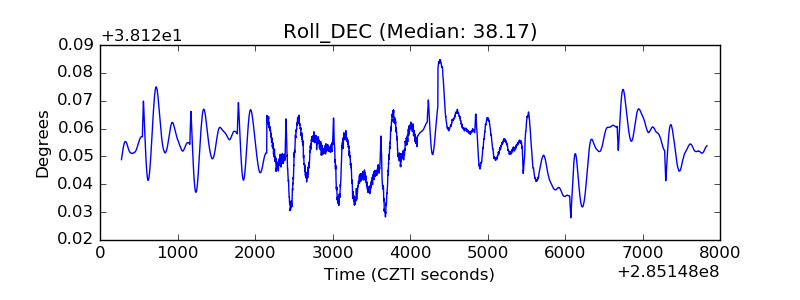 |
| _Roll_RA | 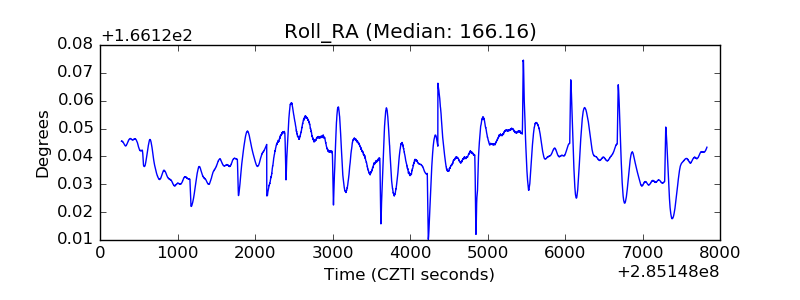 |
| Veto Counter | 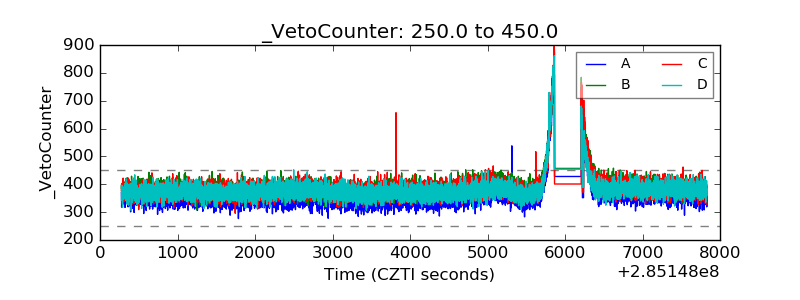 |