| Param | Original file | Final file |
|---|---|---|
| Filename | modeM0/AS1A05_015T01_9000002650_17826cztM0_level2.evt | modeM0/AS1A05_015T01_9000002650_17826cztM0_level2_quad_clean.evt |
| Size (bytes) | 892,753,920 | 135,881,280 |
| Size | 851.4 MB | 129.6 MB |
| Events in quadrant A | 6,143,642 | 825,235 |
| Events in quadrant B | 6,425,701 | 833,475 |
| Events in quadrant C | 5,879,928 | 804,901 |
| Events in quadrant D | 7,737,457 | 782,614 |
| Mode SS | |||
|---|---|---|---|
| Quadrant | BADHDUFLAG | Total packets | Discarded packets |
| A | 0 | 256 | 0 |
| B | 0 | 256 | 0 |
| C | 0 | 256 | 0 |
| D | 0 | 256 | 0 |
| Mode M9 | |||
|---|---|---|---|
| Quadrant | BADHDUFLAG | Total packets | Discarded packets |
| A | 0 | 13 | 0 |
| B | 0 | 13 | 0 |
| C | 0 | 13 | 0 |
| D | 0 | 13 | 0 |
| Mode M0 | |||
|---|---|---|---|
| Quadrant | BADHDUFLAG | Total packets | Discarded packets |
| A | 0 | 26602 | 2 |
| B | 0 | 27066 | 2 |
| C | 0 | 25519 | 2 |
| D | 0 | 31569 | 2 |
| Quadrant | Total seconds | Saturated seconds | Saturation percentage |
|---|---|---|---|
| A | 12560 | 136 | 1.082803% |
| B | 12561 | 211 | 1.679803% |
| C | 12561 | 158 | 1.257862% |
| D | 12560 | 593 | 4.721338% |
Noise dominated data is calculated using 1-second bins in cleaned event files. If a bin has >2000 counts, and if more than 50% of those come from <1% of pixels, then it is considered to be noise-dominated and hence unusable.
| Quadrant | # 1 sec bins | Bins with >0 counts | Bins with >2000 counts | High rate bins dominated by noise | Noise dominated (total time) | Noise dominated (detector-on time) | Marked lightcurve |
|---|---|---|---|---|---|---|---|
| A | 13895 | 12562 | 4 | 4 | 0.03% | 0.03% |  |
| B | 13896 | 12563 | 49 | 49 | 0.35% | 0.39% |  |
| C | 13896 | 12563 | 0 | 0 | 0.00% | 0.00% |  |
| D | 13895 | 12562 | 346 | 346 | 2.49% | 2.75% |  |
Top three noisy pixels from each quadrant. If the there are fewer than three noisy pixels in the level2.evt file, extra rows are filled as -1
| Pixel properties | Quadrant properties | ||||||
|---|---|---|---|---|---|---|---|
| Quadrant | DetID | PixID | Counts | Sigma | Mean | Median | Sigma |
| A | 15 | 174 | 377191 | 1243.45 | 1499 | 1464 | 302.2 |
| A | 0 | 226 | 12954 | 38.03 | 1499 | 1464 | 302.2 |
| A | 3 | 137 | 11423 | 32.96 | 1499 | 1464 | 302.2 |
| B | 7 | 220 | 168832 | 577.55 | 1494 | 1451 | 289.8 |
| B | 10 | 245 | 114086 | 388.65 | 1494 | 1451 | 289.8 |
| B | 10 | 16 | 89216 | 302.83 | 1494 | 1451 | 289.8 |
| C | 14 | 238 | 219193 | 646.45 | 1435 | 1443 | 336.8 |
| C | 3 | 233 | 44298 | 127.23 | 1435 | 1443 | 336.8 |
| C | 5 | 218 | 21917 | 60.78 | 1435 | 1443 | 336.8 |
| D | 7 | 238 | 1928267 | 5607.91 | 1425 | 1390 | 343.6 |
| D | 10 | 70 | 148244 | 427.4 | 1425 | 1390 | 343.6 |
| D | 13 | 104 | 80273 | 229.58 | 1425 | 1390 | 343.6 |
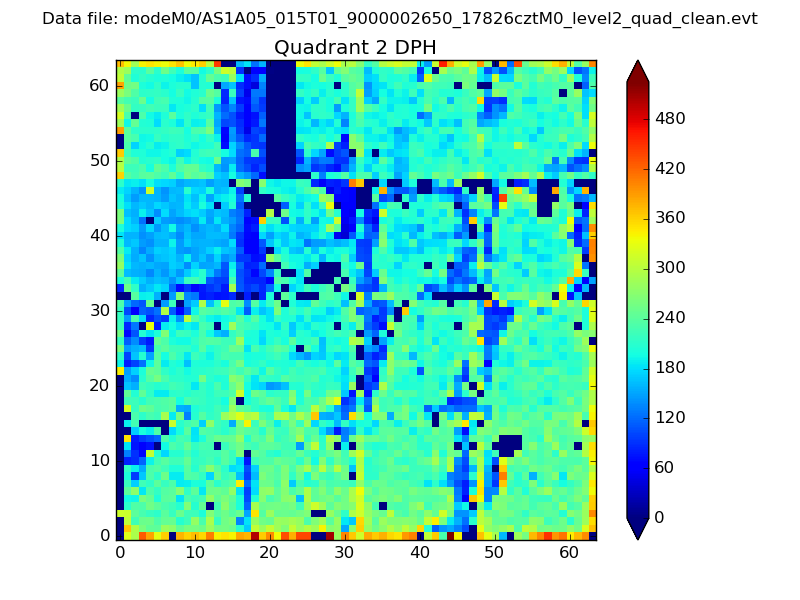
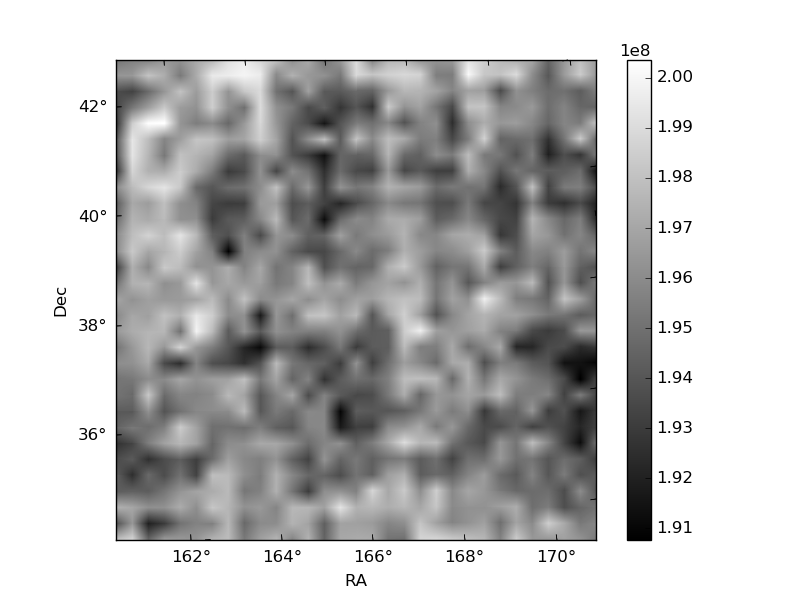
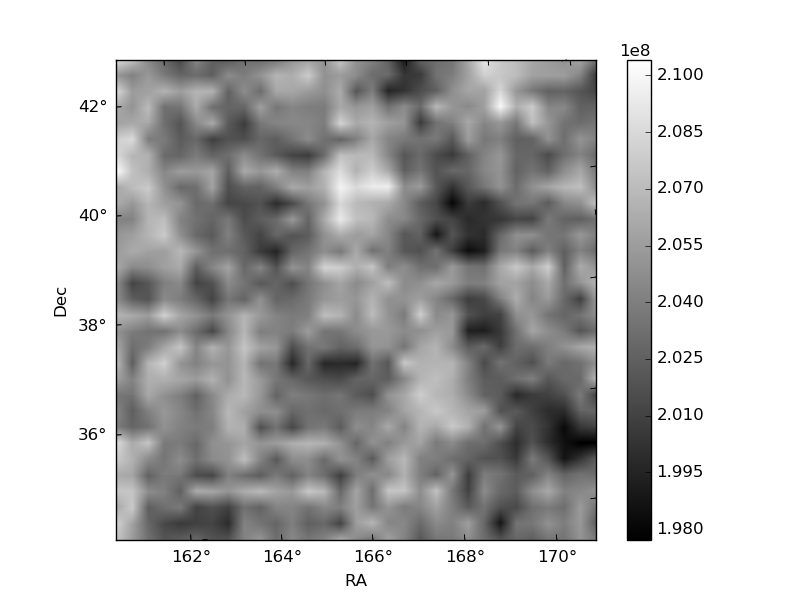
Histogram calculated using DETX and DETY for each event in the final _common_clean file
| Quadrant A | 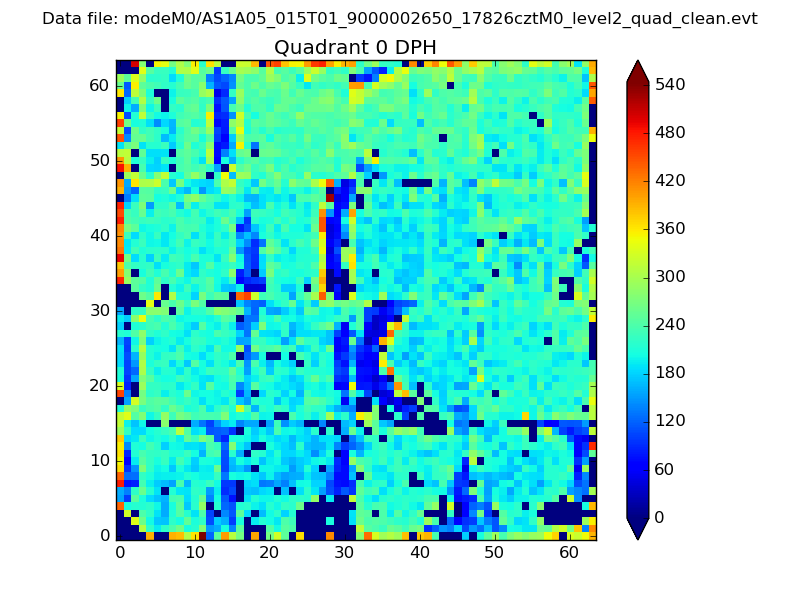 |
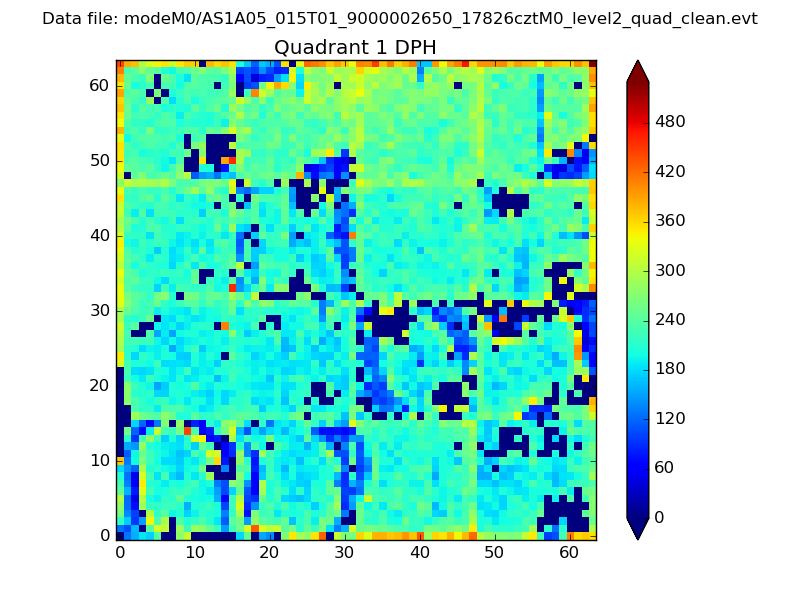 |
Quadrant B |
|---|---|---|---|
| Quadrant D | 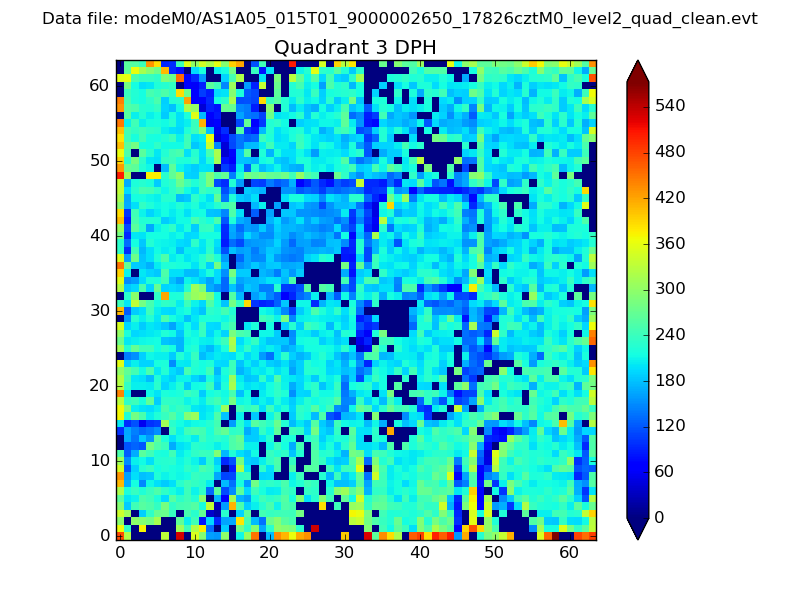 |
 |
Quadrant C |
| Plot type | Count rate plots | Images |
|---|---|---|
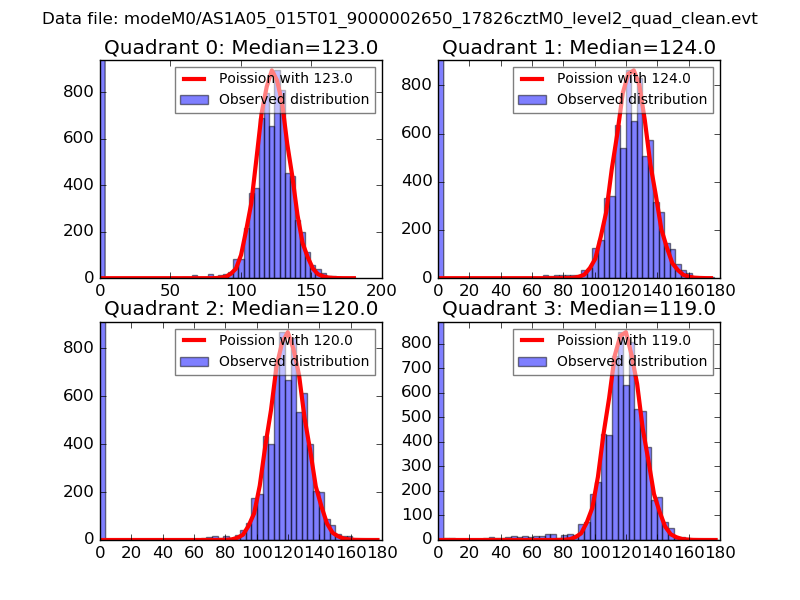
| Comparison with Poisson distribution Blue bars denote a histogram of data divided into 1 sec bins. Red curve is a Poisson curve with rate = median count rate of data. |
 |
 |
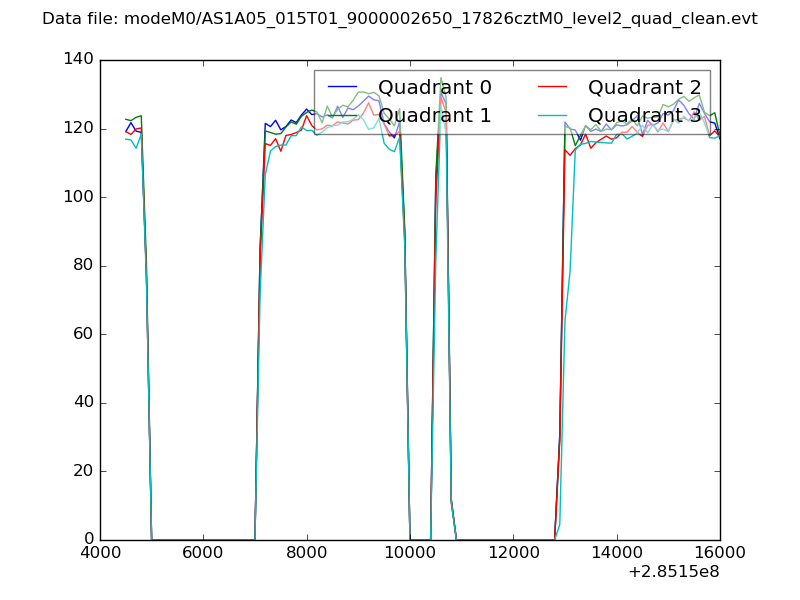
| Quadrant-wise count rates Data is divided into 100 sec bins |
 |
|
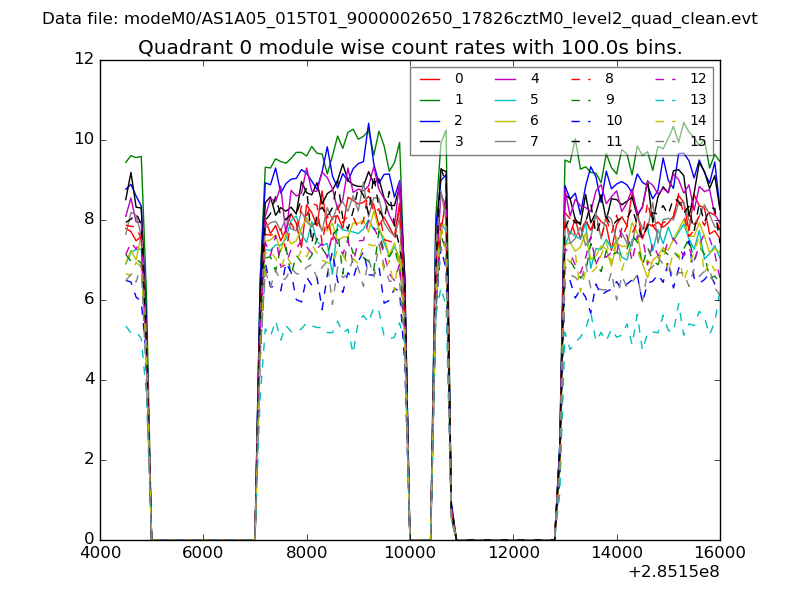
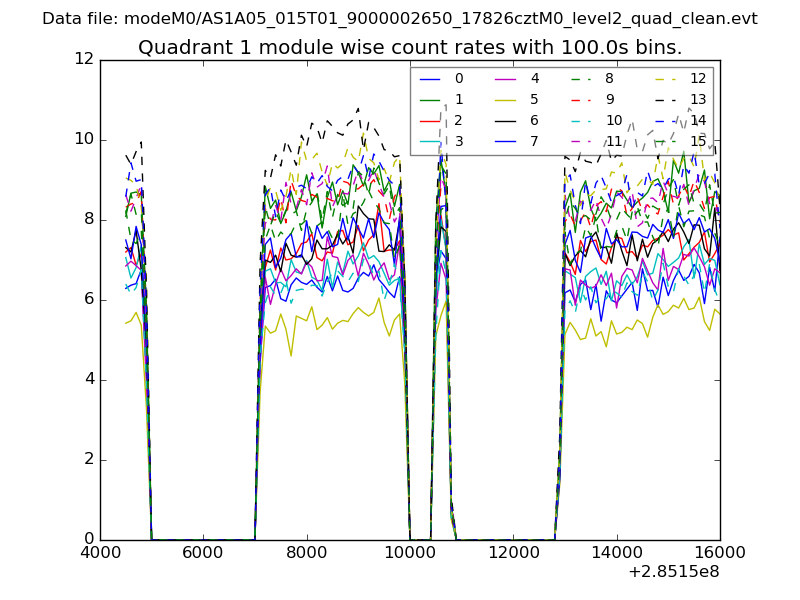
| Module-wise count rates for Quadrant A Data is divided into 100 sec bins |
 |
 |
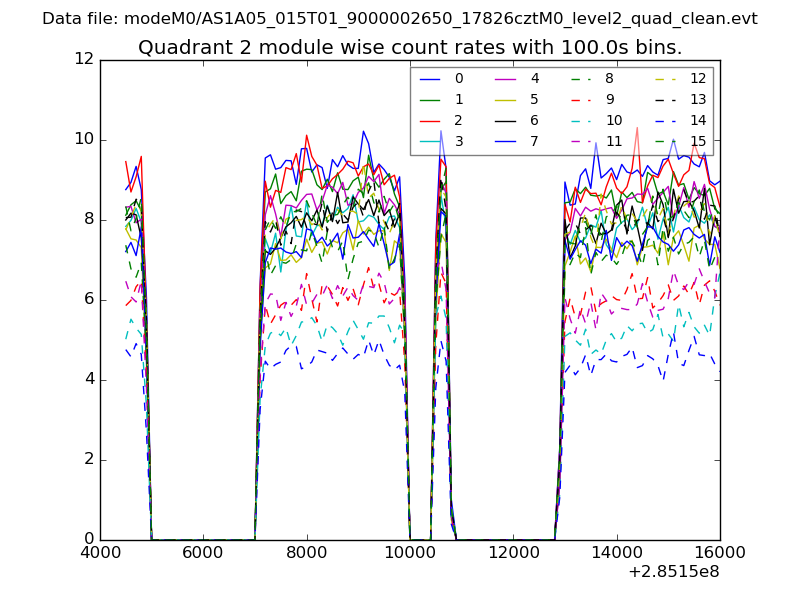
| Module-wise count rates for Quadrant B Data is divided into 100 sec bins |
 |
 |
| Module-wise count rates for Quadrant C Data is divided into 100 sec bins |
 |
 |
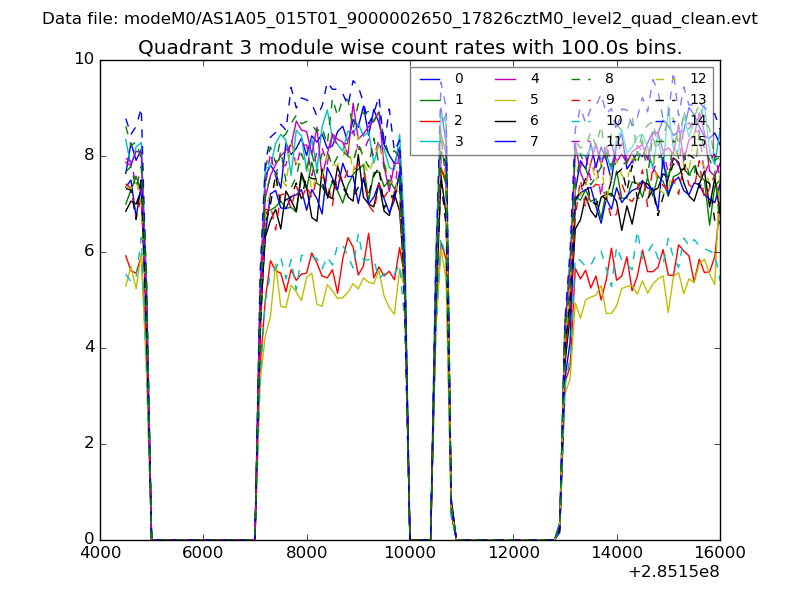
| Module-wise count rates for Quadrant D Data is divided into 100 sec bins |
 |
 |
| Parameter | Plot |
|---|---|
| CZT HV Monitor | 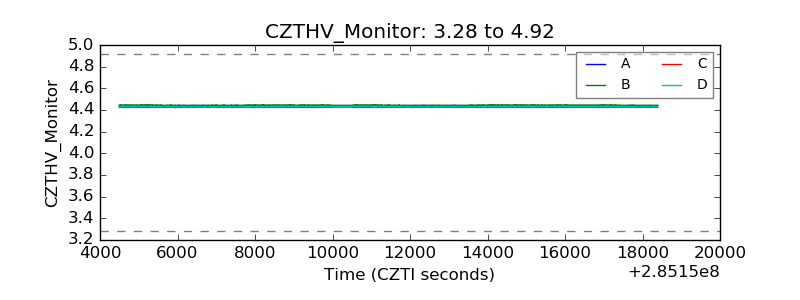 |
| D_VDD | 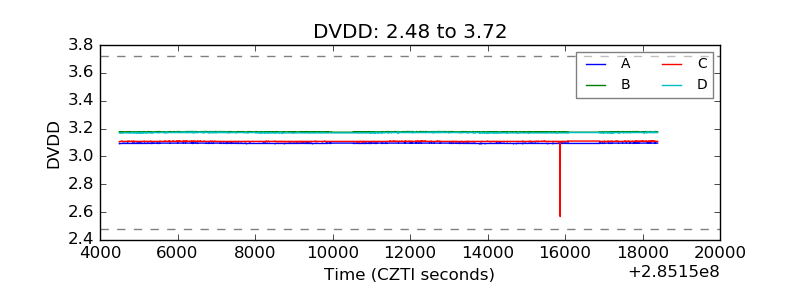 |
| Temperature 1 | 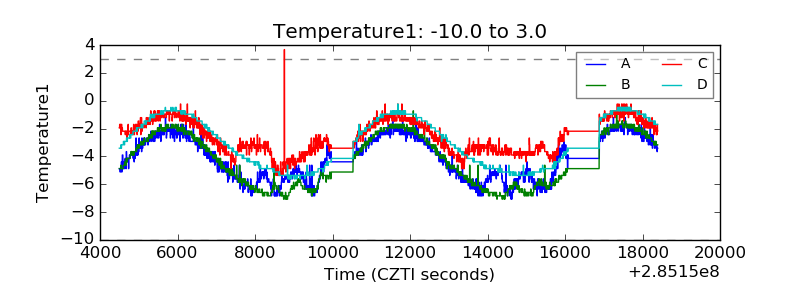 |
| Veto HV Monitor | 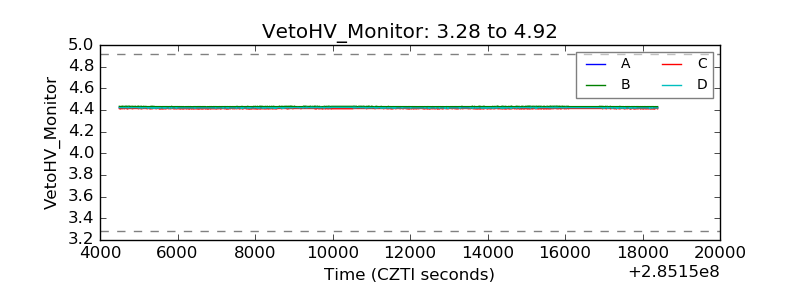 |
| Veto LLD | 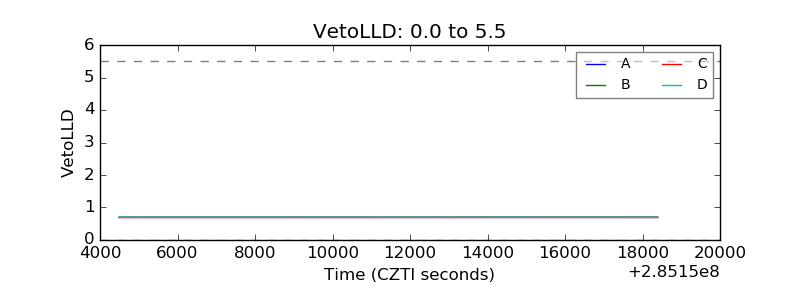 |
| Alpha Counter | 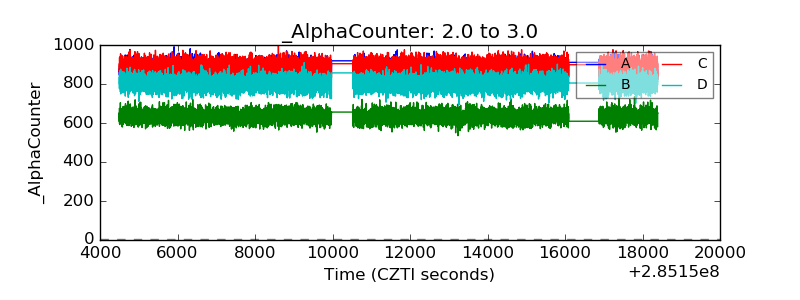 |
| _CPM_Rate | 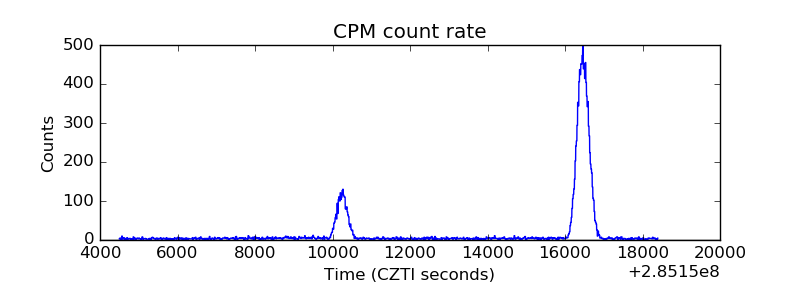 |
| CZT Counter | 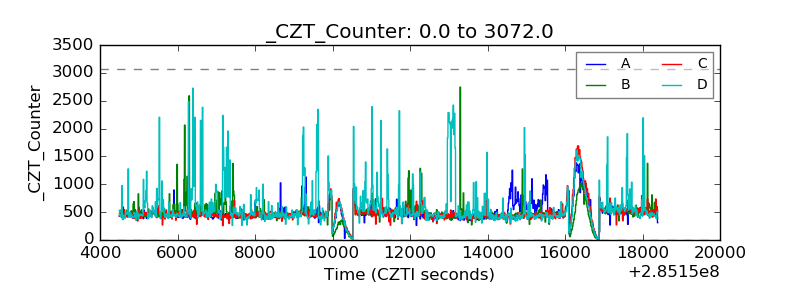 |
| +2.5 Volts monitor |  |
| +5 Volts monitor |  |
| _ROLL_ROT | 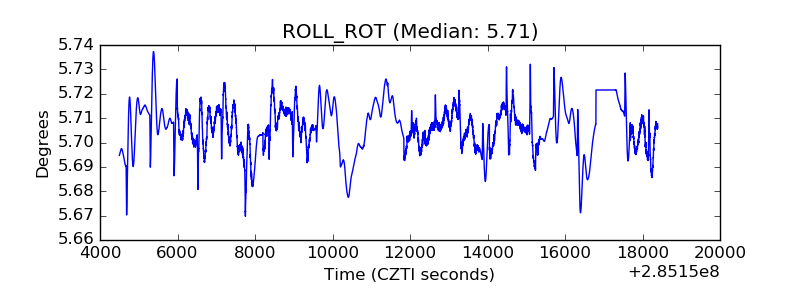 |
| _Roll_DEC | 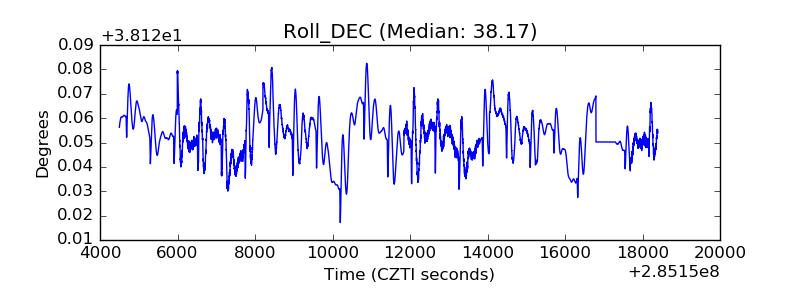 |
| _Roll_RA | 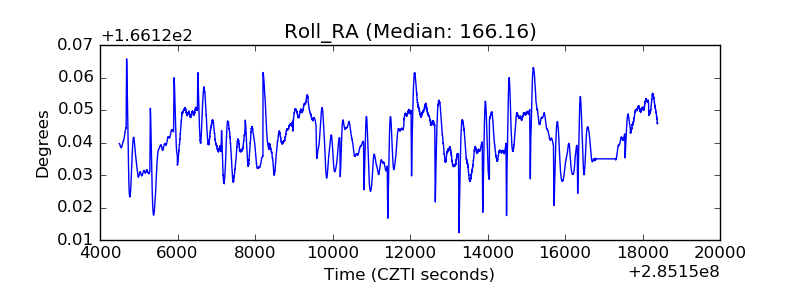 |
| Veto Counter | 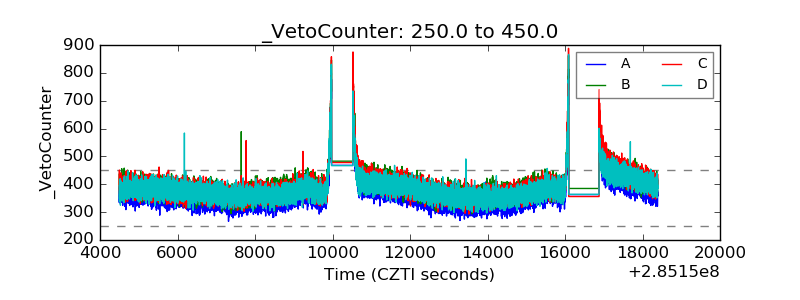 |