| Param | Original file | Final file |
|---|---|---|
| Filename | modeM0/AS1A05_015T01_9000002650_17827cztM0_level2.evt | modeM0/AS1A05_015T01_9000002650_17827cztM0_level2_quad_clean.evt |
| Size (bytes) | 460,874,880 | 70,171,200 |
| Size | 439.5 MB | 66.9 MB |
| Events in quadrant A | 3,211,846 | 418,758 |
| Events in quadrant B | 3,384,416 | 422,234 |
| Events in quadrant C | 3,261,430 | 407,925 |
| Events in quadrant D | 3,642,235 | 406,145 |
| Mode SS | |||
|---|---|---|---|
| Quadrant | BADHDUFLAG | Total packets | Discarded packets |
| A | 0 | 140 | 0 |
| B | 0 | 140 | 0 |
| C | 0 | 140 | 0 |
| D | 0 | 140 | 0 |
| Mode M9 | |||
|---|---|---|---|
| Quadrant | BADHDUFLAG | Total packets | Discarded packets |
| A | 0 | 17 | 0 |
| B | 0 | 17 | 0 |
| C | 0 | 17 | 0 |
| D | 0 | 17 | 0 |
| Mode M0 | |||
|---|---|---|---|
| Quadrant | BADHDUFLAG | Total packets | Discarded packets |
| A | 0 | 13954 | 2 |
| B | 0 | 14419 | 2 |
| C | 0 | 13985 | 2 |
| D | 0 | 15413 | 2 |
| Quadrant | Total seconds | Saturated seconds | Saturation percentage |
|---|---|---|---|
| A | 6731 | 76 | 1.129104% |
| B | 6732 | 81 | 1.203209% |
| C | 6732 | 97 | 1.440879% |
| D | 6732 | 145 | 2.153892% |
Noise dominated data is calculated using 1-second bins in cleaned event files. If a bin has >2000 counts, and if more than 50% of those come from <1% of pixels, then it is considered to be noise-dominated and hence unusable.
| Quadrant | # 1 sec bins | Bins with >0 counts | Bins with >2000 counts | High rate bins dominated by noise | Noise dominated (total time) | Noise dominated (detector-on time) | Marked lightcurve |
|---|---|---|---|---|---|---|---|
| A | 8476 | 6732 | 0 | 0 | 0.00% | 0.00% | 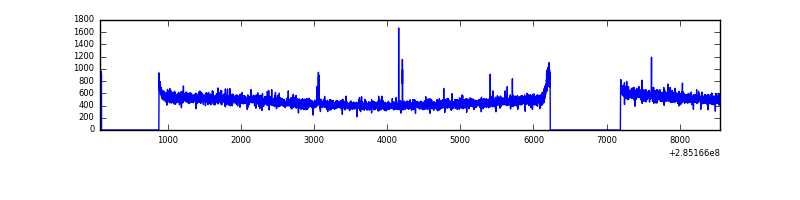 |
| B | 8477 | 6733 | 4 | 4 | 0.05% | 0.06% | 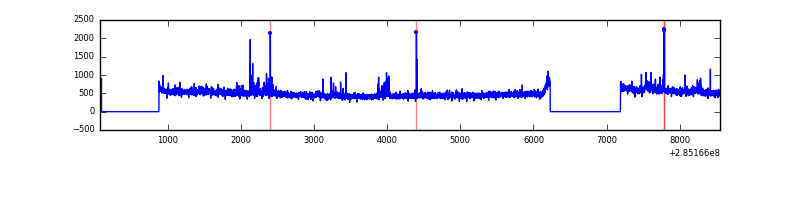 |
| C | 8477 | 6733 | 0 | 0 | 0.00% | 0.00% | 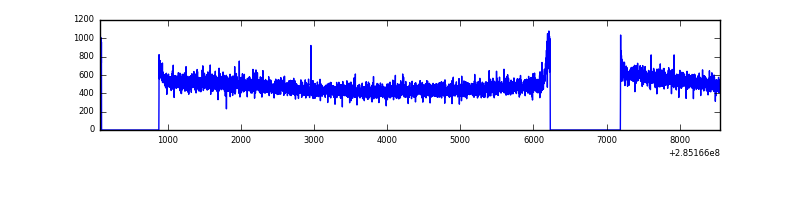 |
| D | 8477 | 6733 | 42 | 42 | 0.50% | 0.62% | 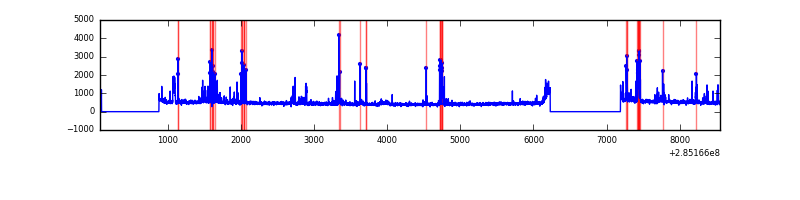 |
Top three noisy pixels from each quadrant. If the there are fewer than three noisy pixels in the level2.evt file, extra rows are filled as -1
| Pixel properties | Quadrant properties | ||||||
|---|---|---|---|---|---|---|---|
| Quadrant | DetID | PixID | Counts | Sigma | Mean | Median | Sigma |
| A | 15 | 174 | 8835 | 47.6 | 830 | 812 | 168.5 |
| A | 0 | 226 | 7293 | 38.45 | 830 | 812 | 168.5 |
| A | 12 | 194 | 6305 | 32.59 | 830 | 812 | 168.5 |
| B | 7 | 220 | 44457 | 273.55 | 827 | 804 | 159.6 |
| B | 4 | 216 | 31128 | 190.02 | 827 | 804 | 159.6 |
| B | 0 | 230 | 22842 | 138.1 | 827 | 804 | 159.6 |
| C | 14 | 238 | 122333 | 649.27 | 798 | 801 | 187.2 |
| C | 5 | 218 | 16461 | 83.66 | 798 | 801 | 187.2 |
| C | 1 | 16 | 7661 | 36.65 | 798 | 801 | 187.2 |
| D | 7 | 238 | 464672 | 2366.01 | 805 | 786 | 196.1 |
| D | 10 | 70 | 82148 | 414.98 | 805 | 786 | 196.1 |
| D | 2 | 234 | 28446 | 141.08 | 805 | 786 | 196.1 |
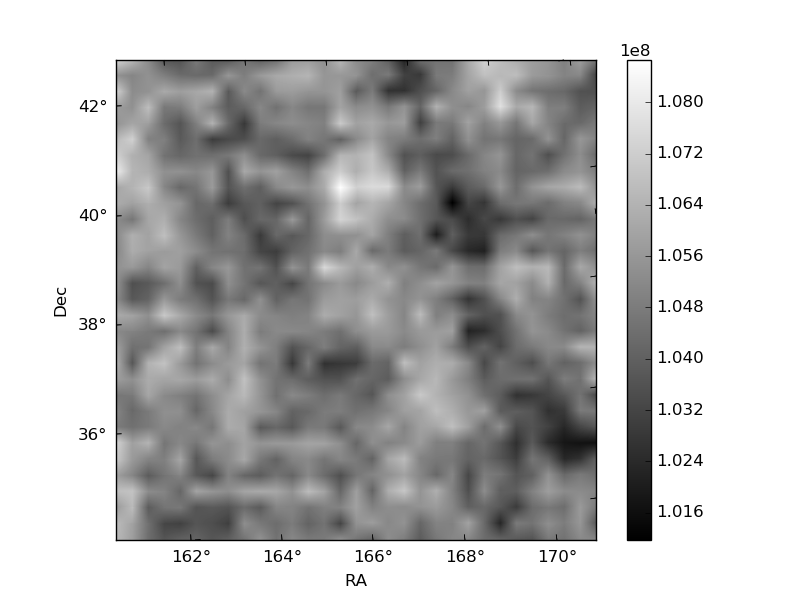
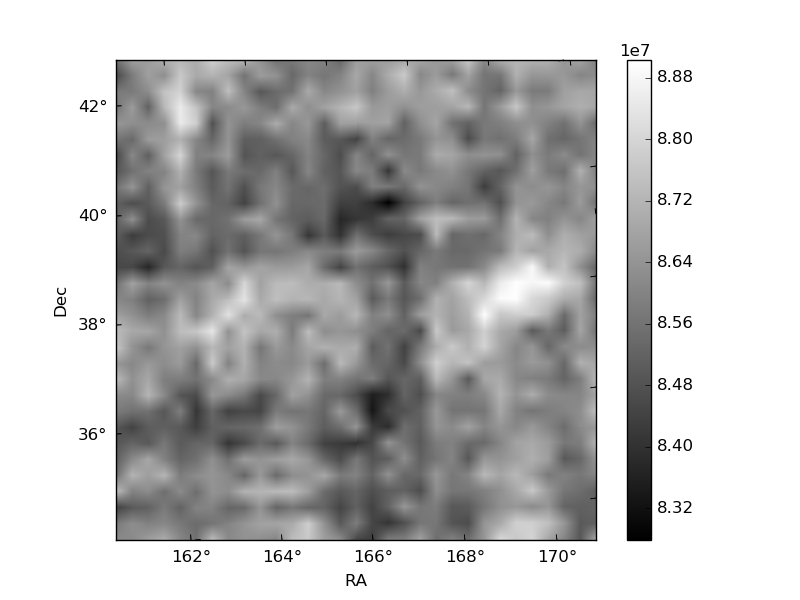
Histogram calculated using DETX and DETY for each event in the final _common_clean file
| Quadrant A |  |
 |
Quadrant B |
|---|---|---|---|
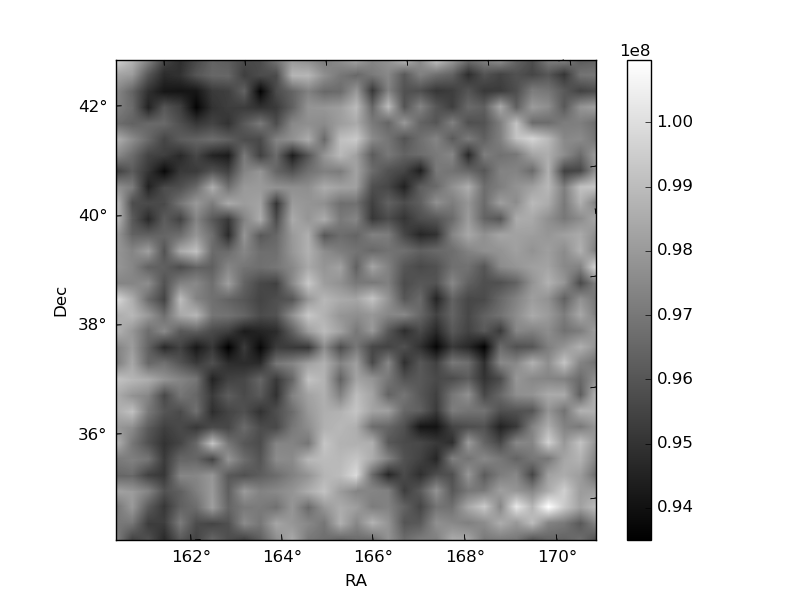
| Quadrant D |  |
 |
Quadrant C |
| Plot type | Count rate plots | Images |
|---|---|---|
| Comparison with Poisson distribution Blue bars denote a histogram of data divided into 1 sec bins. Red curve is a Poisson curve with rate = median count rate of data. |
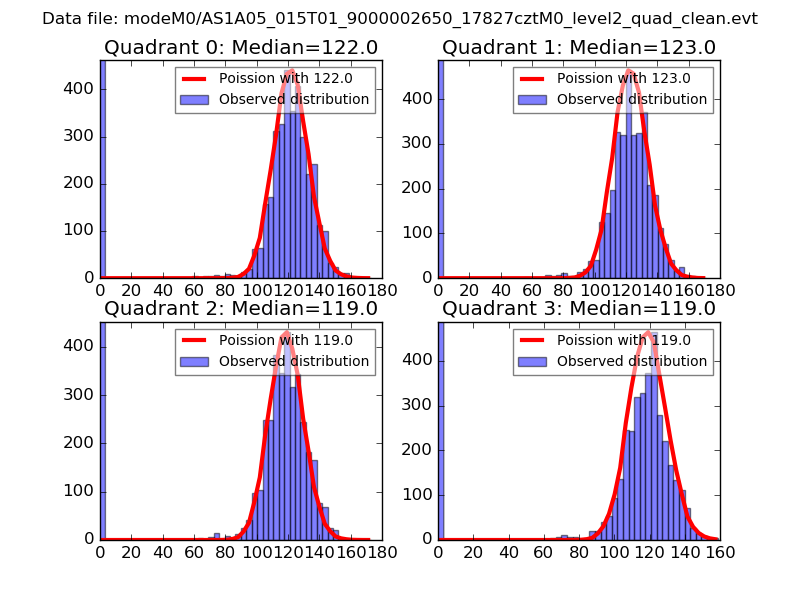 |
 |
| Quadrant-wise count rates Data is divided into 100 sec bins |
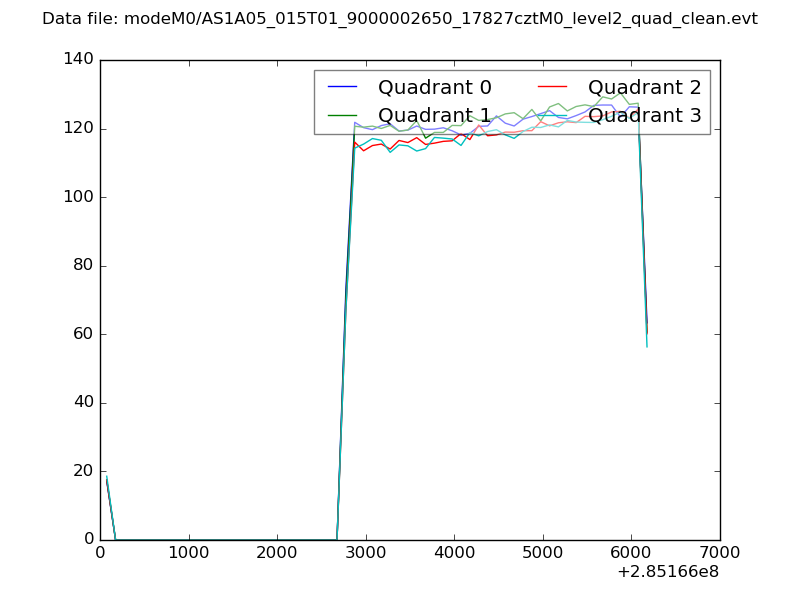 |
|
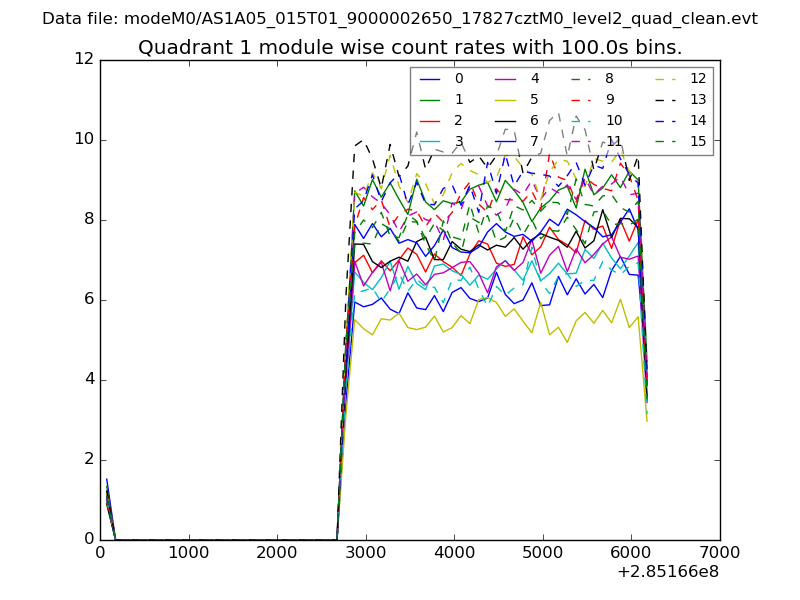
| Module-wise count rates for Quadrant A Data is divided into 100 sec bins |
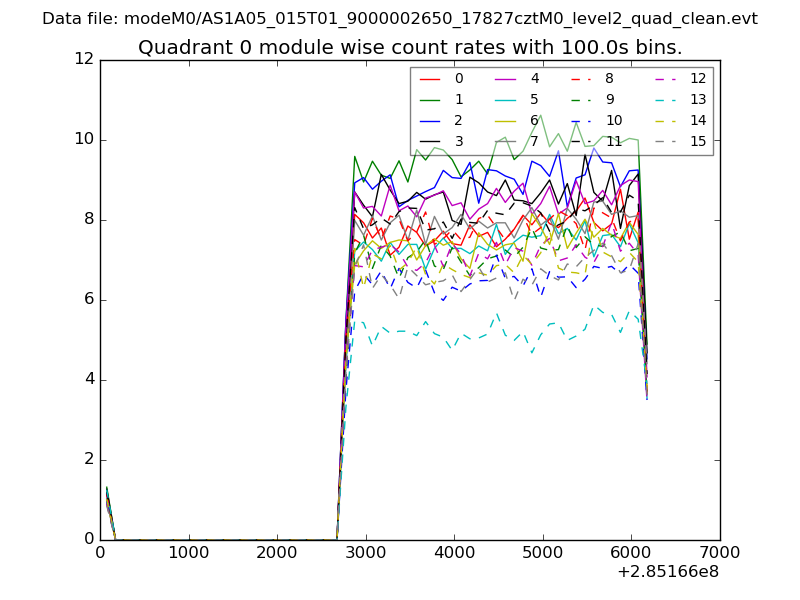 |
 |
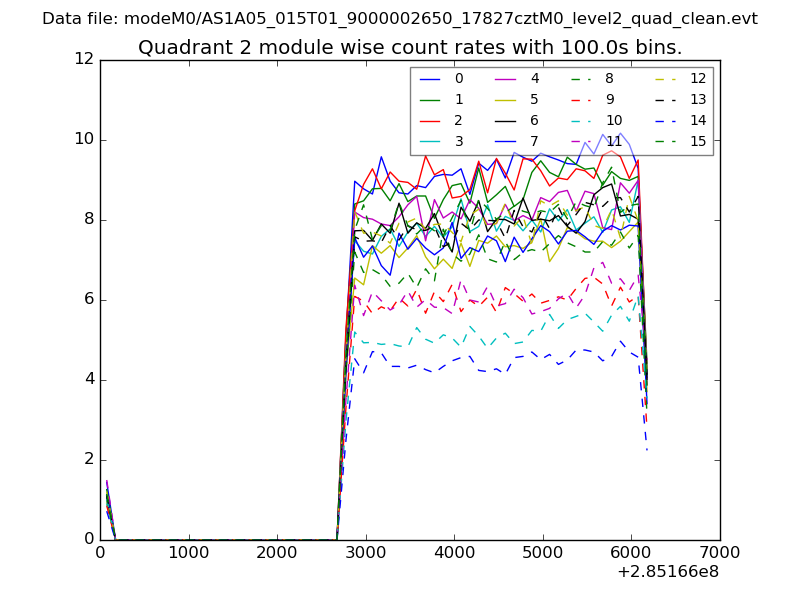
| Module-wise count rates for Quadrant B Data is divided into 100 sec bins |
 |
 |
| Module-wise count rates for Quadrant C Data is divided into 100 sec bins |
 |
 |
| Module-wise count rates for Quadrant D Data is divided into 100 sec bins |
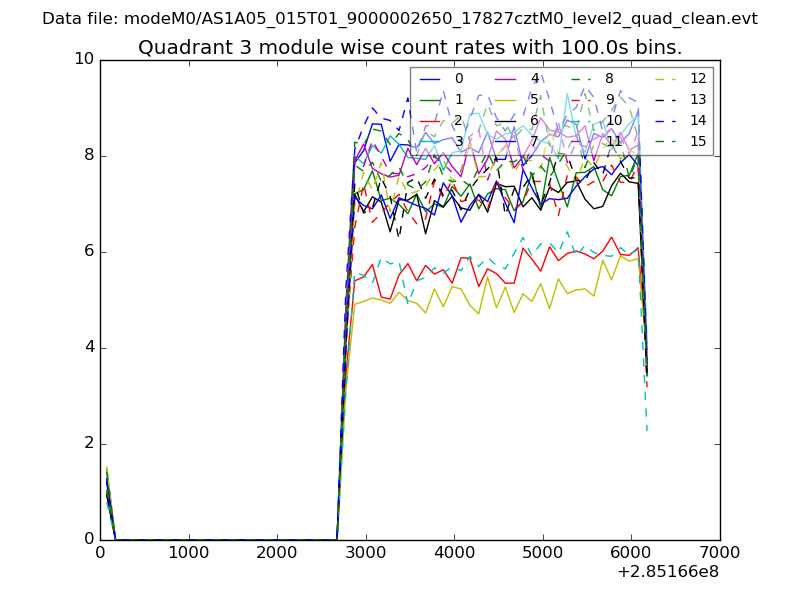 |
 |
| Parameter | Plot |
|---|---|
| CZT HV Monitor | 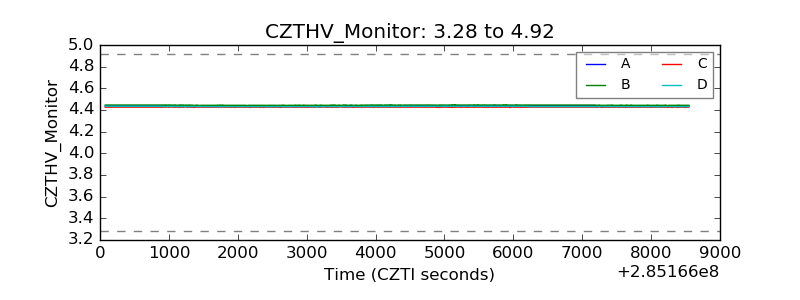 |
| D_VDD | 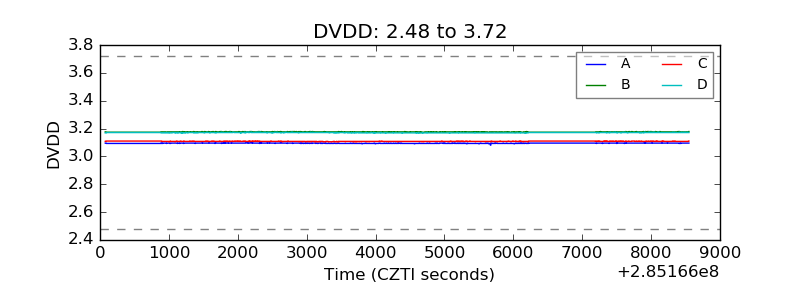 |
| Temperature 1 | 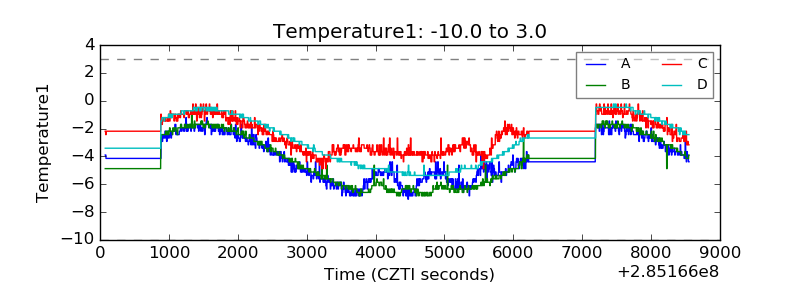 |
| Veto HV Monitor | 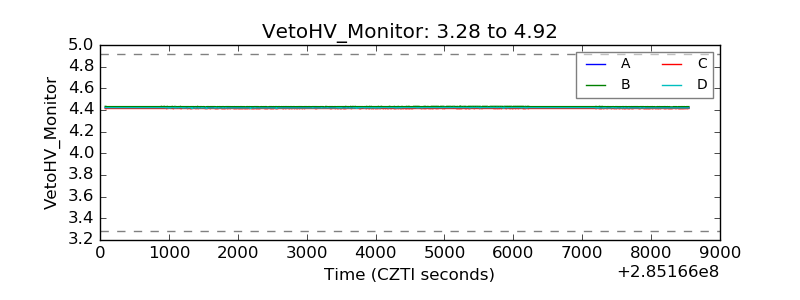 |
| Veto LLD | 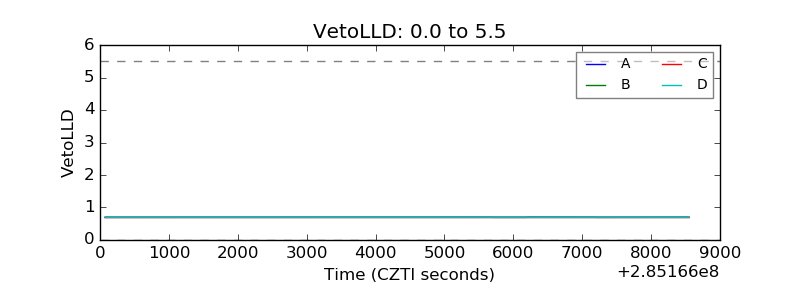 |
| Alpha Counter | 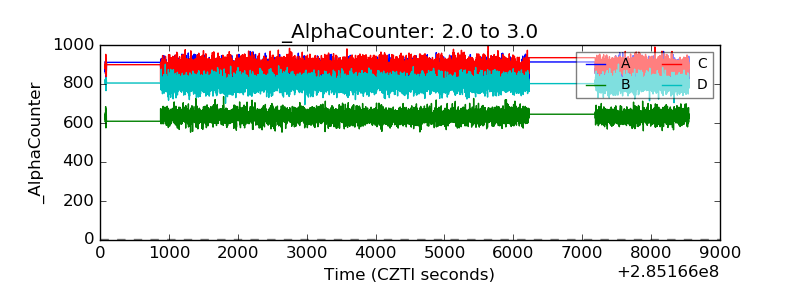 |
| _CPM_Rate | 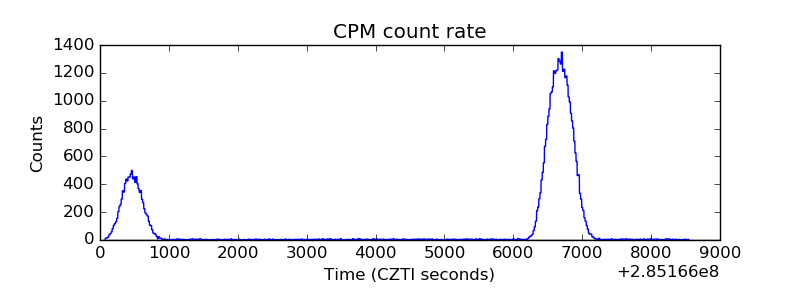 |
| CZT Counter |  |
| +2.5 Volts monitor |  |
| +5 Volts monitor |  |
| _ROLL_ROT | 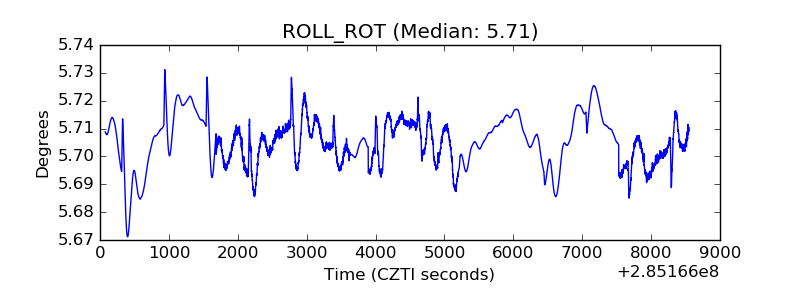 |
| _Roll_DEC | 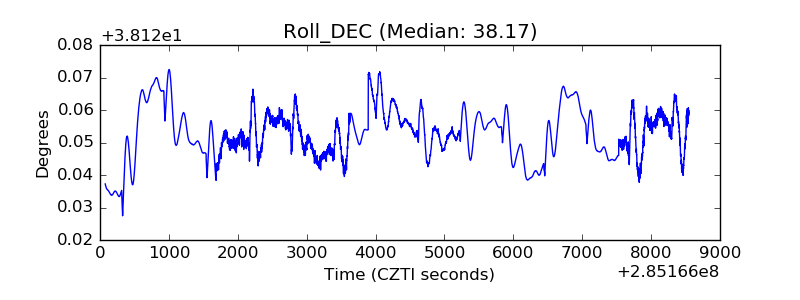 |
| _Roll_RA |  |
| Veto Counter | 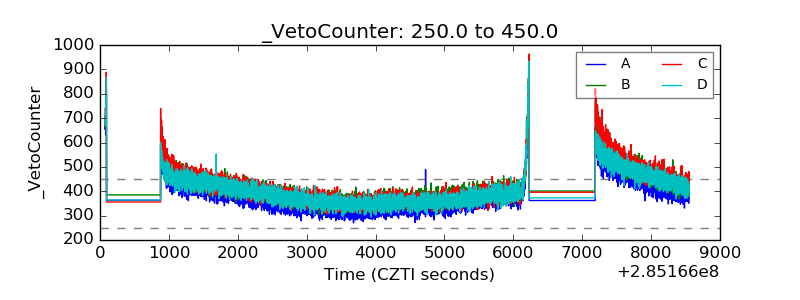 |