| Param | Original file | Final file |
|---|---|---|
| Filename | modeM0/AS1A05_015T01_9000002650_17829cztM0_level2.evt | modeM0/AS1A05_015T01_9000002650_17829cztM0_level2_quad_clean.evt |
| Size (bytes) | 469,163,520 | 79,133,760 |
| Size | 447.4 MB | 75.5 MB |
| Events in quadrant A | 3,107,170 | 492,575 |
| Events in quadrant B | 3,352,995 | 496,814 |
| Events in quadrant C | 3,197,766 | 482,986 |
| Events in quadrant D | 4,114,952 | 476,323 |
| Mode SS | |||
|---|---|---|---|
| Quadrant | BADHDUFLAG | Total packets | Discarded packets |
| A | 0 | 130 | 0 |
| B | 0 | 130 | 0 |
| C | 0 | 130 | 0 |
| D | 0 | 130 | 0 |
| Mode M9 | |||
|---|---|---|---|
| Quadrant | BADHDUFLAG | Total packets | Discarded packets |
| A | 0 | 17 | 0 |
| B | 0 | 18 | 0 |
| C | 0 | 18 | 0 |
| D | 0 | 18 | 0 |
| Mode M0 | |||
|---|---|---|---|
| Quadrant | BADHDUFLAG | Total packets | Discarded packets |
| A | 0 | 13550 | 2 |
| B | 0 | 14272 | 2 |
| C | 0 | 13743 | 2 |
| D | 0 | 16651 | 2 |
| Quadrant | Total seconds | Saturated seconds | Saturation percentage |
|---|---|---|---|
| A | 6415 | 23 | 0.358535% |
| B | 6415 | 51 | 0.795012% |
| C | 6415 | 44 | 0.685892% |
| D | 6415 | 352 | 5.487140% |
Noise dominated data is calculated using 1-second bins in cleaned event files. If a bin has >2000 counts, and if more than 50% of those come from <1% of pixels, then it is considered to be noise-dominated and hence unusable.
| Quadrant | # 1 sec bins | Bins with >0 counts | Bins with >2000 counts | High rate bins dominated by noise | Noise dominated (total time) | Noise dominated (detector-on time) | Marked lightcurve |
|---|---|---|---|---|---|---|---|
| A | 7555 | 6416 | 0 | 0 | 0.00% | 0.00% | 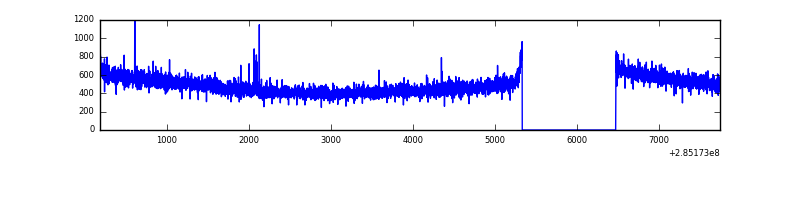 |
| B | 7555 | 6416 | 7 | 7 | 0.09% | 0.11% | 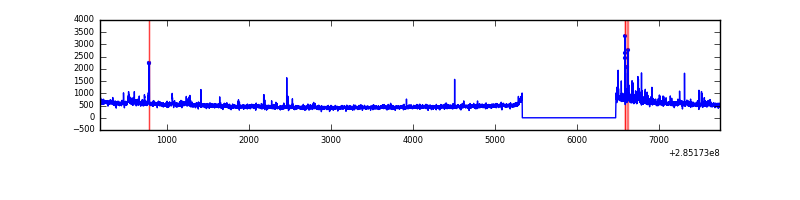 |
| C | 7555 | 6416 | 0 | 0 | 0.00% | 0.00% | 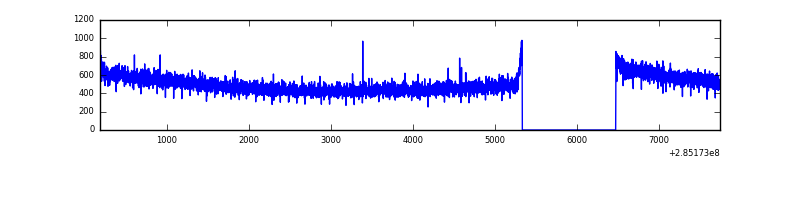 |
| D | 7555 | 6416 | 248 | 248 | 3.28% | 3.87% | 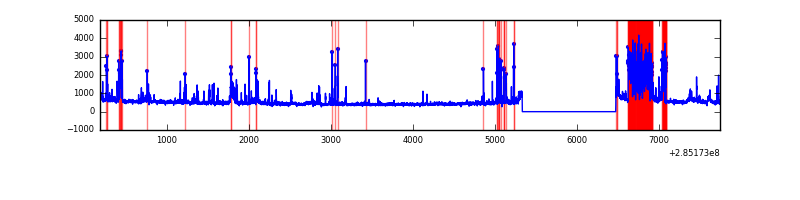 |
Top three noisy pixels from each quadrant. If the there are fewer than three noisy pixels in the level2.evt file, extra rows are filled as -1
| Pixel properties | Quadrant properties | ||||||
|---|---|---|---|---|---|---|---|
| Quadrant | DetID | PixID | Counts | Sigma | Mean | Median | Sigma |
| A | 6 | 16 | 10418 | 59.17 | 804 | 788 | 162.7 |
| A | 0 | 226 | 7086 | 38.7 | 804 | 788 | 162.7 |
| A | 12 | 194 | 6291 | 33.81 | 804 | 788 | 162.7 |
| B | 7 | 220 | 95895 | 626.03 | 805 | 787 | 151.9 |
| B | 4 | 216 | 31217 | 200.3 | 805 | 787 | 151.9 |
| B | 0 | 189 | 20003 | 126.49 | 805 | 787 | 151.9 |
| C | 14 | 238 | 119373 | 653.02 | 781 | 788 | 181.6 |
| C | 5 | 218 | 23062 | 122.66 | 781 | 788 | 181.6 |
| C | 1 | 16 | 9055 | 45.52 | 781 | 788 | 181.6 |
| D | 7 | 238 | 1042064 | 5618.71 | 765 | 747 | 185.3 |
| D | 10 | 70 | 118051 | 632.95 | 765 | 747 | 185.3 |
| D | 2 | 14 | 35656 | 188.36 | 765 | 747 | 185.3 |
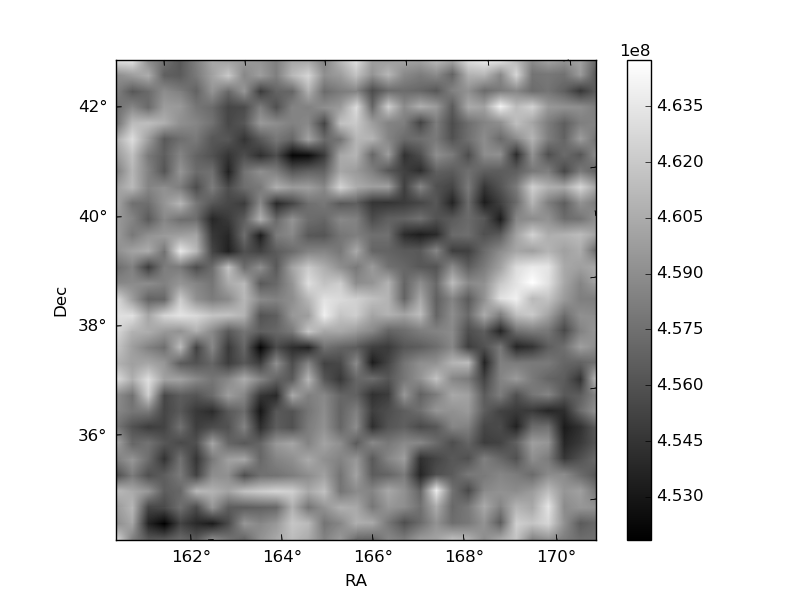
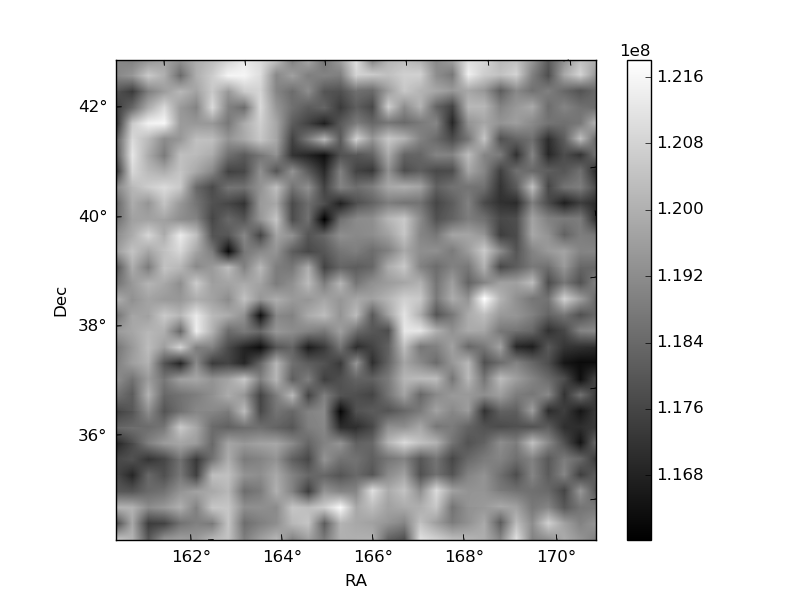
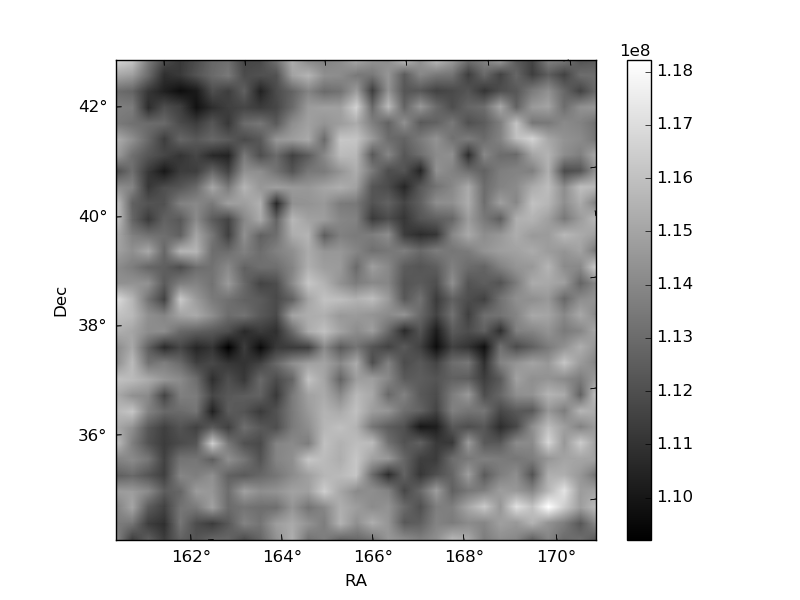
Histogram calculated using DETX and DETY for each event in the final _common_clean file
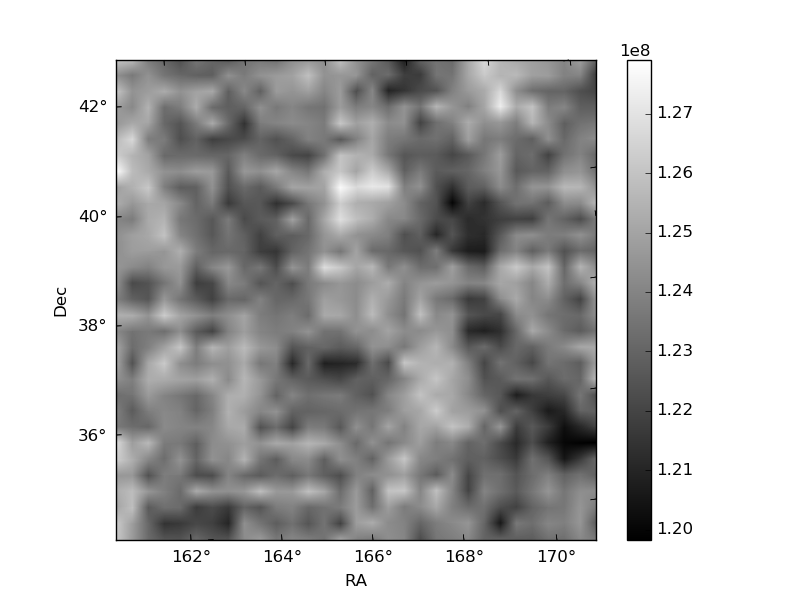
| Quadrant A | 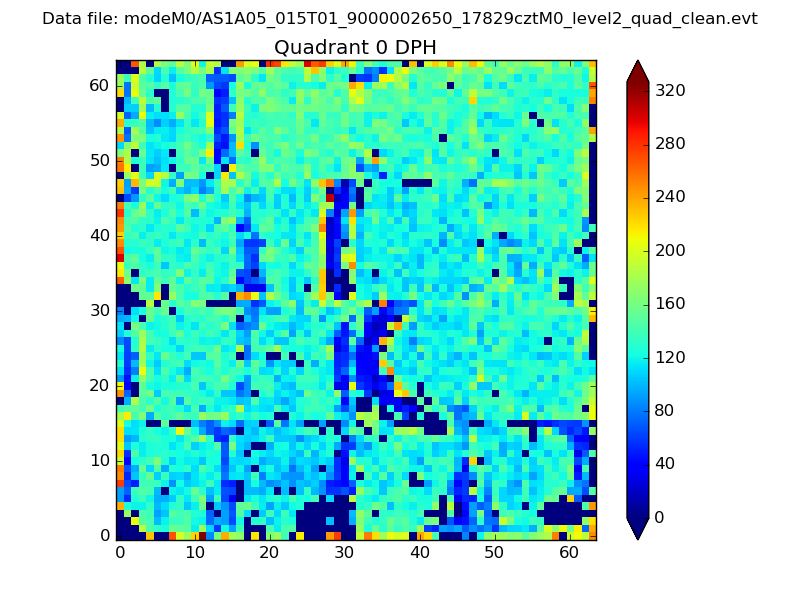 |
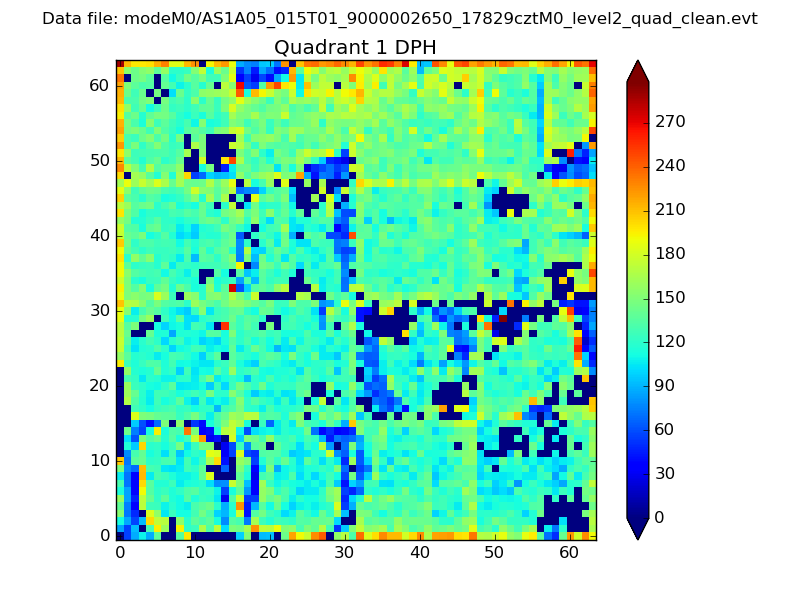 |
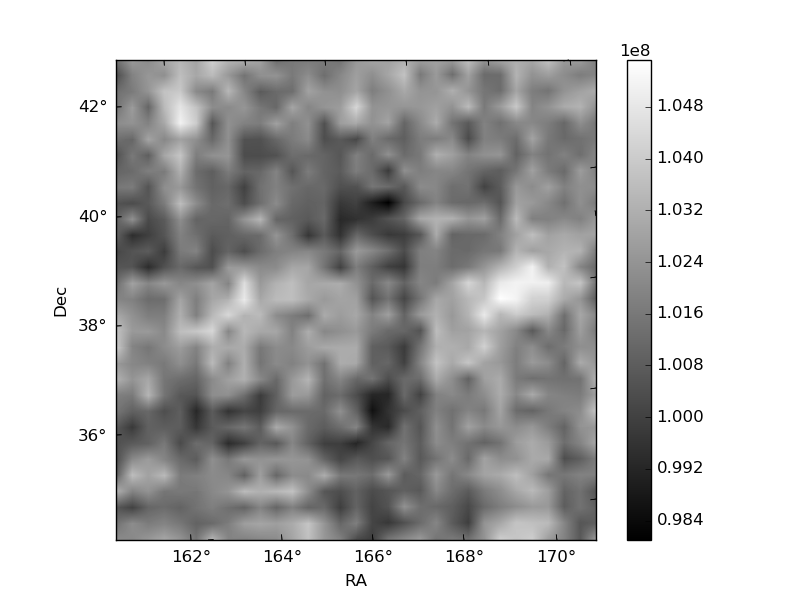
Quadrant B |
|---|---|---|---|
| Quadrant D | 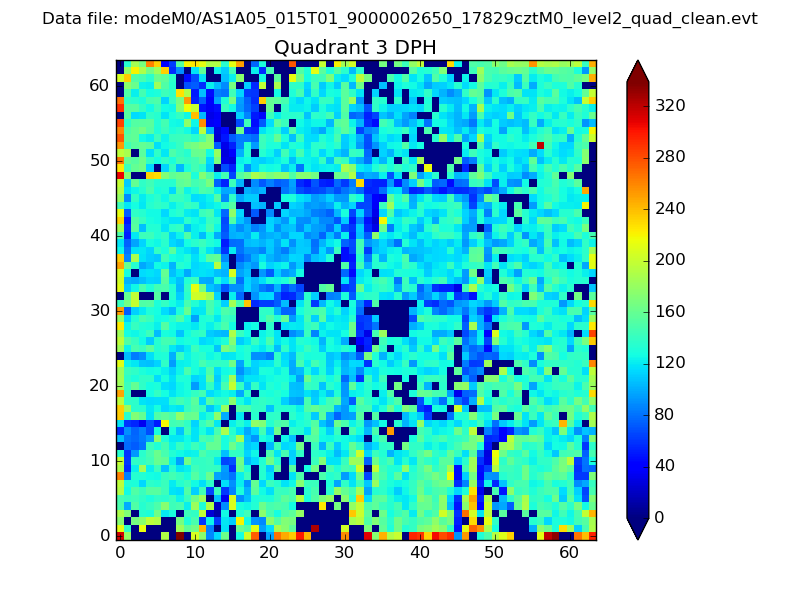 |
 |
Quadrant C |
| Plot type | Count rate plots | Images |
|---|---|---|
| Comparison with Poisson distribution Blue bars denote a histogram of data divided into 1 sec bins. Red curve is a Poisson curve with rate = median count rate of data. |
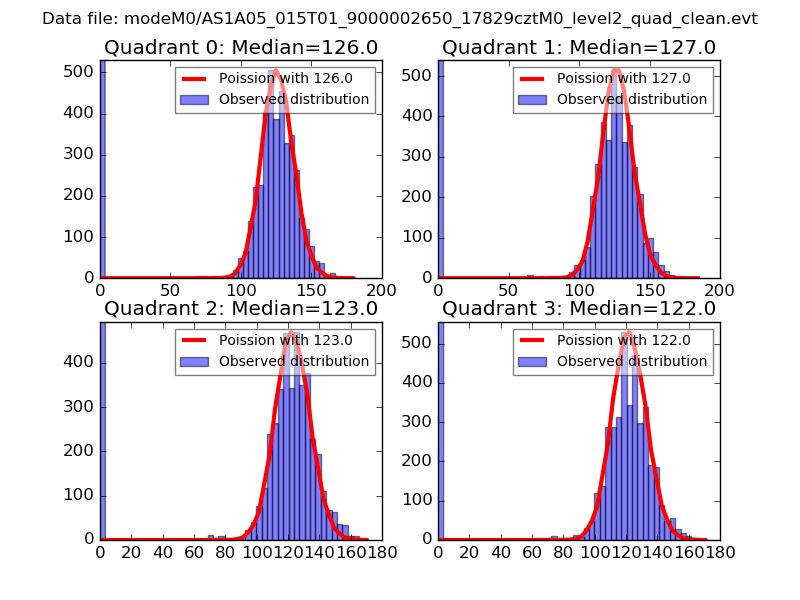 |
 |
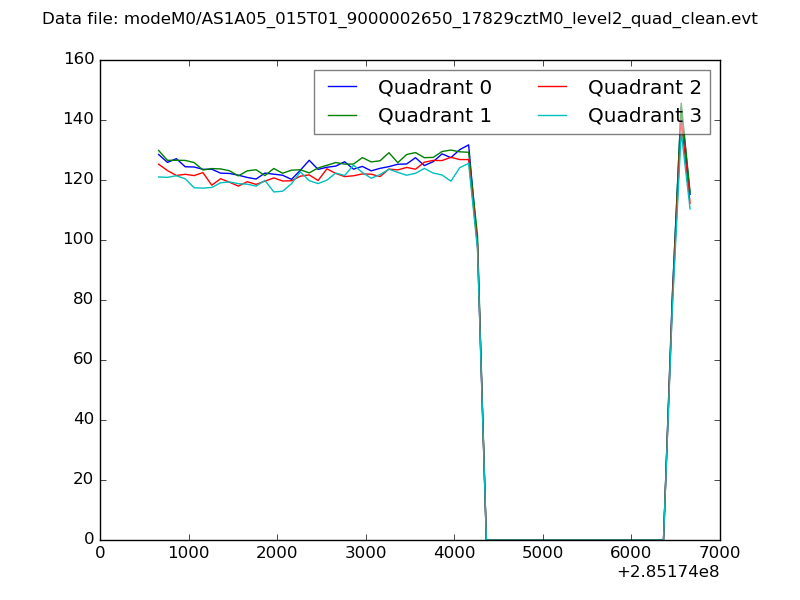
| Quadrant-wise count rates Data is divided into 100 sec bins |
 |
|
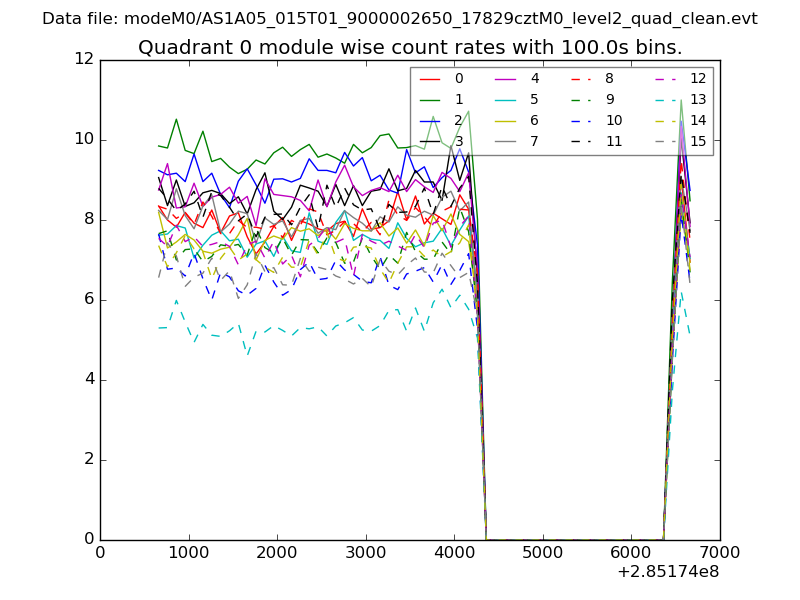
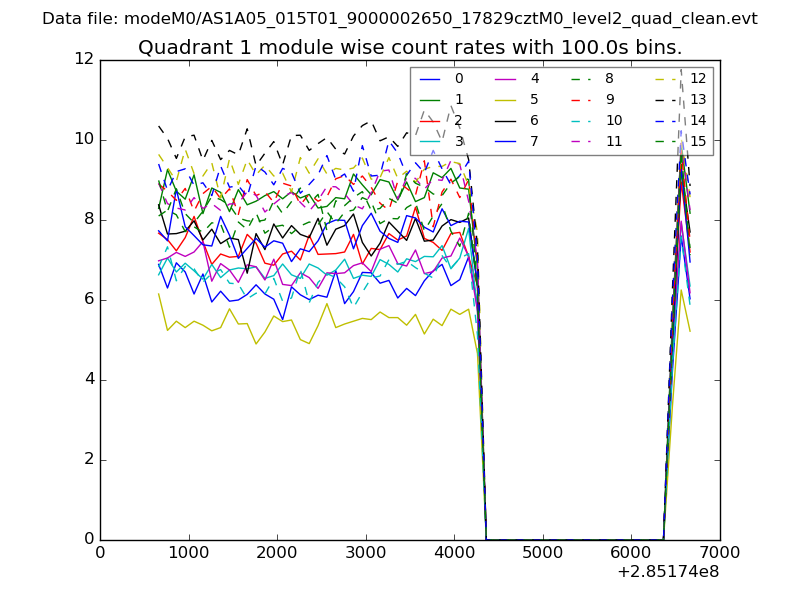
| Module-wise count rates for Quadrant A Data is divided into 100 sec bins |
 |
 |
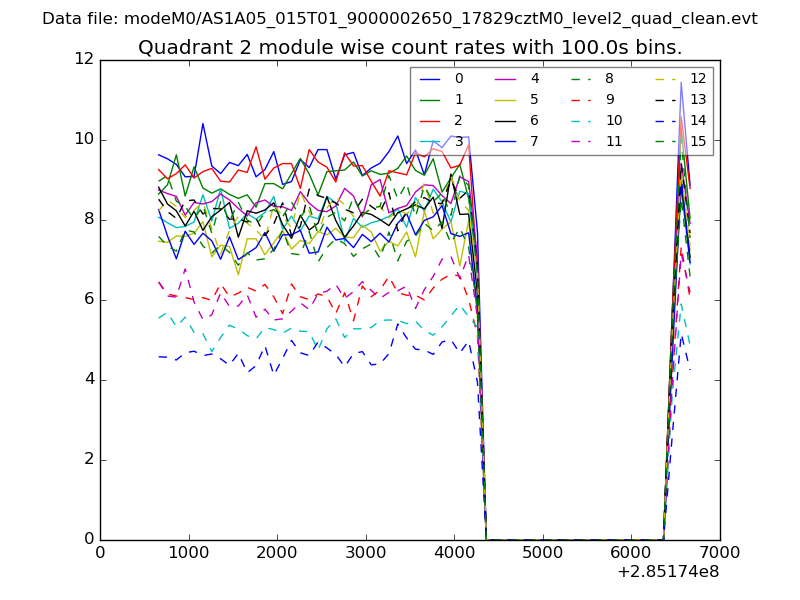
| Module-wise count rates for Quadrant B Data is divided into 100 sec bins |
 |
 |
| Module-wise count rates for Quadrant C Data is divided into 100 sec bins |
 |
 |
| Module-wise count rates for Quadrant D Data is divided into 100 sec bins |
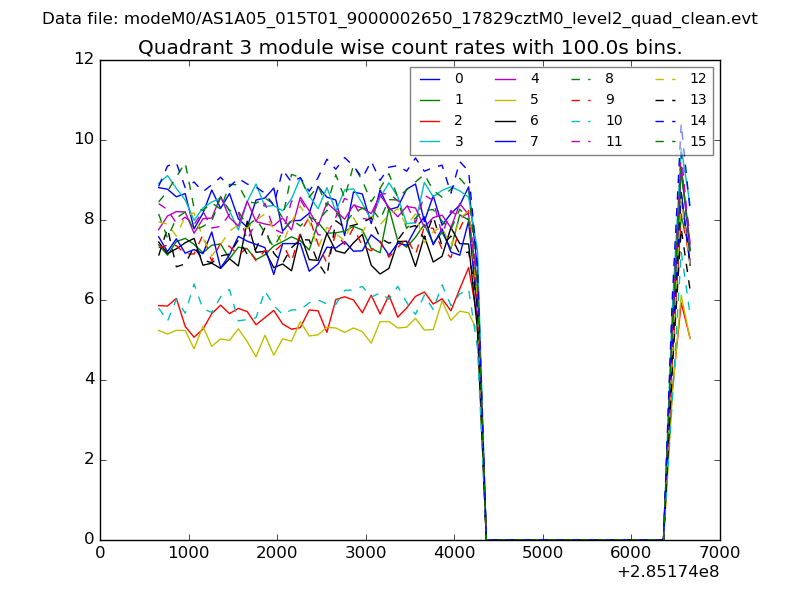 |
 |
| Parameter | Plot |
|---|---|
| CZT HV Monitor | 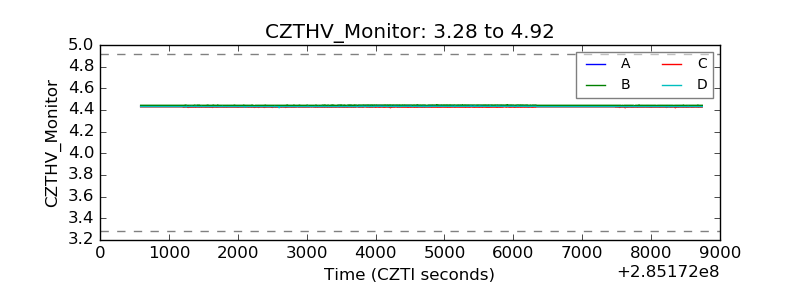 |
| D_VDD | 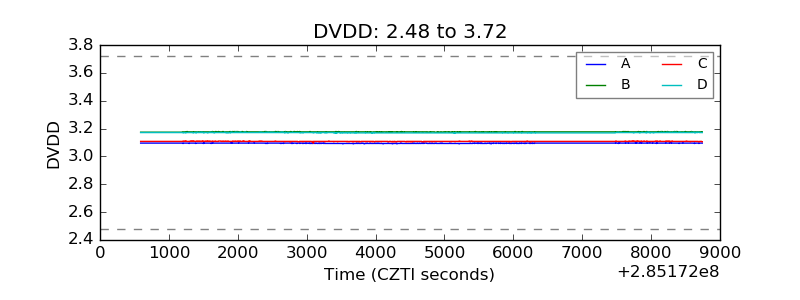 |
| Temperature 1 | 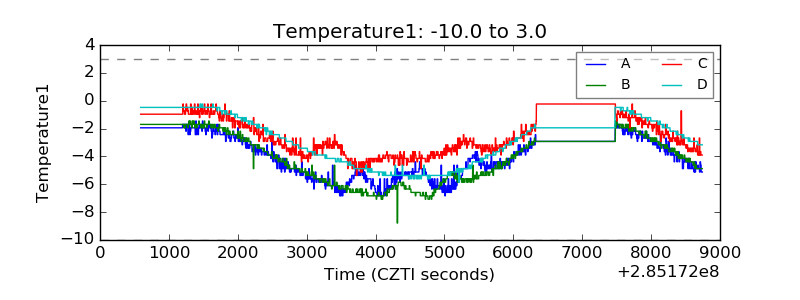 |
| Veto HV Monitor |  |
| Veto LLD | 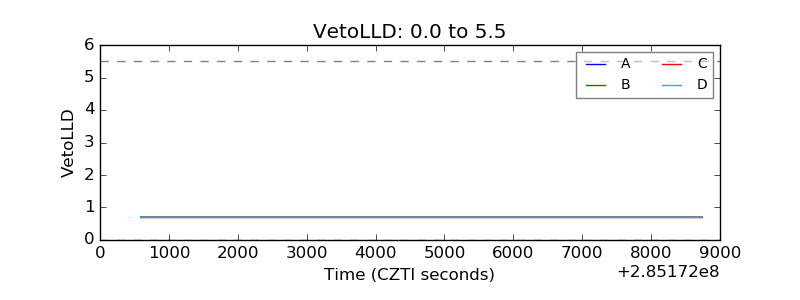 |
| Alpha Counter | 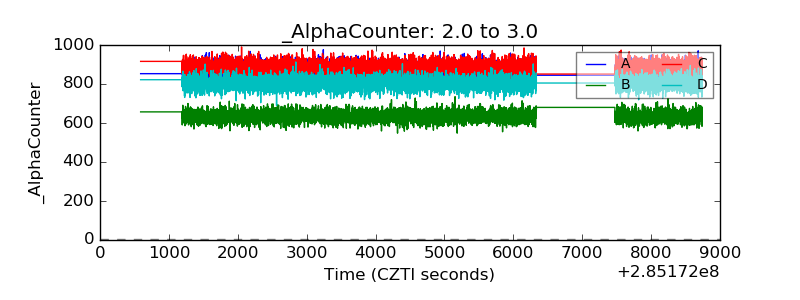 |
| _CPM_Rate | 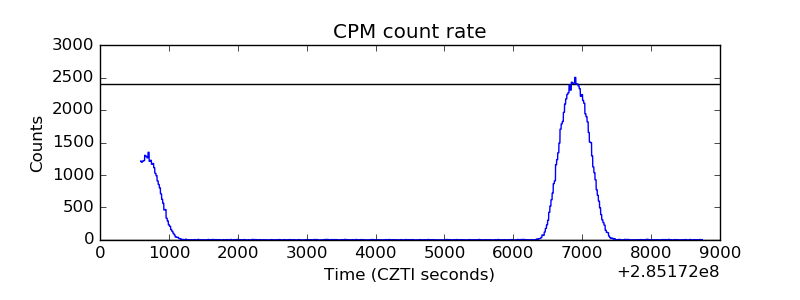 |
| CZT Counter |  |
| +2.5 Volts monitor |  |
| +5 Volts monitor |  |
| _ROLL_ROT | 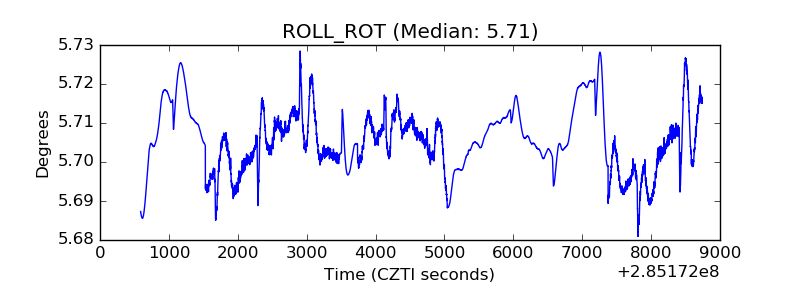 |
| _Roll_DEC | 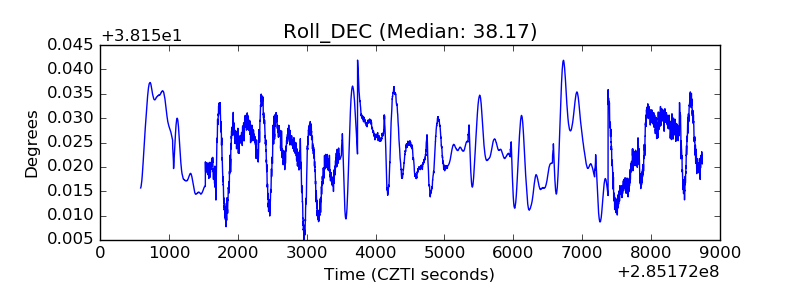 |
| _Roll_RA | 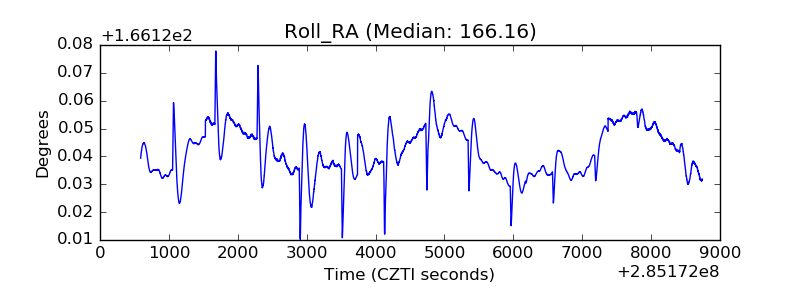 |
| Veto Counter | 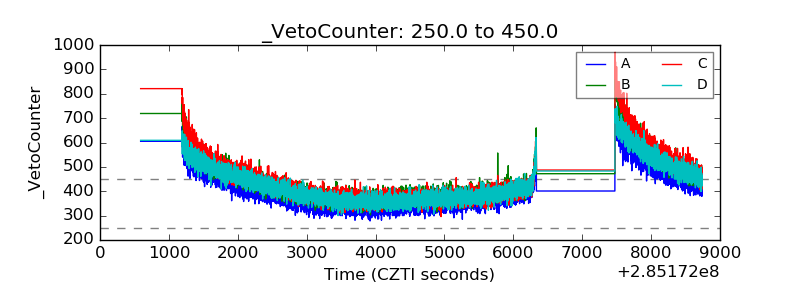 |