| Param | Original file | Final file |
|---|---|---|
| Filename | modeM0/AS1A05_015T01_9000002650_17830cztM0_level2.evt | modeM0/AS1A05_015T01_9000002650_17830cztM0_level2_quad_clean.evt |
| Size (bytes) | 490,299,840 | 94,524,480 |
| Size | 467.6 MB | 90.1 MB |
| Events in quadrant A | 3,231,284 | 607,275 |
| Events in quadrant B | 3,617,498 | 616,407 |
| Events in quadrant C | 3,355,945 | 598,755 |
| Events in quadrant D | 4,203,868 | 587,977 |
| Mode SS | |||
|---|---|---|---|
| Quadrant | BADHDUFLAG | Total packets | Discarded packets |
| A | 0 | 132 | 0 |
| B | 0 | 132 | 0 |
| C | 0 | 132 | 0 |
| D | 0 | 132 | 0 |
| Mode M9 | |||
|---|---|---|---|
| Quadrant | BADHDUFLAG | Total packets | Discarded packets |
| A | 0 | 24 | 0 |
| B | 0 | 24 | 0 |
| C | 0 | 24 | 0 |
| D | 0 | 24 | 0 |
| Mode M0 | |||
|---|---|---|---|
| Quadrant | BADHDUFLAG | Total packets | Discarded packets |
| A | 0 | 13979 | 2 |
| B | 0 | 15110 | 2 |
| C | 0 | 14301 | 2 |
| D | 0 | 17045 | 2 |
| Quadrant | Total seconds | Saturated seconds | Saturation percentage |
|---|---|---|---|
| A | 6489 | 38 | 0.585606% |
| B | 6490 | 89 | 1.371341% |
| C | 6489 | 72 | 1.109570% |
| D | 6489 | 345 | 5.316690% |
Noise dominated data is calculated using 1-second bins in cleaned event files. If a bin has >2000 counts, and if more than 50% of those come from <1% of pixels, then it is considered to be noise-dominated and hence unusable.
| Quadrant | # 1 sec bins | Bins with >0 counts | Bins with >2000 counts | High rate bins dominated by noise | Noise dominated (total time) | Noise dominated (detector-on time) | Marked lightcurve |
|---|---|---|---|---|---|---|---|
| A | 8874 | 6491 | 0 | 0 | 0.00% | 0.00% | 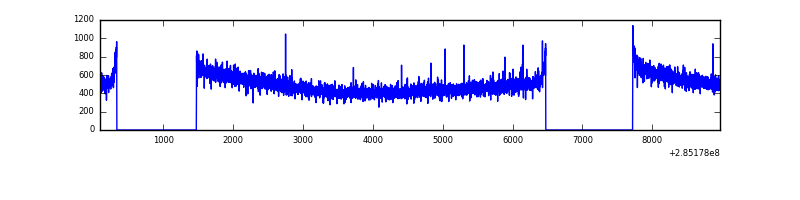 |
| B | 8875 | 6492 | 20 | 20 | 0.23% | 0.31% | 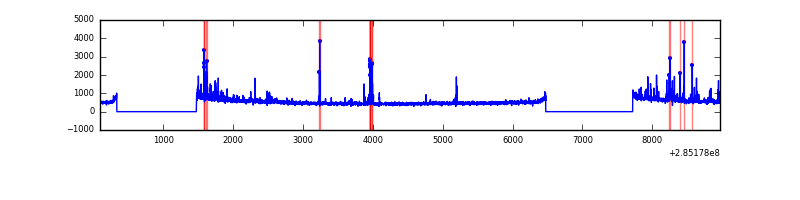 |
| C | 8874 | 6491 | 0 | 0 | 0.00% | 0.00% | 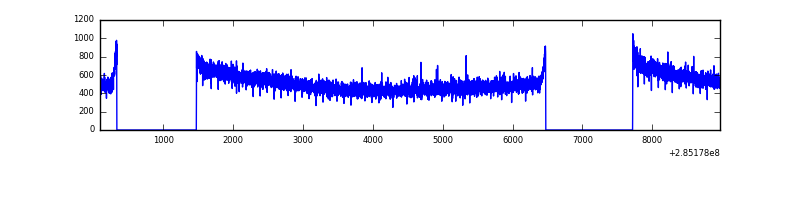 |
| D | 8874 | 6491 | 270 | 270 | 3.04% | 4.16% | 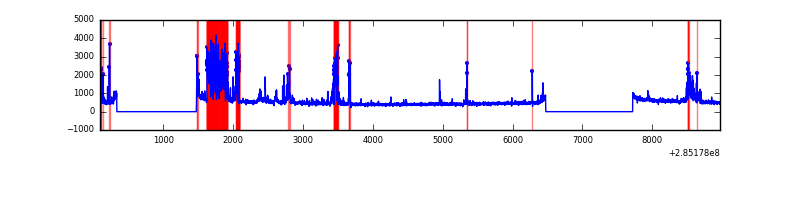 |
Top three noisy pixels from each quadrant. If the there are fewer than three noisy pixels in the level2.evt file, extra rows are filled as -1
| Pixel properties | Quadrant properties | ||||||
|---|---|---|---|---|---|---|---|
| Quadrant | DetID | PixID | Counts | Sigma | Mean | Median | Sigma |
| A | 0 | 226 | 7444 | 39.62 | 839 | 826 | 167.0 |
| A | 3 | 137 | 6070 | 31.39 | 839 | 826 | 167.0 |
| A | 12 | 194 | 6012 | 31.05 | 839 | 826 | 167.0 |
| B | 10 | 245 | 123234 | 773.96 | 843 | 823 | 158.2 |
| B | 7 | 220 | 93378 | 585.19 | 843 | 823 | 158.2 |
| B | 0 | 189 | 30131 | 185.3 | 843 | 823 | 158.2 |
| C | 14 | 238 | 126953 | 665.8 | 821 | 827 | 189.4 |
| C | 5 | 218 | 18210 | 91.76 | 821 | 827 | 189.4 |
| C | 13 | 61 | 5810 | 26.3 | 821 | 827 | 189.4 |
| D | 7 | 238 | 1048452 | 5066.14 | 800 | 779 | 206.8 |
| D | 10 | 70 | 39036 | 185.0 | 800 | 779 | 206.8 |
| D | 2 | 33 | 33159 | 156.58 | 800 | 779 | 206.8 |
Histogram calculated using DETX and DETY for each event in the final _common_clean file
| Quadrant A | 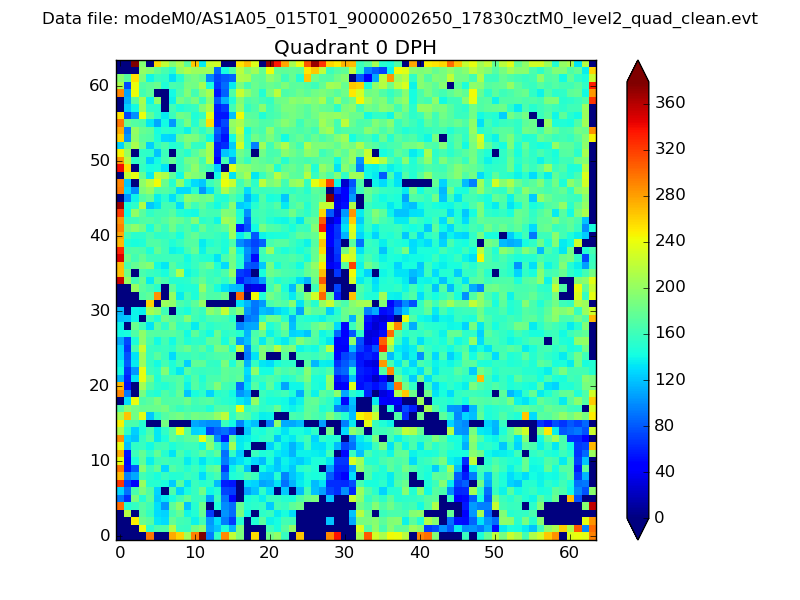 |
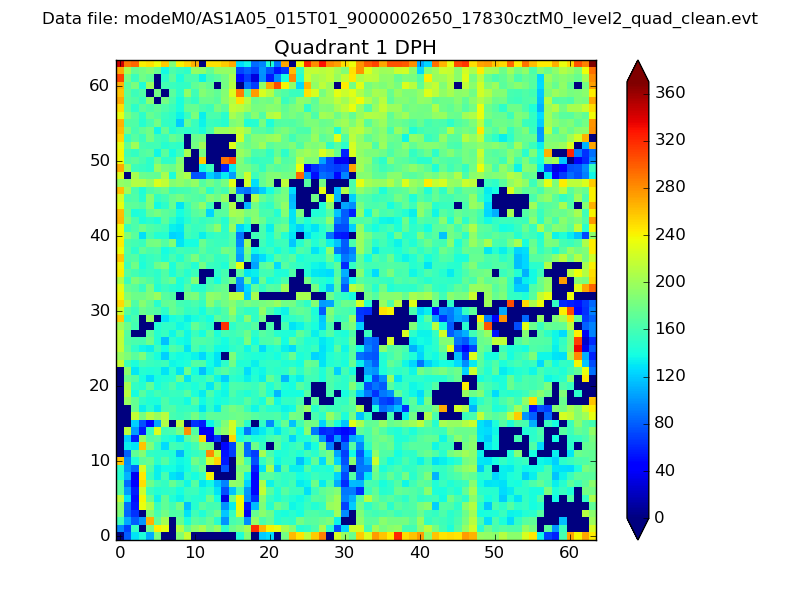 |
Quadrant B |
|---|---|---|---|
| Quadrant D | 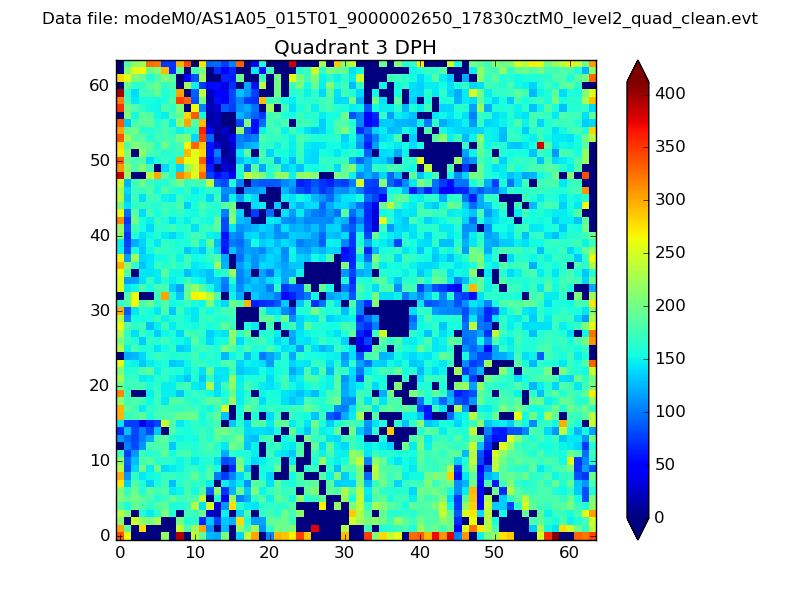 |
 |
Quadrant C |
| Plot type | Count rate plots | Images |
|---|---|---|
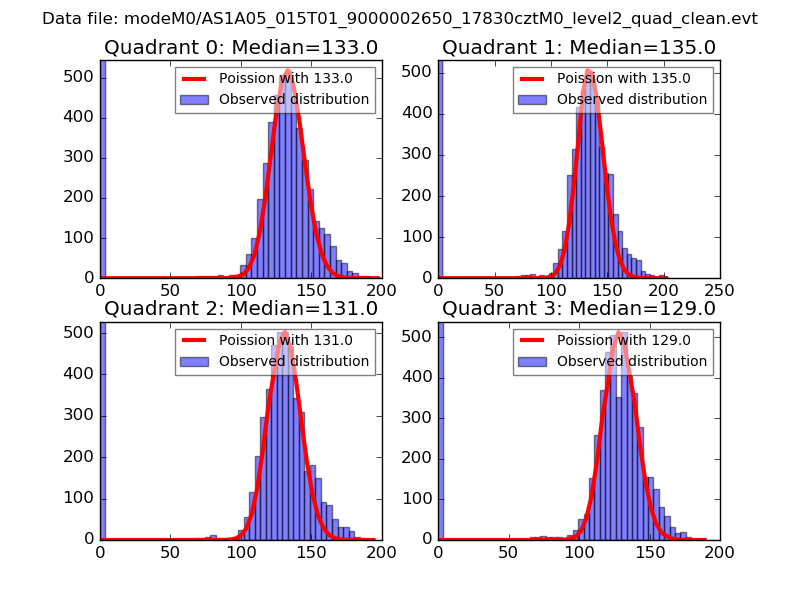
| Comparison with Poisson distribution Blue bars denote a histogram of data divided into 1 sec bins. Red curve is a Poisson curve with rate = median count rate of data. |
 |
 |
| Quadrant-wise count rates Data is divided into 100 sec bins |
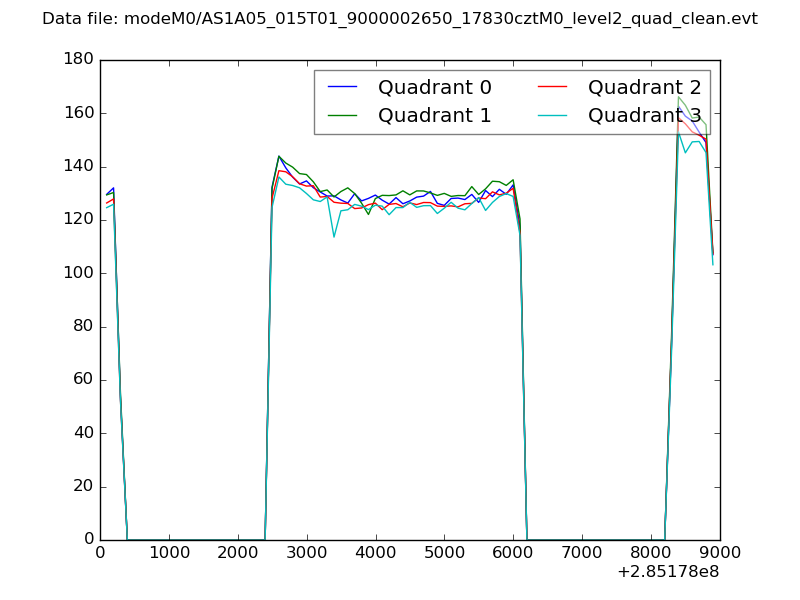 |
|
| Module-wise count rates for Quadrant A Data is divided into 100 sec bins |
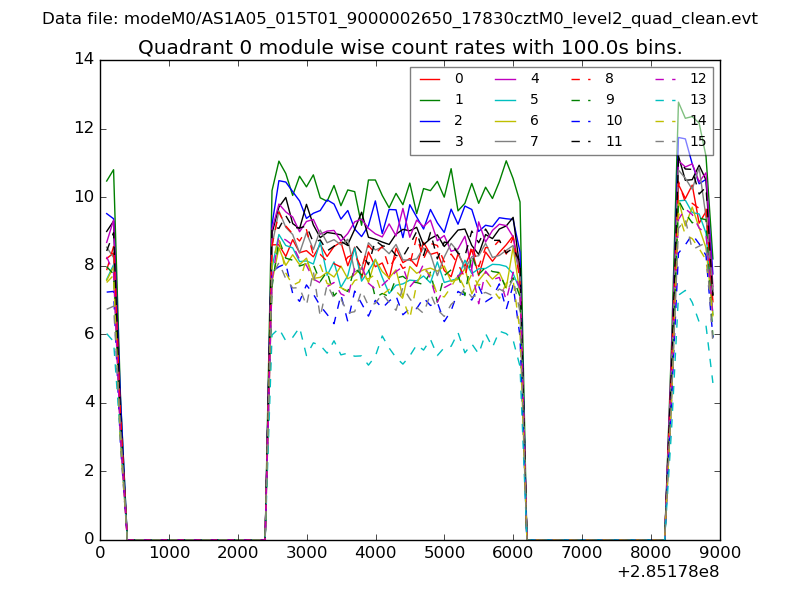 |
 |
| Module-wise count rates for Quadrant B Data is divided into 100 sec bins |
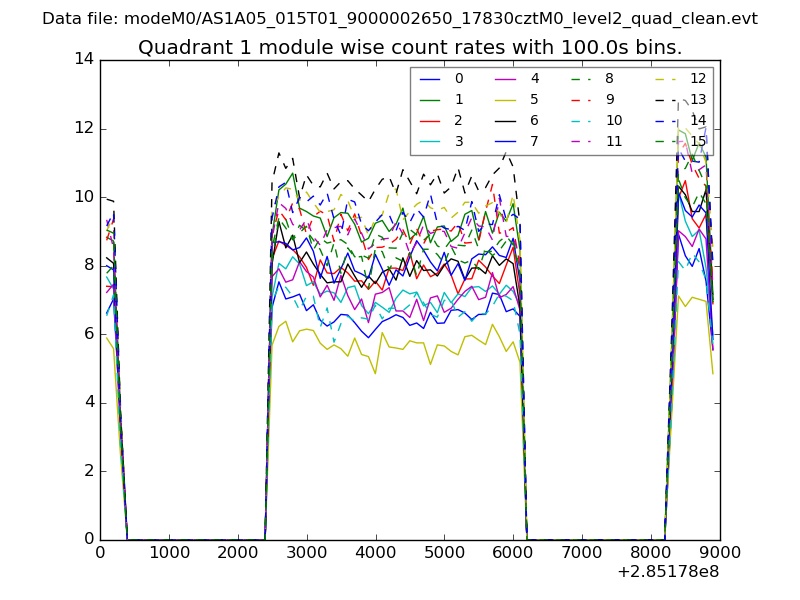 |
 |
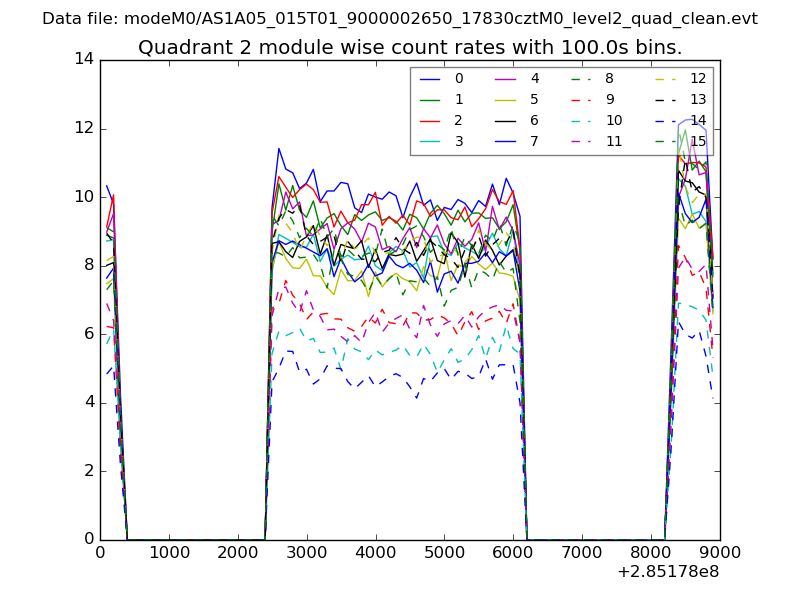
| Module-wise count rates for Quadrant C Data is divided into 100 sec bins |
 |
 |
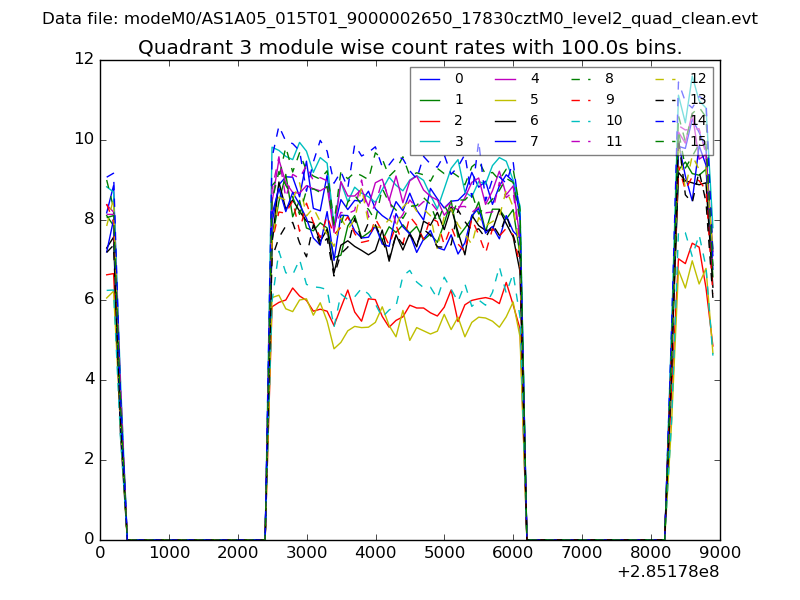
| Module-wise count rates for Quadrant D Data is divided into 100 sec bins |
 |
 |
| Parameter | Plot |
|---|---|
| CZT HV Monitor | 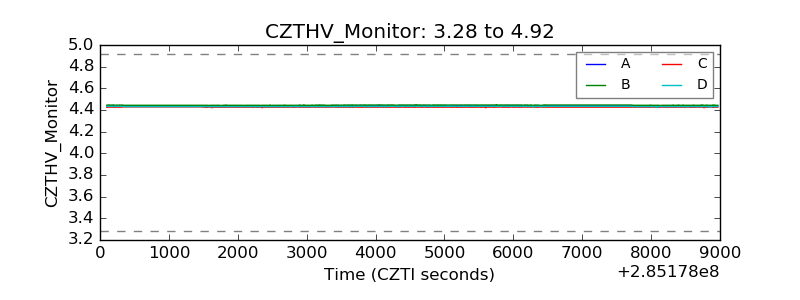 |
| D_VDD | 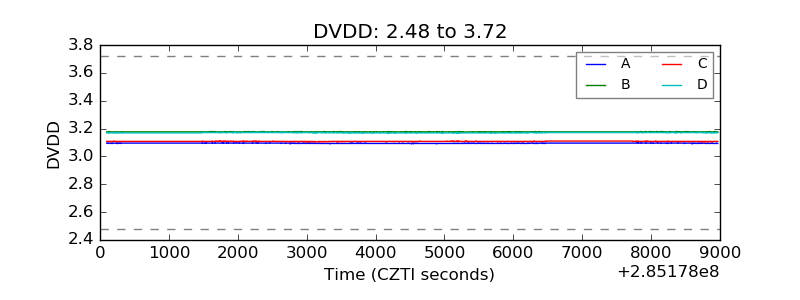 |
| Temperature 1 | 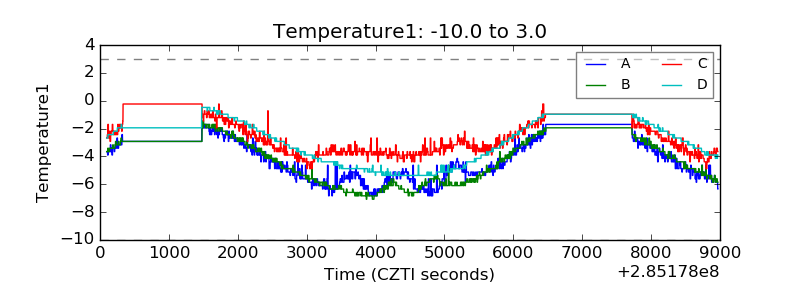 |
| Veto HV Monitor | 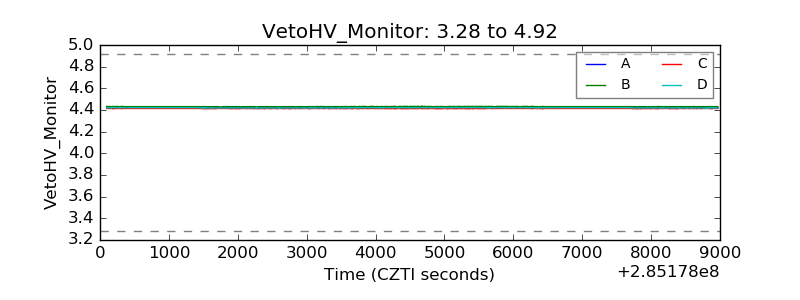 |
| Veto LLD | 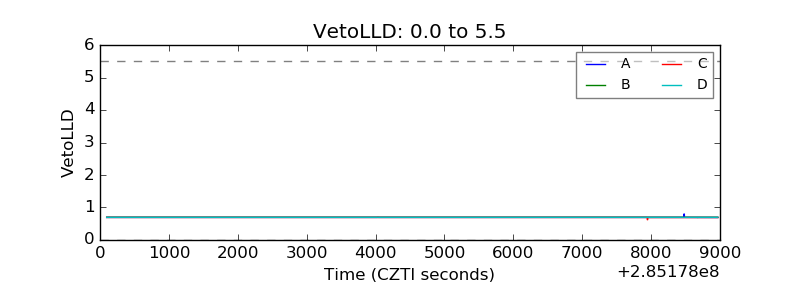 |
| Alpha Counter | 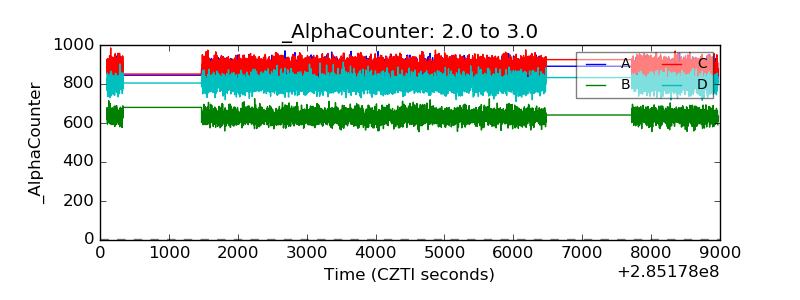 |
| _CPM_Rate | 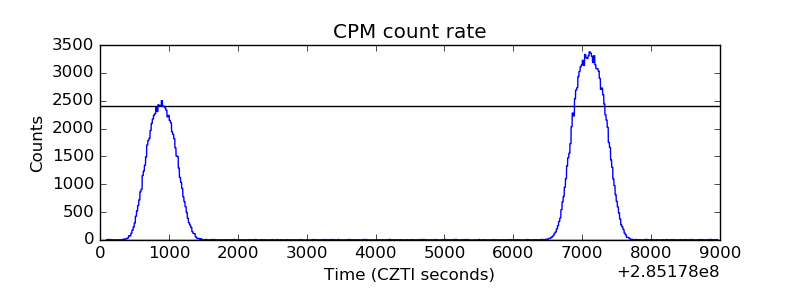 |
| CZT Counter |  |
| +2.5 Volts monitor |  |
| +5 Volts monitor |  |
| _ROLL_ROT |  |
| _Roll_DEC | 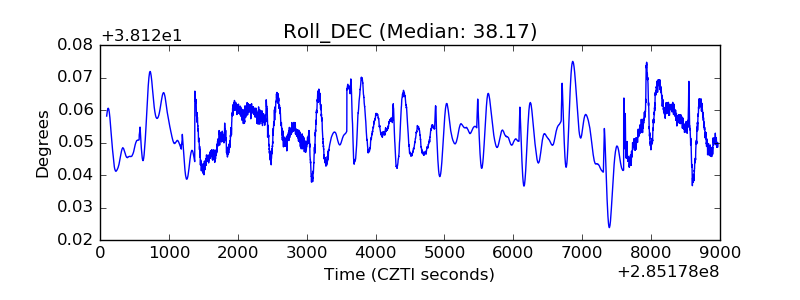 |
| _Roll_RA |  |
| Veto Counter | 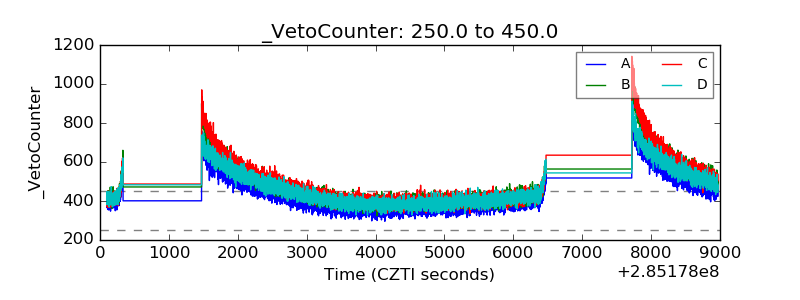 |