| Param | Original file | Final file |
|---|---|---|
| Filename | modeM0/AS1A05_015T01_9000002650_17831cztM0_level2.evt | modeM0/AS1A05_015T01_9000002650_17831cztM0_level2_quad_clean.evt |
| Size (bytes) | 195,940,800 | 43,807,680 |
| Size | 186.9 MB | 41.8 MB |
| Events in quadrant A | 1,319,939 | 285,382 |
| Events in quadrant B | 1,538,545 | 293,294 |
| Events in quadrant C | 1,406,621 | 283,170 |
| Events in quadrant D | 1,488,242 | 275,977 |
| Mode SS | |||
|---|---|---|---|
| Quadrant | BADHDUFLAG | Total packets | Discarded packets |
| A | 0 | 52 | 0 |
| B | 0 | 52 | 0 |
| C | 0 | 52 | 0 |
| D | 0 | 52 | 0 |
| Mode M9 | |||
|---|---|---|---|
| Quadrant | BADHDUFLAG | Total packets | Discarded packets |
| A | 0 | 2 | 0 |
| B | 0 | 2 | 0 |
| C | 0 | 2 | 0 |
| D | 0 | 3 | 0 |
| Mode M0 | |||
|---|---|---|---|
| Quadrant | BADHDUFLAG | Total packets | Discarded packets |
| A | 0 | 5730 | 1 |
| B | 0 | 6369 | 1 |
| C | 0 | 5927 | 1 |
| D | 0 | 6277 | 1 |
| Quadrant | Total seconds | Saturated seconds | Saturation percentage |
|---|---|---|---|
| A | 2632 | 15 | 0.569909% |
| B | 2632 | 33 | 1.253799% |
| C | 2632 | 32 | 1.215805% |
| D | 2632 | 28 | 1.063830% |
Noise dominated data is calculated using 1-second bins in cleaned event files. If a bin has >2000 counts, and if more than 50% of those come from <1% of pixels, then it is considered to be noise-dominated and hence unusable.
| Quadrant | # 1 sec bins | Bins with >0 counts | Bins with >2000 counts | High rate bins dominated by noise | Noise dominated (total time) | Noise dominated (detector-on time) | Marked lightcurve |
|---|---|---|---|---|---|---|---|
| A | 2632 | 2632 | 0 | 0 | 0.00% | 0.00% | 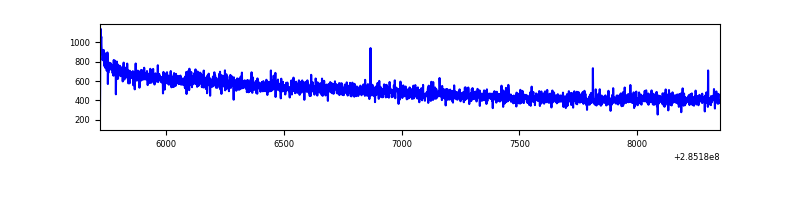 |
| B | 2632 | 2632 | 6 | 6 | 0.23% | 0.23% | 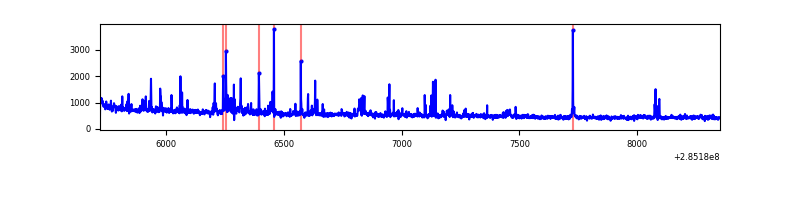 |
| C | 2632 | 2632 | 0 | 0 | 0.00% | 0.00% | 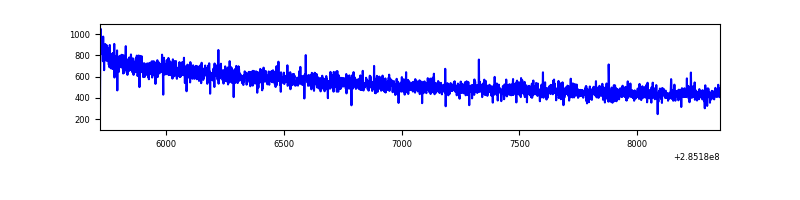 |
| D | 2632 | 2632 | 20 | 20 | 0.76% | 0.76% | 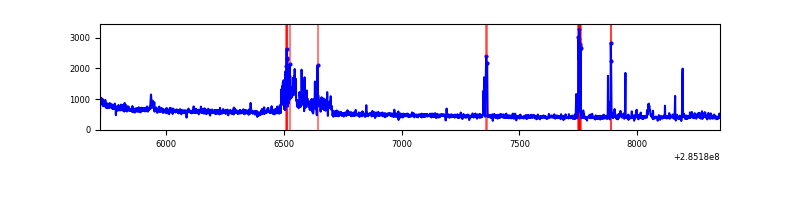 |
Top three noisy pixels from each quadrant. If the there are fewer than three noisy pixels in the level2.evt file, extra rows are filled as -1
| Pixel properties | Quadrant properties | ||||||
|---|---|---|---|---|---|---|---|
| Quadrant | DetID | PixID | Counts | Sigma | Mean | Median | Sigma |
| A | 0 | 226 | 2954 | 37.83 | 342 | 336 | 69.2 |
| A | 12 | 194 | 2471 | 30.85 | 342 | 336 | 69.2 |
| A | 3 | 137 | 2412 | 30.0 | 342 | 336 | 69.2 |
| B | 10 | 245 | 94143 | 1416.82 | 349 | 341 | 66.2 |
| B | 0 | 189 | 16854 | 249.42 | 349 | 341 | 66.2 |
| B | 15 | 222 | 15210 | 224.59 | 349 | 341 | 66.2 |
| C | 14 | 238 | 54227 | 673.69 | 341 | 345 | 80.0 |
| C | 5 | 218 | 10826 | 131.04 | 341 | 345 | 80.0 |
| C | 5 | 33 | 6692 | 79.36 | 341 | 345 | 80.0 |
| D | 7 | 238 | 147885 | 1629.93 | 335 | 329 | 90.5 |
| D | 10 | 70 | 38052 | 416.69 | 335 | 329 | 90.5 |
| D | 1 | 52 | 13813 | 148.95 | 335 | 329 | 90.5 |
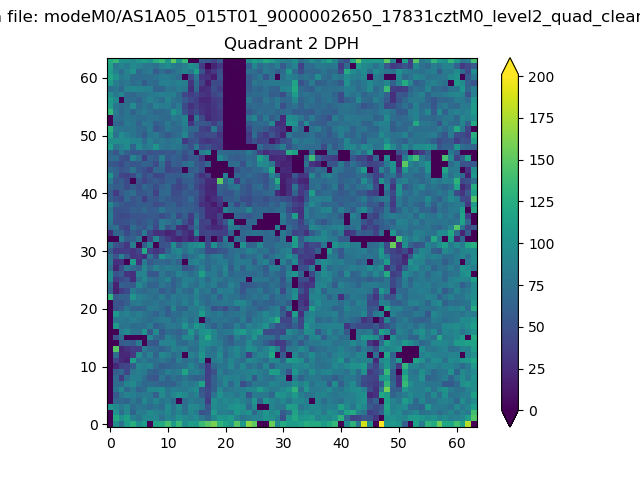
Histogram calculated using DETX and DETY for each event in the final _common_clean file
| Quadrant A | 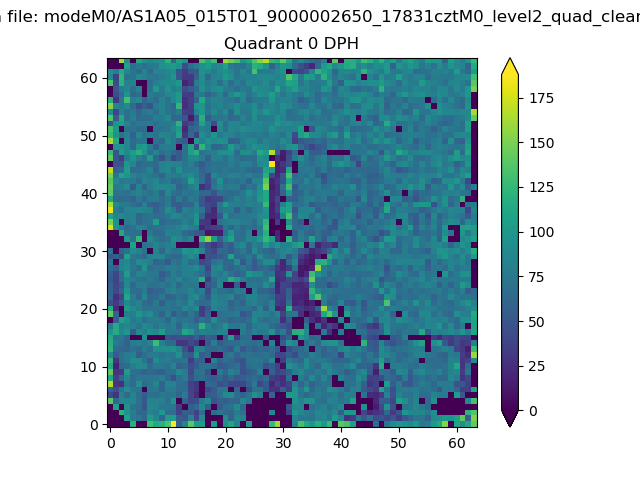 |
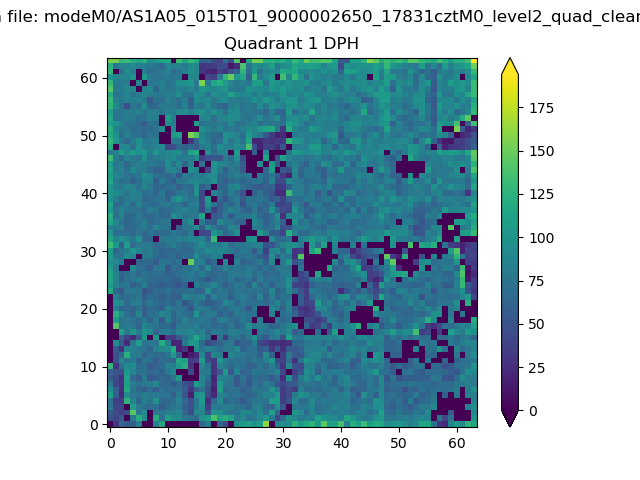 |
Quadrant B |
|---|---|---|---|
| Quadrant D | 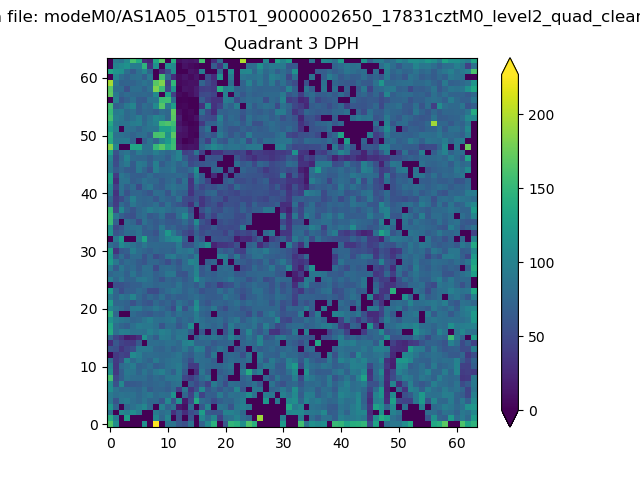 |
 |
Quadrant C |
| Plot type | Count rate plots | Images |
|---|---|---|
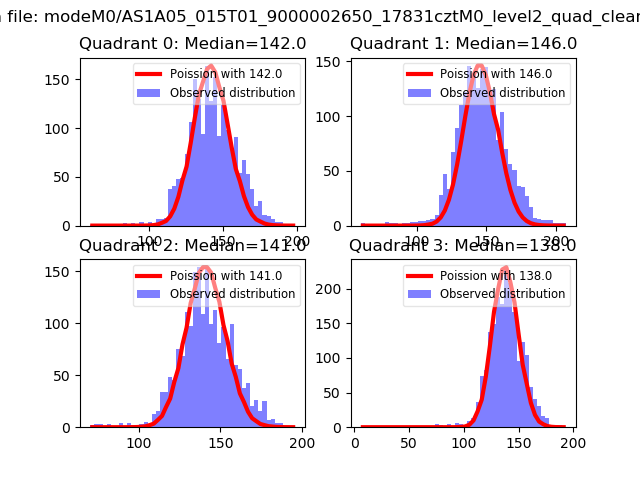
| Comparison with Poisson distribution Blue bars denote a histogram of data divided into 1 sec bins. Red curve is a Poisson curve with rate = median count rate of data. |
 |
 |
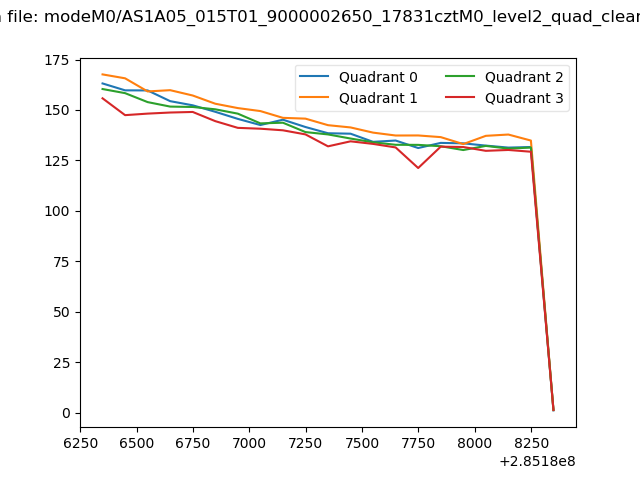
| Quadrant-wise count rates Data is divided into 100 sec bins |
 |
|
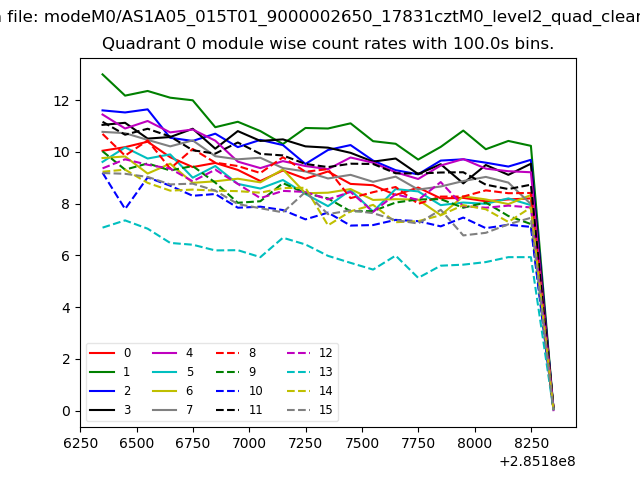
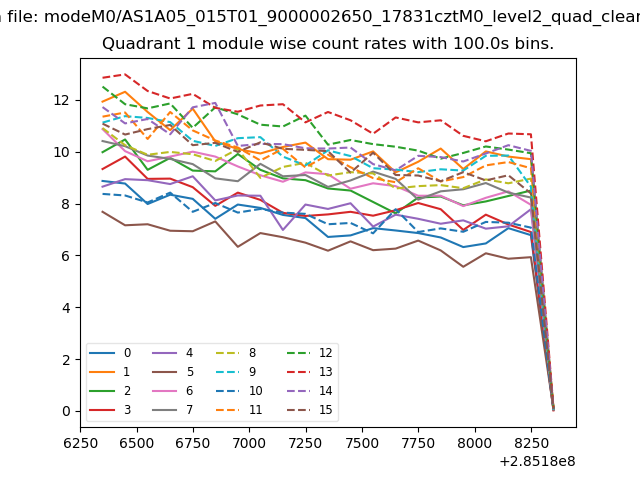
| Module-wise count rates for Quadrant A Data is divided into 100 sec bins |
 |
 |
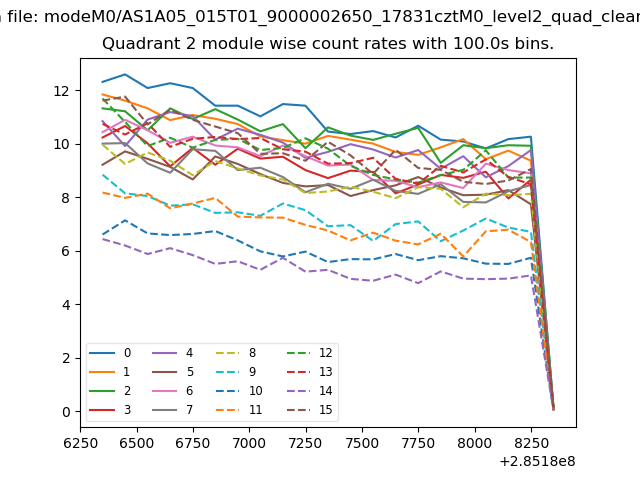
| Module-wise count rates for Quadrant B Data is divided into 100 sec bins |
 |
 |
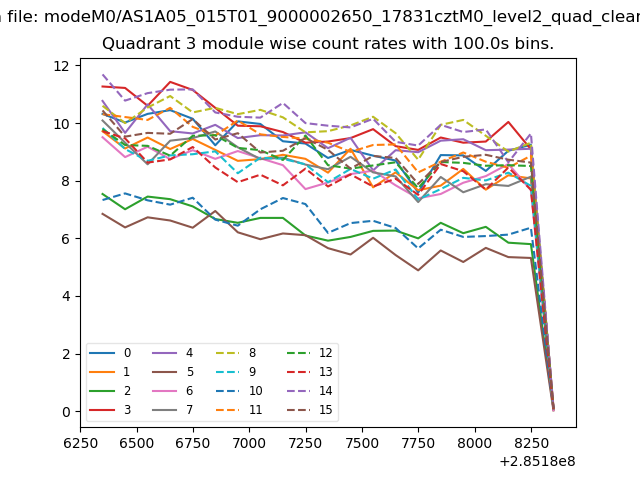
| Module-wise count rates for Quadrant C Data is divided into 100 sec bins |
 |
 |
| Module-wise count rates for Quadrant D Data is divided into 100 sec bins |
 |
 |
| Parameter | Plot |
|---|---|
| CZT HV Monitor | 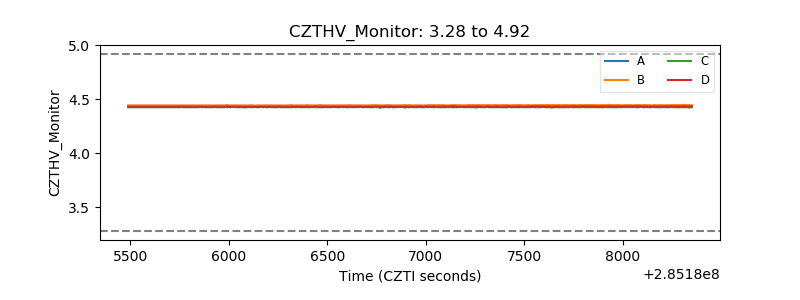 |
| D_VDD |  |
| Temperature 1 | 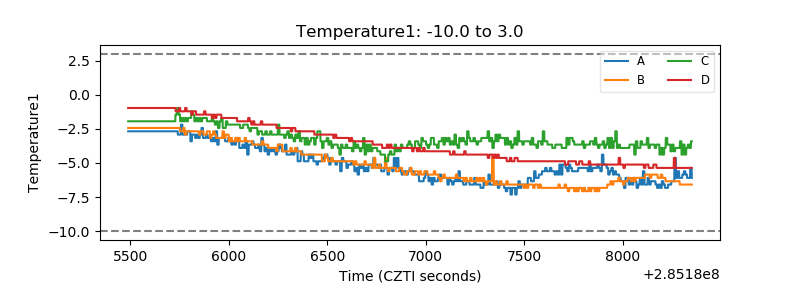 |
| Veto HV Monitor | 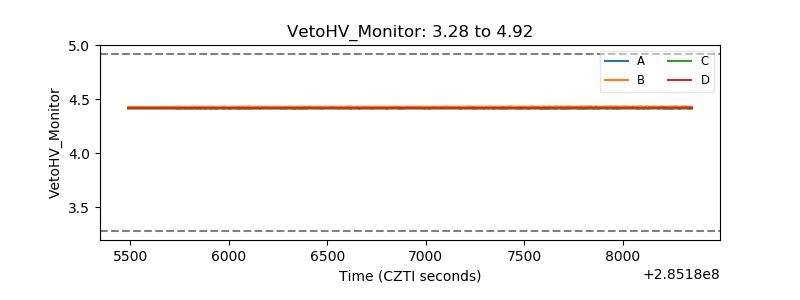 |
| Veto LLD | 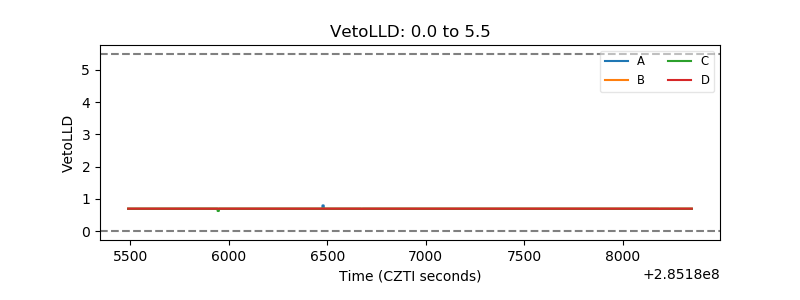 |
| Alpha Counter | 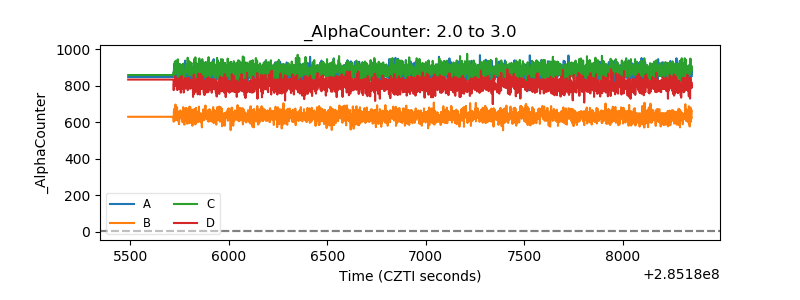 |
| _CPM_Rate | 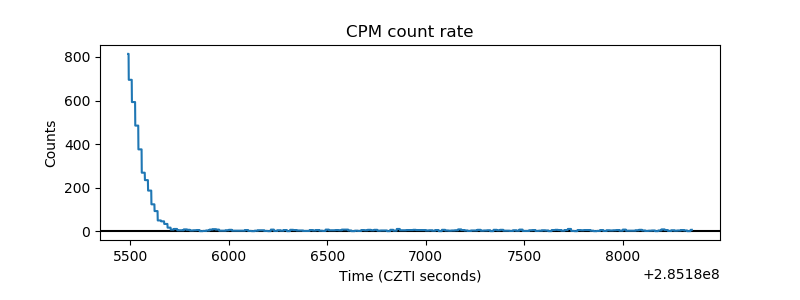 |
| CZT Counter | 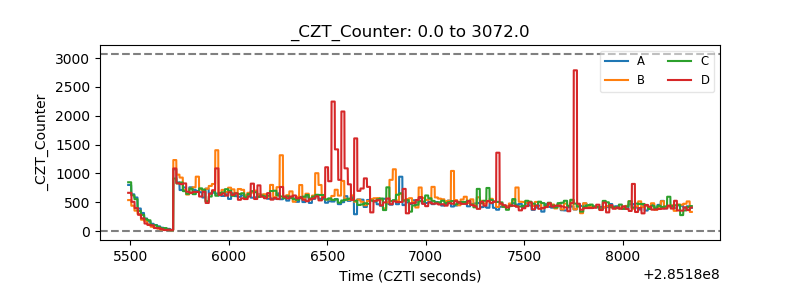 |
| +2.5 Volts monitor |  |
| +5 Volts monitor |  |
| _ROLL_ROT | 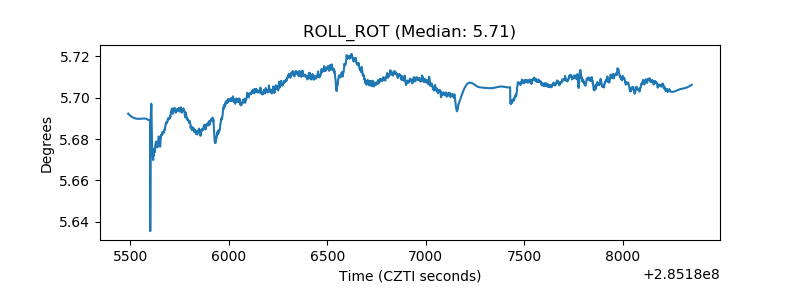 |
| _Roll_DEC | 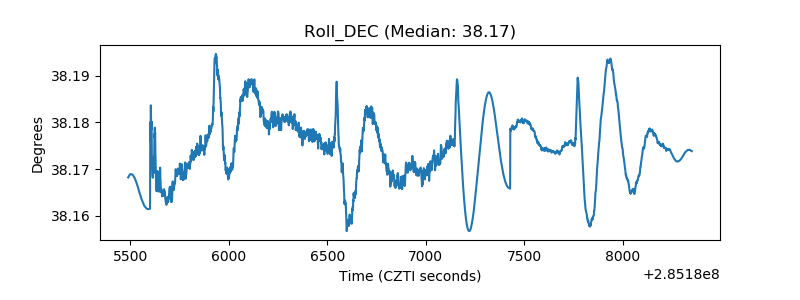 |
| _Roll_RA |  |
| Veto Counter | 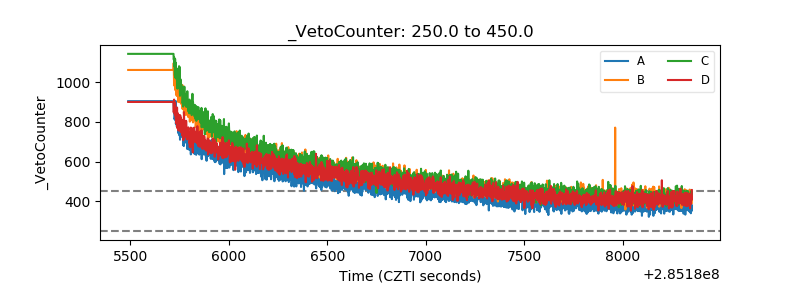 |