| Param | Original file | Final file |
|---|---|---|
| Filename | modeM0/AS1T03_070T09_9000002648cztM0_level2.fits | modeM0/AS1T03_070T09_9000002648cztM0_level2_quad_clean.evt |
| Size (bytes) | 183,741,120 | 163,535,040 |
| Size | 175.2 MB | 156.0 MB |
| Events in quadrant A | 1,132,288 | 957,506 |
| Events in quadrant B | 1,088,274 | 958,285 |
| Events in quadrant C | 1,073,704 | 885,592 |
| Events in quadrant D | 951,150 | 831,172 |
| Mode M9 | |||
|---|---|---|---|
| Quadrant | BADHDUFLAG | Total packets | Discarded packets |
| A | 0 | 29 | 0 |
| B | 0 | 29 | 0 |
| C | 0 | 29 | 0 |
| D | 0 | 29 | 0 |
| Mode SS | |||
|---|---|---|---|
| Quadrant | BADHDUFLAG | Total packets | Discarded packets |
| A | 0 | 390 | 0 |
| B | 0 | 390 | 0 |
| C | 0 | 390 | 0 |
| D | 0 | 390 | 0 |
| Mode M0 | |||
|---|---|---|---|
| Quadrant | BADHDUFLAG | Total packets | Discarded packets |
| A | 0 | 39185 | 0 |
| B | 0 | 40984 | 0 |
| C | 0 | 43719 | 0 |
| D | 0 | 43411 | 0 |
| Quadrant | Total seconds | Saturated seconds | Saturation percentage |
|---|---|---|---|
| A | 19144 | 164 | 0.856665% |
| B | 19144 | 267 | 1.394693% |
| C | 19144 | 820 | 4.283326% |
| D | 19144 | 493 | 2.575219% |
Noise dominated data is calculated using 1-second bins in cleaned event files. If a bin has >2000 counts, and if more than 50% of those come from <1% of pixels, then it is considered to be noise-dominated and hence unusable.
| Quadrant | # 1 sec bins | Bins with >0 counts | Bins with >2000 counts | High rate bins dominated by noise | Noise dominated (total time) | Noise dominated (detector-on time) | Marked lightcurve |
|---|---|---|---|---|---|---|---|
| A | 22149 | 19143 | 0 | 0 | 0.00% | 0.00% |  |
| B | 22149 | 19144 | 0 | 0 | 0.00% | 0.00% |  |
| C | 22149 | 19142 | 0 | 0 | 0.00% | 0.00% |  |
| D | 22149 | 19140 | 0 | 0 | 0.00% | 0.00% |  |
Top three noisy pixels from each quadrant. If the there are fewer than three noisy pixels in the level2.evt file, extra rows are filled as -1
| Pixel properties | Quadrant properties | ||||||
|---|---|---|---|---|---|---|---|
| Quadrant | DetID | PixID | Counts | Sigma | Mean | Median | Sigma |
| A | 0 | 29 | 1059 | 10.47 | 294 | 277 | 74.7 |
| A | 7 | 110 | 902 | 8.36 | 294 | 277 | 74.7 |
| A | 0 | 30 | 893 | 8.24 | 294 | 277 | 74.7 |
| B | 2 | 9 | 864 | 9.87 | 288 | 275 | 59.7 |
| B | 2 | 8 | 734 | 7.69 | 288 | 275 | 59.7 |
| B | 3 | 17 | 705 | 7.21 | 288 | 275 | 59.7 |
| C | 1 | 81 | 822 | 7.43 | 284 | 265 | 75.0 |
| C | 1 | 80 | 793 | 7.04 | 284 | 265 | 75.0 |
| C | 3 | 126 | 755 | 6.53 | 284 | 265 | 75.0 |
| D | 3 | 14 | 698 | 6.18 | 270 | 246 | 73.2 |
| D | 6 | 231 | 695 | 6.14 | 270 | 246 | 73.2 |
| D | 10 | 189 | 683 | 5.97 | 270 | 246 | 73.2 |
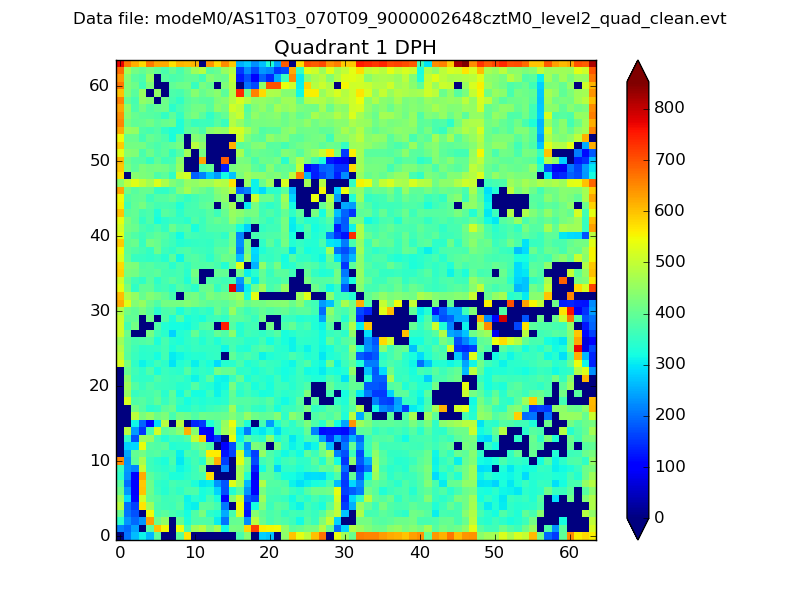
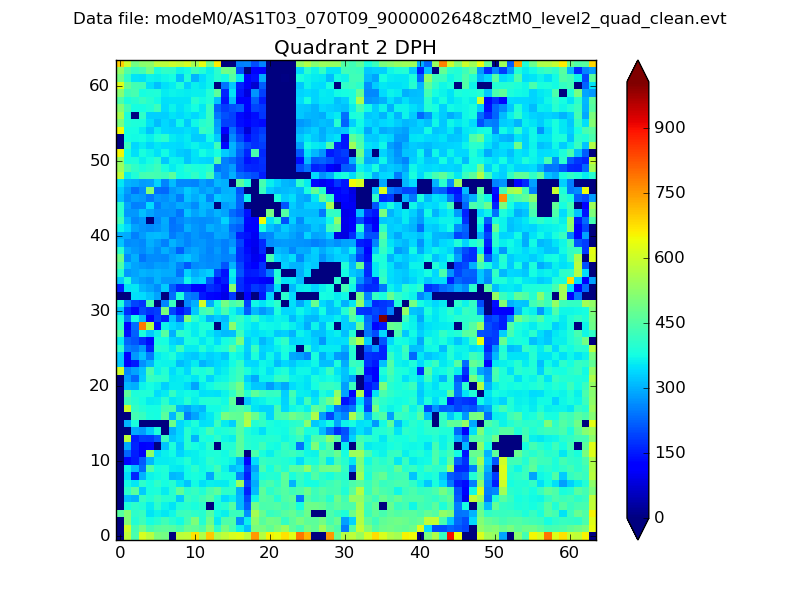
Histogram calculated using DETX and DETY for each event in the final _common_clean file
| Quadrant A |  |
 |
Quadrant B |
|---|---|---|---|
| Quadrant D | 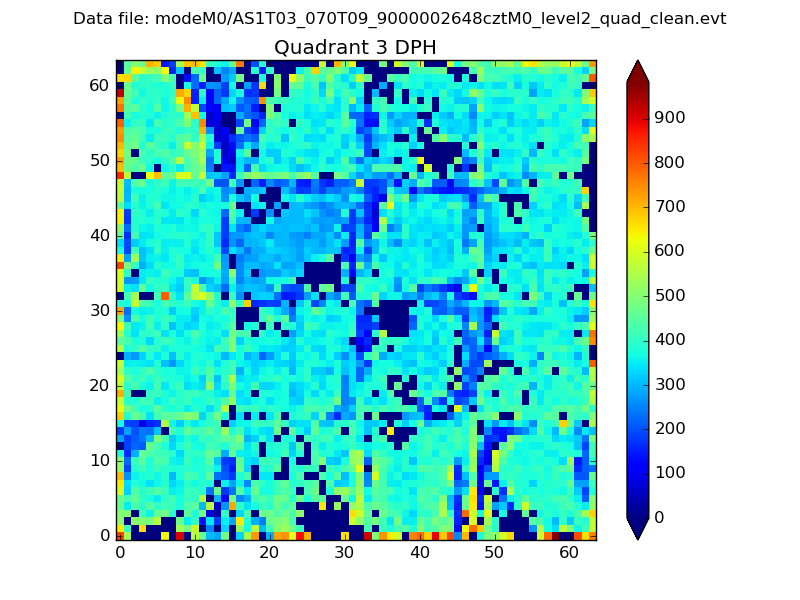 |
 |
Quadrant C |
| Plot type | Count rate plots | Images |
|---|---|---|
| Comparison with Poisson distribution Blue bars denote a histogram of data divided into 1 sec bins. Red curve is a Poisson curve with rate = median count rate of data. |
 |
 |
| Quadrant-wise count rates Data is divided into 100 sec bins |
 |
|
| Module-wise count rates for Quadrant A Data is divided into 100 sec bins |
 |
 |
| Module-wise count rates for Quadrant B Data is divided into 100 sec bins |
 |
 |
| Module-wise count rates for Quadrant C Data is divided into 100 sec bins |
 |
 |
| Module-wise count rates for Quadrant D Data is divided into 100 sec bins |
 |
 |
| Parameter | Plot |
|---|---|
| CZT HV Monitor |  |
| D_VDD | 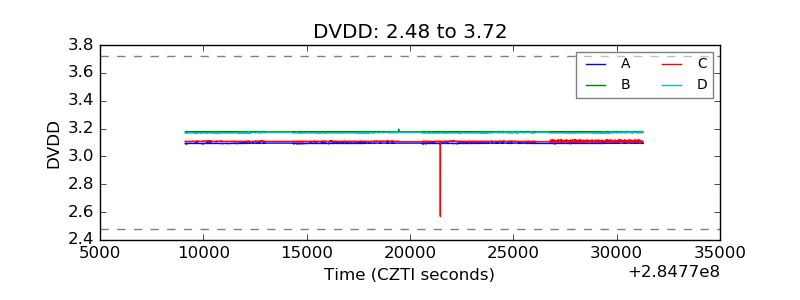 |
| Temperature 1 |  |
| Veto HV Monitor |  |
| Veto LLD |  |
| Alpha Counter |  |
| _CPM_Rate |  |
| CZT Counter |  |
| +2.5 Volts monitor |  |
| +5 Volts monitor |  |
| _ROLL_ROT |  |
| _Roll_DEC |  |
| _Roll_RA |  |
| Veto Counter |  |