| Param | Original file | Final file |
|---|---|---|
| Filename | modeM0/AS1T03_070T09_9000002648_17761cztM0_level2.evt | modeM0/AS1T03_070T09_9000002648_17761cztM0_level2_quad_clean.evt |
| Size (bytes) | 377,432,640 | 57,064,320 |
| Size | 359.9 MB | 54.4 MB |
| Events in quadrant A | 2,561,280 | 344,606 |
| Events in quadrant B | 2,786,611 | 351,917 |
| Events in quadrant C | 2,811,371 | 327,358 |
| Events in quadrant D | 2,904,827 | 326,812 |
| Mode M9 | |||
|---|---|---|---|
| Quadrant | BADHDUFLAG | Total packets | Discarded packets |
| A | 0 | 13 | 0 |
| B | 0 | 13 | 0 |
| C | 0 | 13 | 0 |
| D | 0 | 13 | 0 |
| Mode SS | |||
|---|---|---|---|
| Quadrant | BADHDUFLAG | Total packets | Discarded packets |
| A | 0 | 110 | 0 |
| B | 0 | 110 | 0 |
| C | 0 | 110 | 0 |
| D | 0 | 110 | 0 |
| Mode M0 | |||
|---|---|---|---|
| Quadrant | BADHDUFLAG | Total packets | Discarded packets |
| A | 0 | 11073 | 1 |
| B | 0 | 11607 | 1 |
| C | 0 | 11598 | 1 |
| D | 0 | 12290 | 1 |
| Quadrant | Total seconds | Saturated seconds | Saturation percentage |
|---|---|---|---|
| A | 5382 | 14 | 0.260126% |
| B | 5382 | 45 | 0.836120% |
| C | 5382 | 116 | 2.155333% |
| D | 5382 | 131 | 2.434039% |
Noise dominated data is calculated using 1-second bins in cleaned event files. If a bin has >2000 counts, and if more than 50% of those come from <1% of pixels, then it is considered to be noise-dominated and hence unusable.
| Quadrant | # 1 sec bins | Bins with >0 counts | Bins with >2000 counts | High rate bins dominated by noise | Noise dominated (total time) | Noise dominated (detector-on time) | Marked lightcurve |
|---|---|---|---|---|---|---|---|
| A | 6702 | 5383 | 1 | 1 | 0.01% | 0.02% |  |
| B | 6702 | 5383 | 2 | 2 | 0.03% | 0.04% | 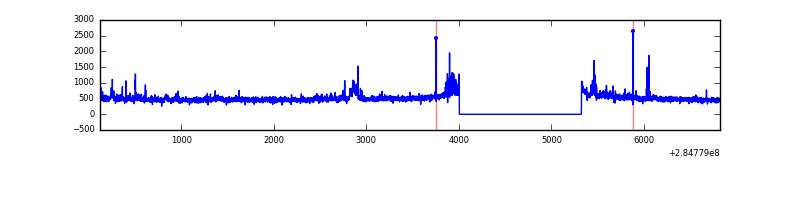 |
| C | 6702 | 5383 | 38 | 38 | 0.57% | 0.71% | 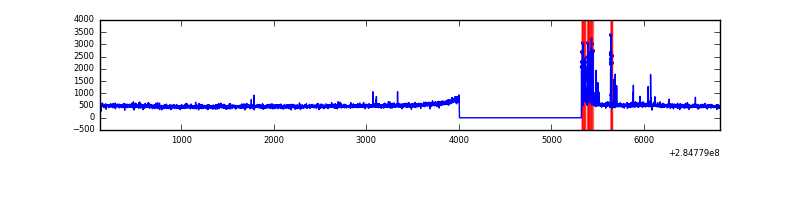 |
| D | 6702 | 5383 | 117 | 117 | 1.75% | 2.17% | 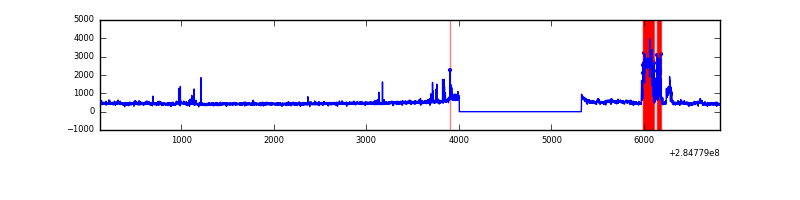 |
Top three noisy pixels from each quadrant. If the there are fewer than three noisy pixels in the level2.evt file, extra rows are filled as -1
| Pixel properties | Quadrant properties | ||||||
|---|---|---|---|---|---|---|---|
| Quadrant | DetID | PixID | Counts | Sigma | Mean | Median | Sigma |
| A | 4 | 2 | 11372 | 81.01 | 662 | 647 | 132.4 |
| A | 0 | 226 | 5559 | 37.1 | 662 | 647 | 132.4 |
| A | 3 | 137 | 4840 | 31.67 | 662 | 647 | 132.4 |
| B | 0 | 219 | 85541 | 669.09 | 666 | 651 | 126.9 |
| B | 0 | 230 | 48010 | 373.27 | 666 | 651 | 126.9 |
| B | 7 | 220 | 25027 | 192.13 | 666 | 651 | 126.9 |
| C | 4 | 254 | 187333 | 1264.19 | 632 | 637 | 147.7 |
| C | 14 | 238 | 98888 | 665.3 | 632 | 637 | 147.7 |
| C | 5 | 218 | 42199 | 281.43 | 632 | 637 | 147.7 |
| D | 7 | 238 | 441254 | 2693.17 | 629 | 613 | 163.6 |
| D | 2 | 152 | 52619 | 317.85 | 629 | 613 | 163.6 |
| D | 2 | 234 | 20471 | 121.37 | 629 | 613 | 163.6 |
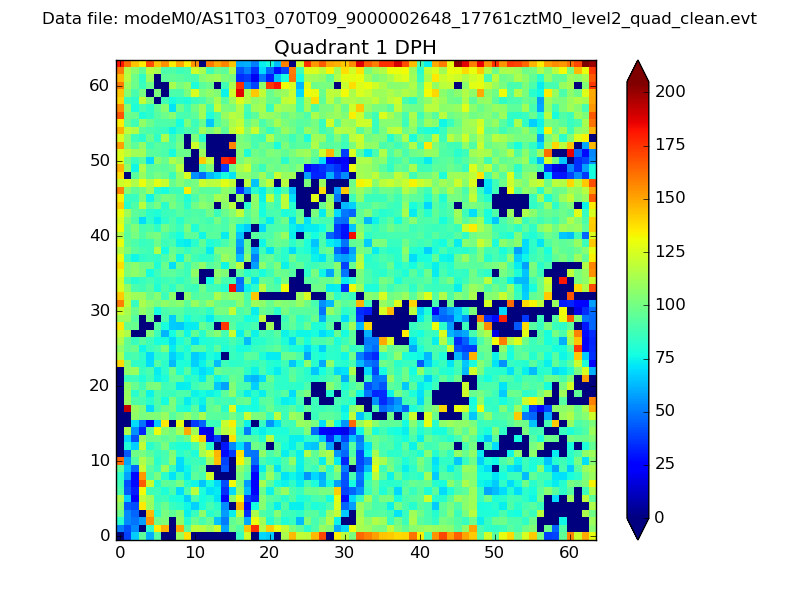
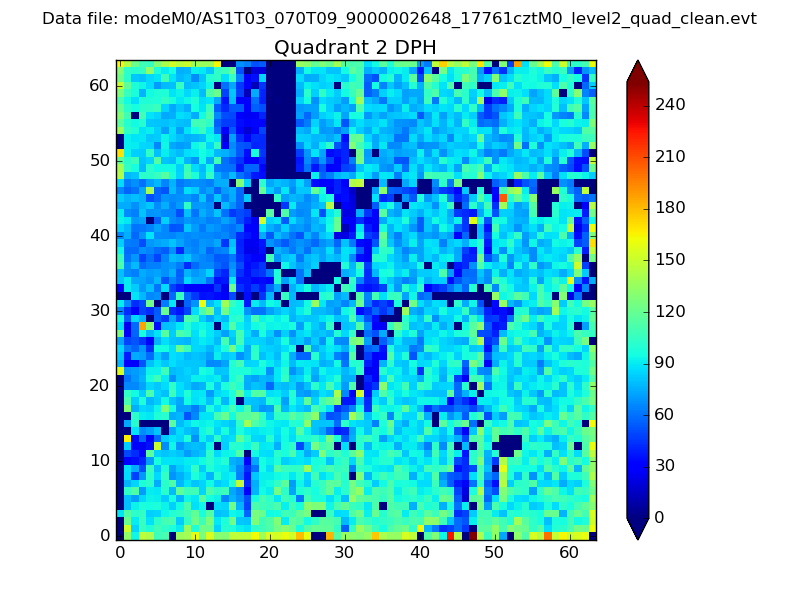
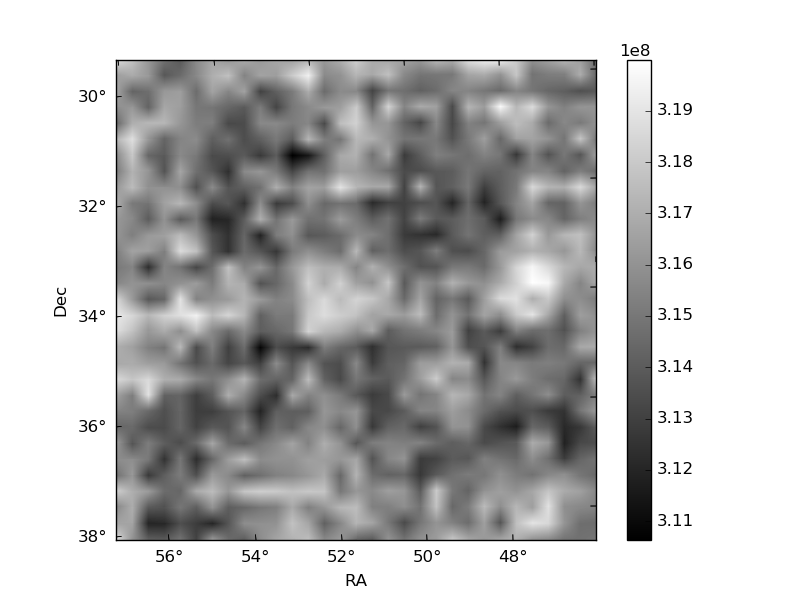
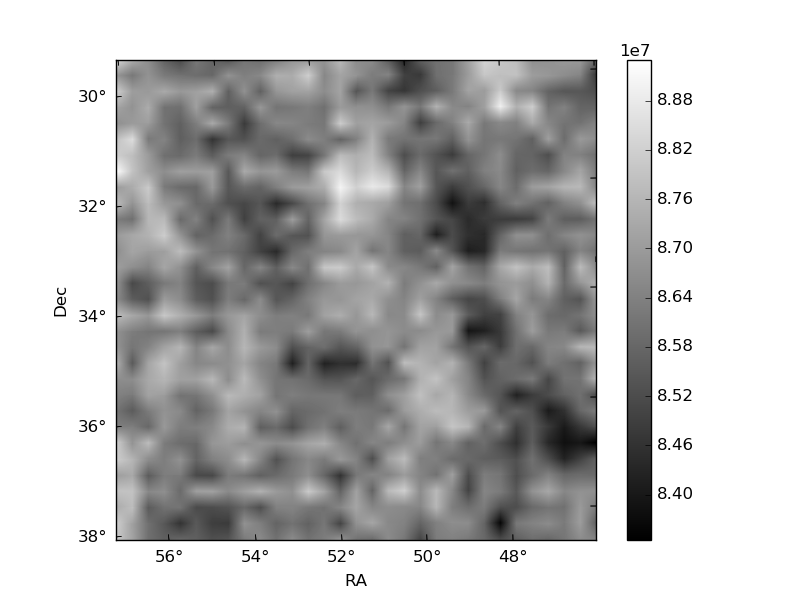
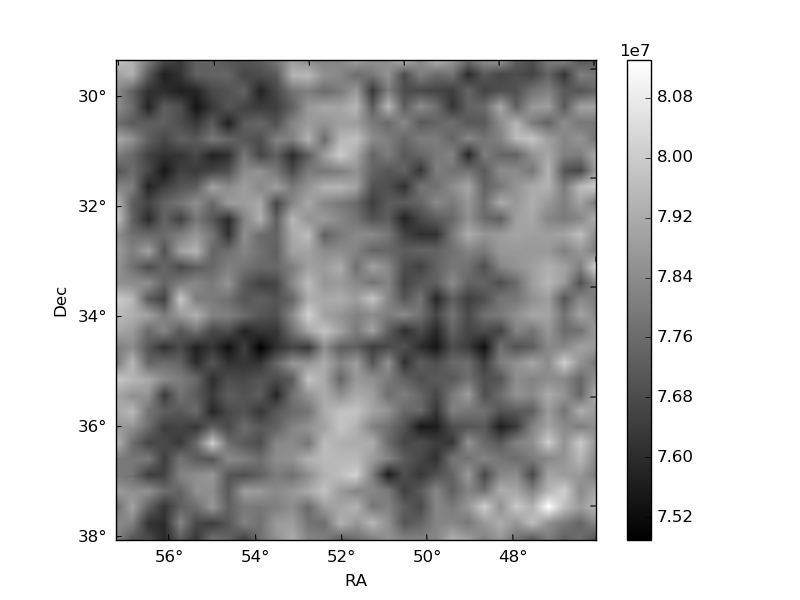
Histogram calculated using DETX and DETY for each event in the final _common_clean file
| Quadrant A | 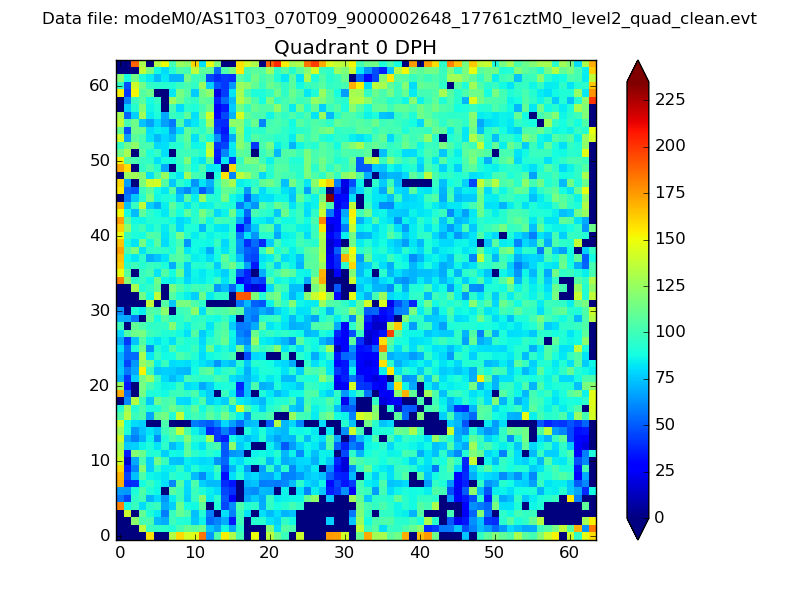 |
 |
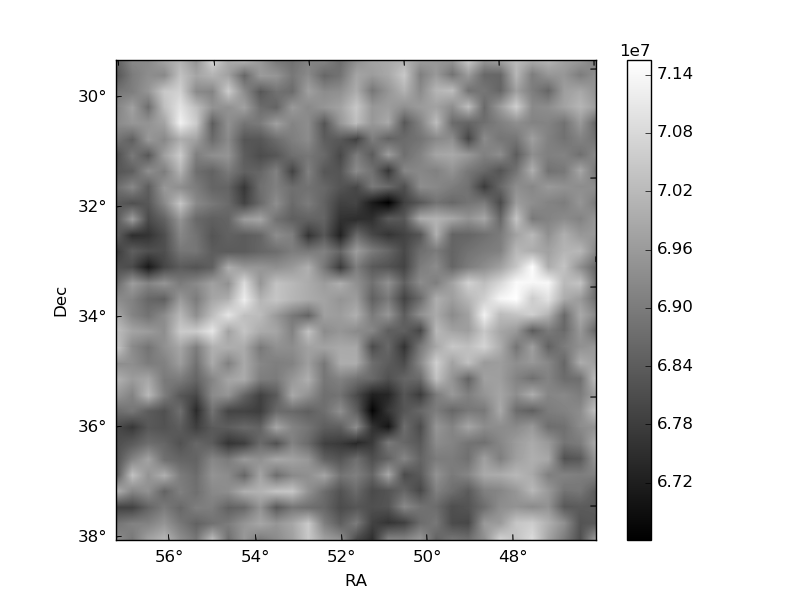
Quadrant B |
|---|---|---|---|
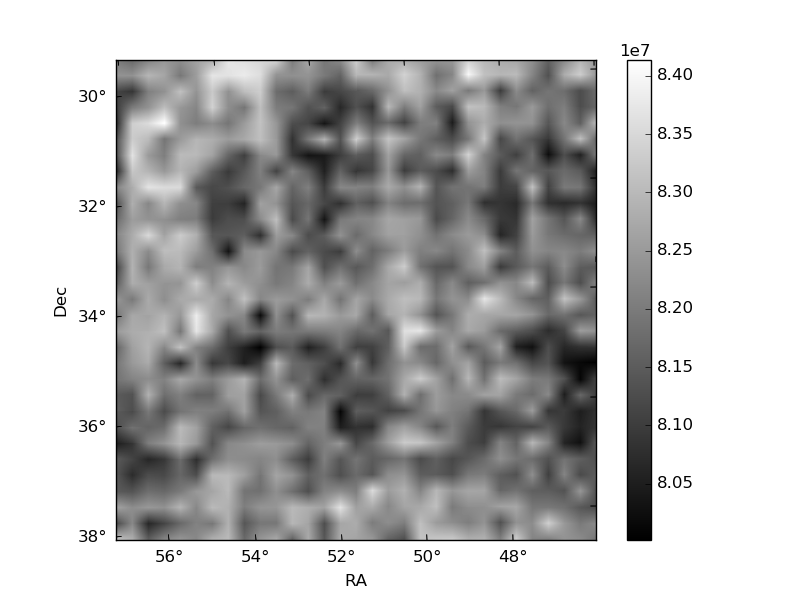
| Quadrant D | 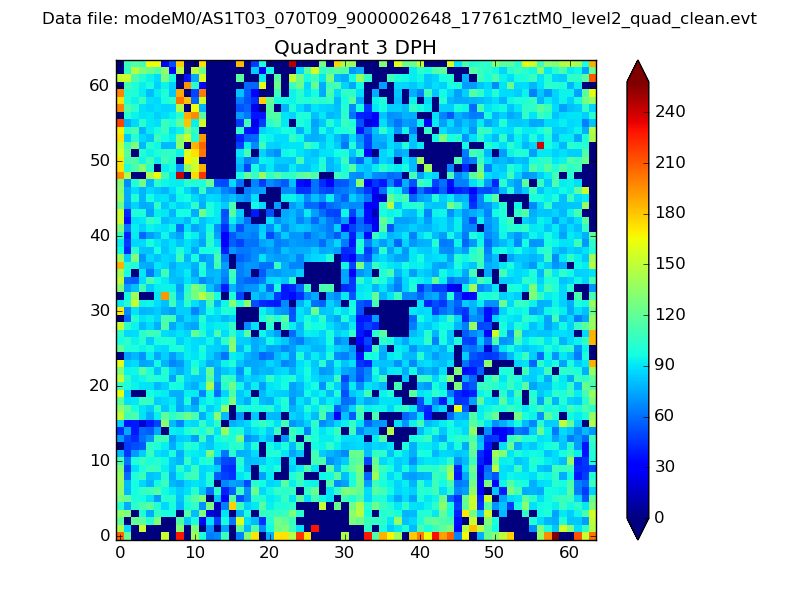 |
 |
Quadrant C |
| Plot type | Count rate plots | Images |
|---|---|---|
| Comparison with Poisson distribution Blue bars denote a histogram of data divided into 1 sec bins. Red curve is a Poisson curve with rate = median count rate of data. |
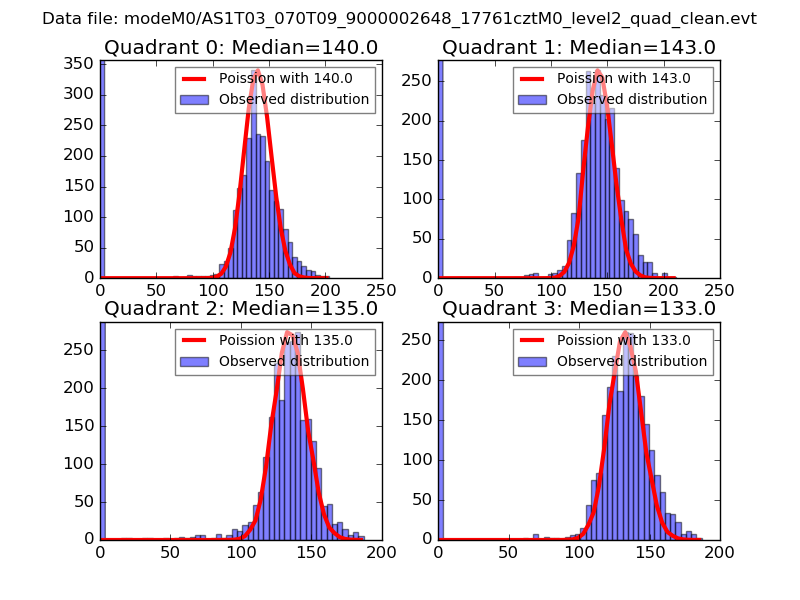 |
 |
| Quadrant-wise count rates Data is divided into 100 sec bins |
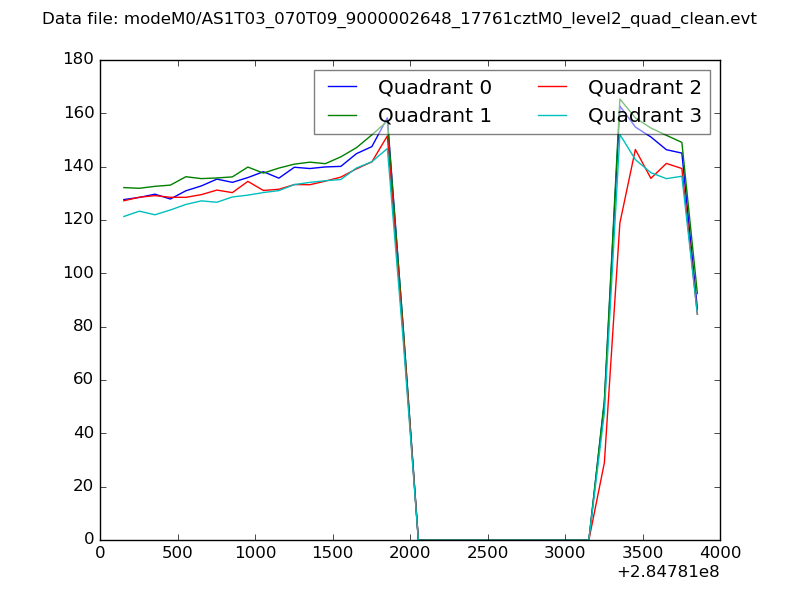 |
|
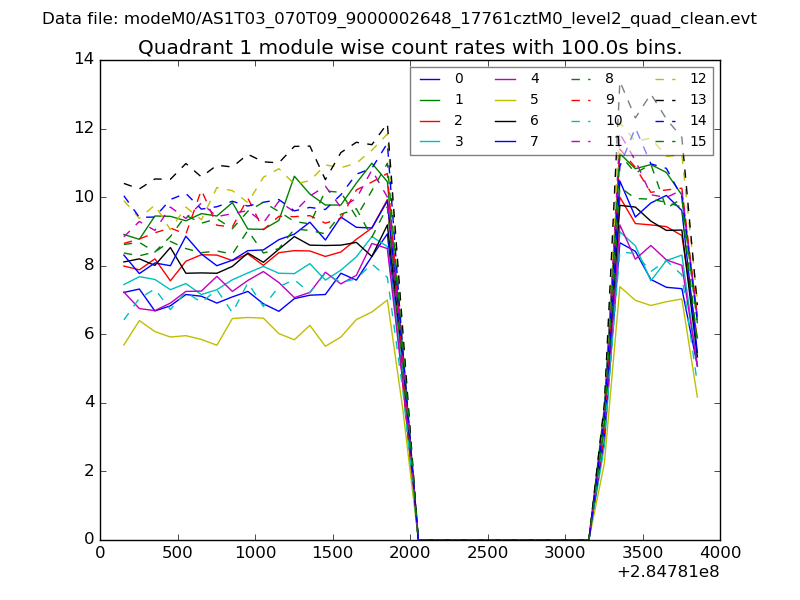
| Module-wise count rates for Quadrant A Data is divided into 100 sec bins |
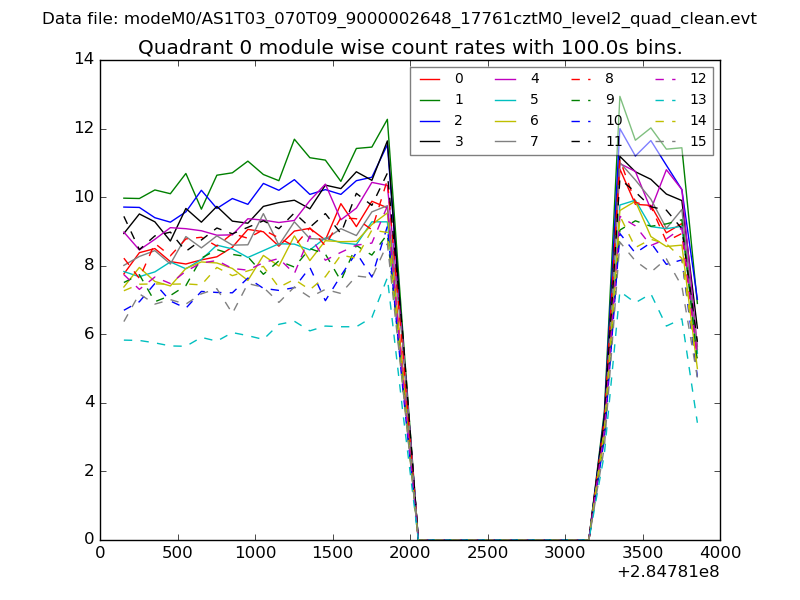 |
 |
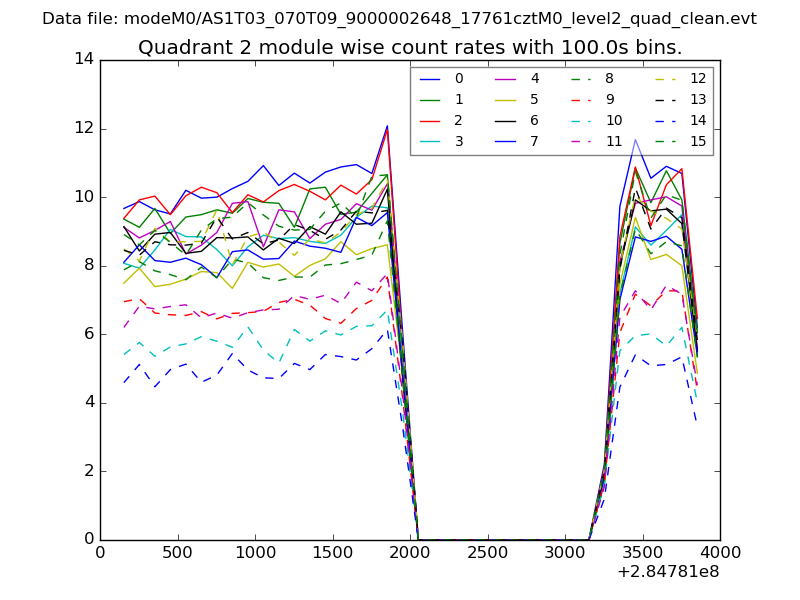
| Module-wise count rates for Quadrant B Data is divided into 100 sec bins |
 |
 |
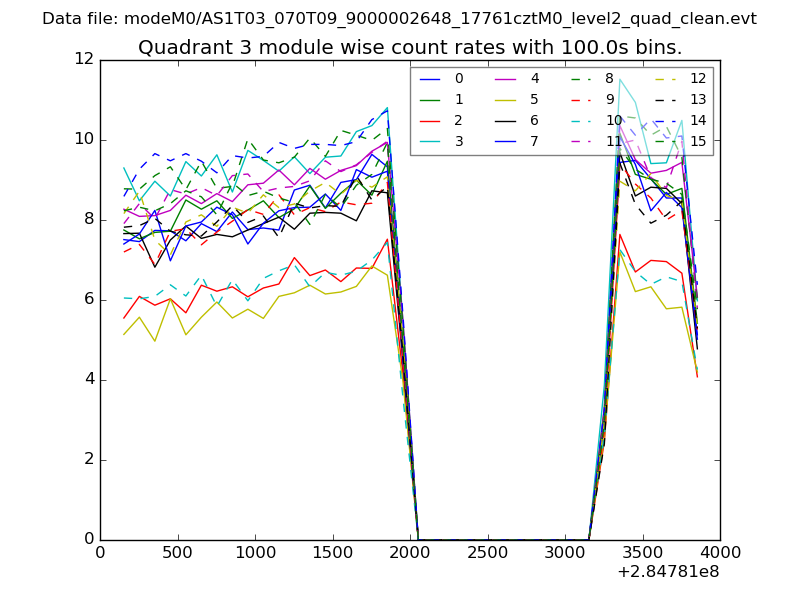
| Module-wise count rates for Quadrant C Data is divided into 100 sec bins |
 |
 |
| Module-wise count rates for Quadrant D Data is divided into 100 sec bins |
 |
 |
| Parameter | Plot |
|---|---|
| CZT HV Monitor | 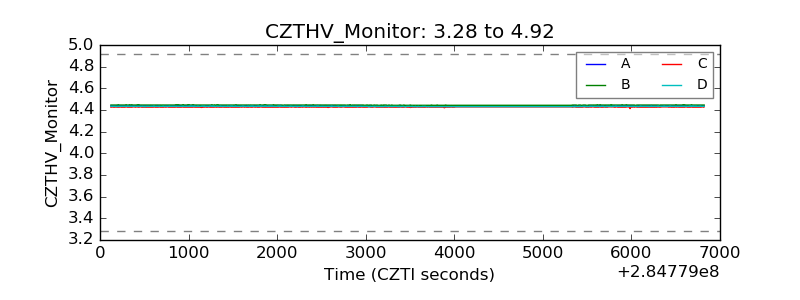 |
| D_VDD | 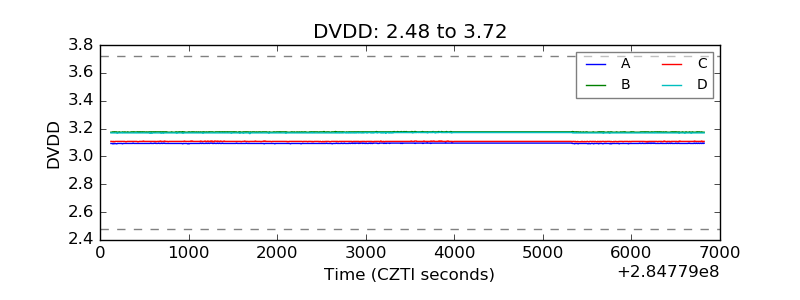 |
| Temperature 1 | 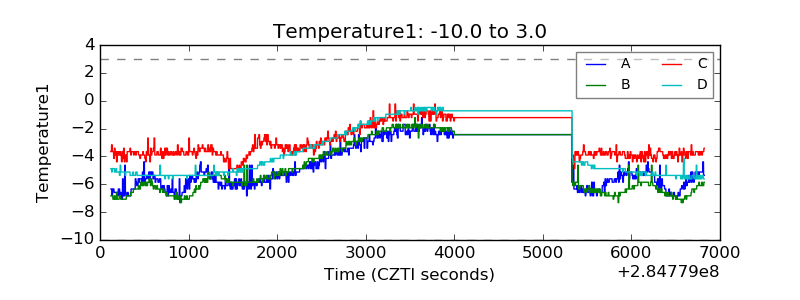 |
| Veto HV Monitor | 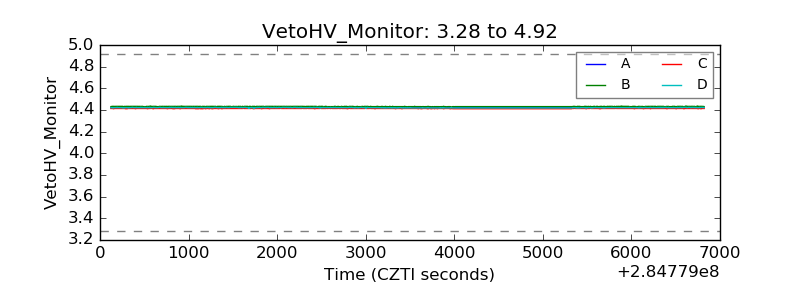 |
| Veto LLD | 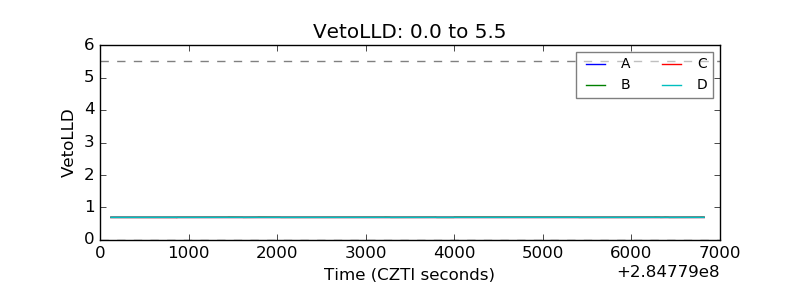 |
| Alpha Counter | 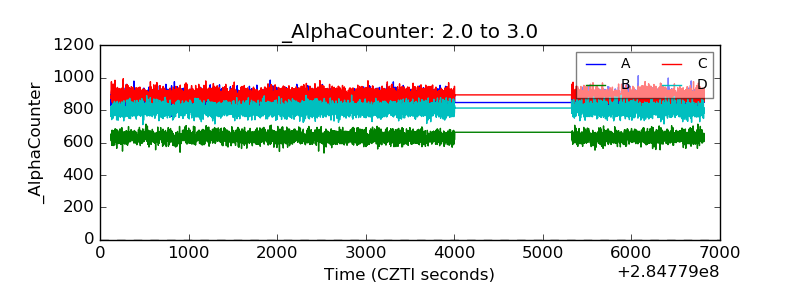 |
| _CPM_Rate | 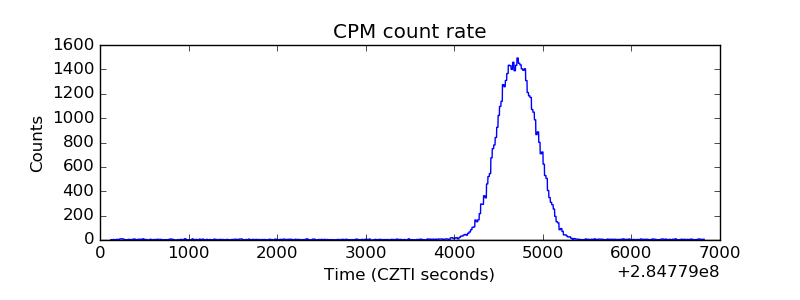 |
| CZT Counter | 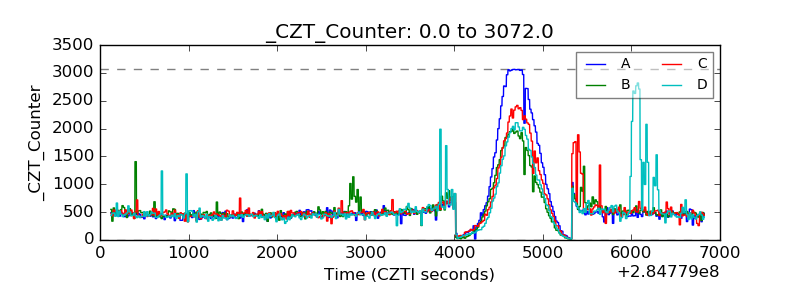 |
| +2.5 Volts monitor | 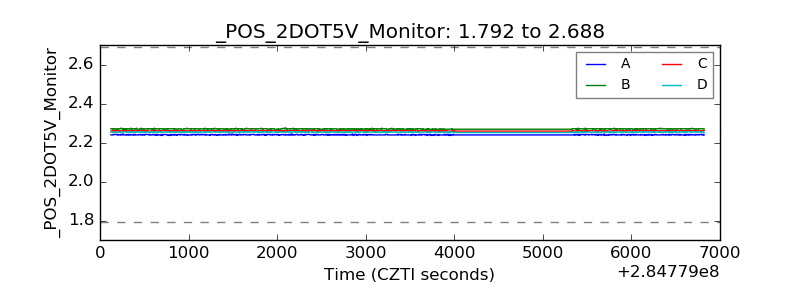 |
| +5 Volts monitor |  |
| _ROLL_ROT | 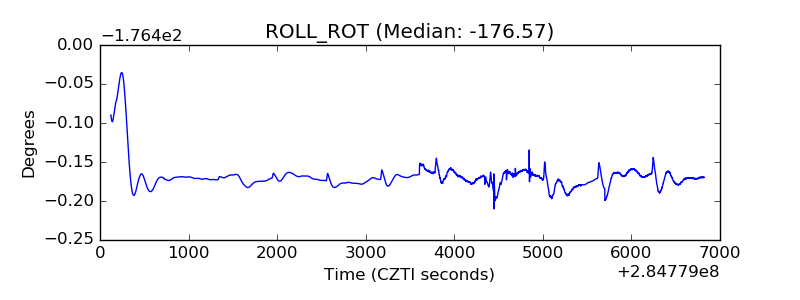 |
| _Roll_DEC | 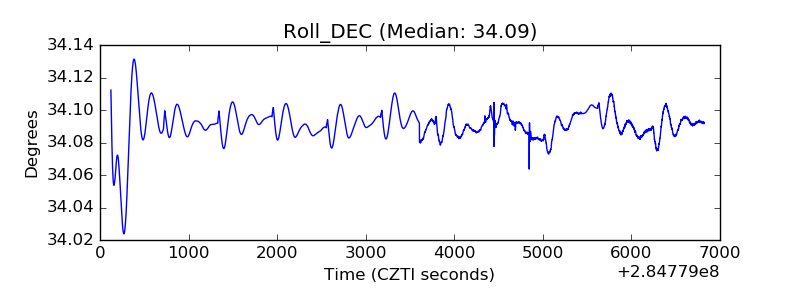 |
| _Roll_RA | 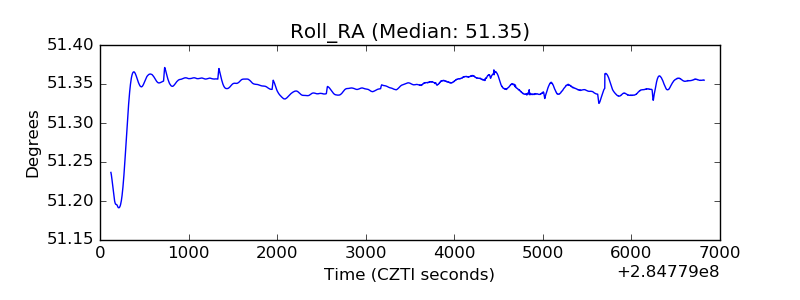 |
| Veto Counter | 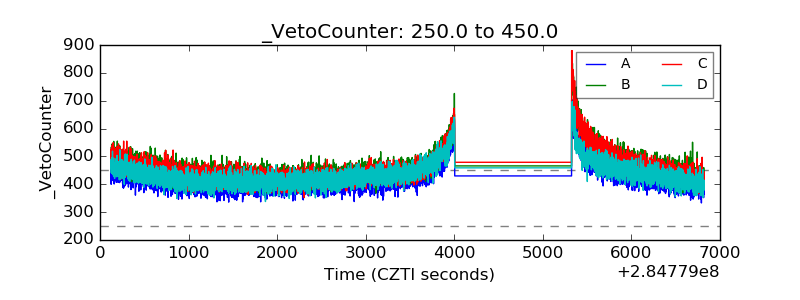 |