| Param | Original file | Final file |
|---|---|---|
| Filename | modeM0/AS1T03_070T09_9000002648_17762cztM0_level2.evt | modeM0/AS1T03_070T09_9000002648_17762cztM0_level2_quad_clean.evt |
| Size (bytes) | 500,780,160 | 77,688,000 |
| Size | 477.6 MB | 74.1 MB |
| Events in quadrant A | 3,308,049 | 478,280 |
| Events in quadrant B | 3,587,774 | 485,271 |
| Events in quadrant C | 3,782,927 | 454,188 |
| Events in quadrant D | 4,014,890 | 449,849 |
| Mode M9 | |||
|---|---|---|---|
| Quadrant | BADHDUFLAG | Total packets | Discarded packets |
| A | 0 | 23 | 0 |
| B | 0 | 23 | 0 |
| C | 0 | 23 | 0 |
| D | 0 | 23 | 0 |
| Mode SS | |||
|---|---|---|---|
| Quadrant | BADHDUFLAG | Total packets | Discarded packets |
| A | 0 | 144 | 0 |
| B | 0 | 144 | 0 |
| C | 0 | 144 | 0 |
| D | 0 | 144 | 0 |
| Mode M0 | |||
|---|---|---|---|
| Quadrant | BADHDUFLAG | Total packets | Discarded packets |
| A | 0 | 14395 | 2 |
| B | 0 | 15080 | 2 |
| C | 0 | 15518 | 2 |
| D | 0 | 16826 | 2 |
| Quadrant | Total seconds | Saturated seconds | Saturation percentage |
|---|---|---|---|
| A | 6952 | 66 | 0.949367% |
| B | 6952 | 124 | 1.783659% |
| C | 6953 | 227 | 3.264778% |
| D | 6953 | 292 | 4.199626% |
Noise dominated data is calculated using 1-second bins in cleaned event files. If a bin has >2000 counts, and if more than 50% of those come from <1% of pixels, then it is considered to be noise-dominated and hence unusable.
| Quadrant | # 1 sec bins | Bins with >0 counts | Bins with >2000 counts | High rate bins dominated by noise | Noise dominated (total time) | Noise dominated (detector-on time) | Marked lightcurve |
|---|---|---|---|---|---|---|---|
| A | 9337 | 6954 | 0 | 0 | 0.00% | 0.00% |  |
| B | 9337 | 6954 | 11 | 11 | 0.12% | 0.16% | 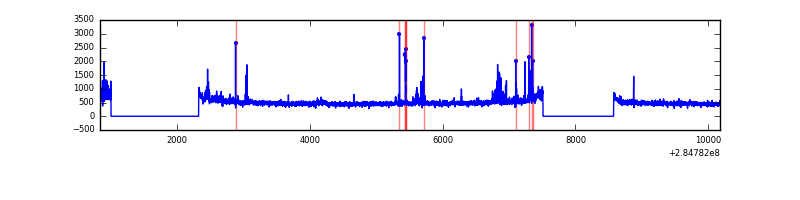 |
| C | 9338 | 6955 | 63 | 63 | 0.67% | 0.91% | 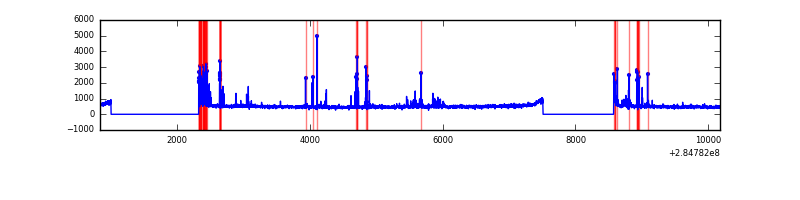 |
| D | 9338 | 6955 | 236 | 236 | 2.53% | 3.39% | 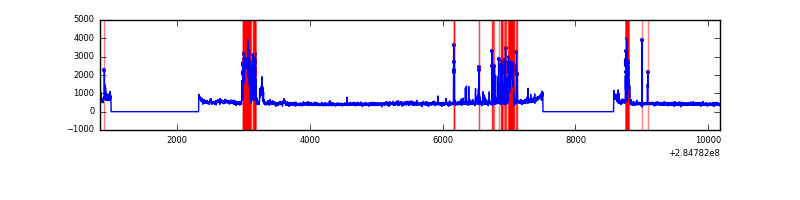 |
Top three noisy pixels from each quadrant. If the there are fewer than three noisy pixels in the level2.evt file, extra rows are filled as -1
| Pixel properties | Quadrant properties | ||||||
|---|---|---|---|---|---|---|---|
| Quadrant | DetID | PixID | Counts | Sigma | Mean | Median | Sigma |
| A | 0 | 226 | 7337 | 37.17 | 860 | 842 | 174.7 |
| A | 3 | 137 | 6316 | 31.33 | 860 | 842 | 174.7 |
| A | 12 | 194 | 6165 | 30.46 | 860 | 842 | 174.7 |
| B | 7 | 220 | 80951 | 485.65 | 863 | 844 | 164.9 |
| B | 0 | 219 | 72536 | 434.63 | 863 | 844 | 164.9 |
| B | 0 | 230 | 42218 | 250.83 | 863 | 844 | 164.9 |
| C | 4 | 254 | 365873 | 1908.55 | 818 | 824 | 191.3 |
| C | 14 | 238 | 127991 | 664.85 | 818 | 824 | 191.3 |
| C | 5 | 218 | 62430 | 322.09 | 818 | 824 | 191.3 |
| D | 7 | 238 | 821111 | 4122.79 | 813 | 790 | 199.0 |
| D | 2 | 152 | 55019 | 272.55 | 813 | 790 | 199.0 |
| D | 2 | 165 | 26328 | 128.35 | 813 | 790 | 199.0 |
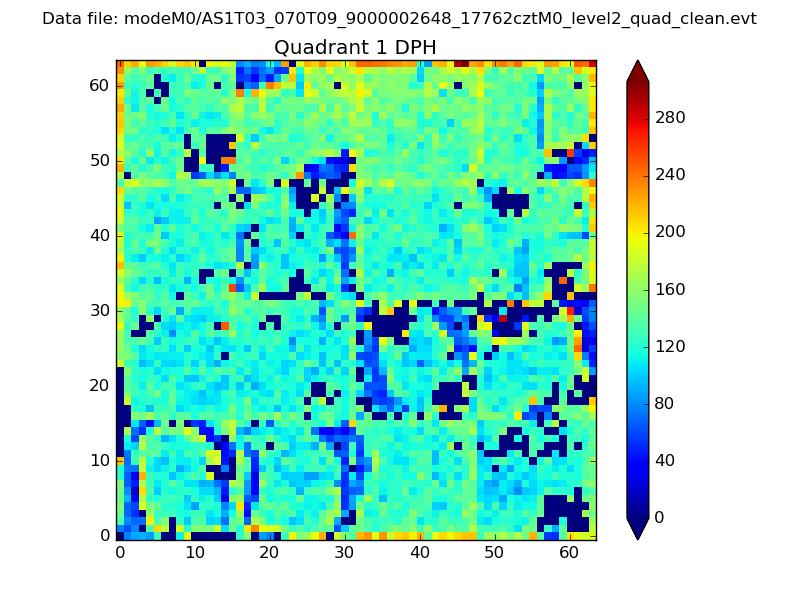
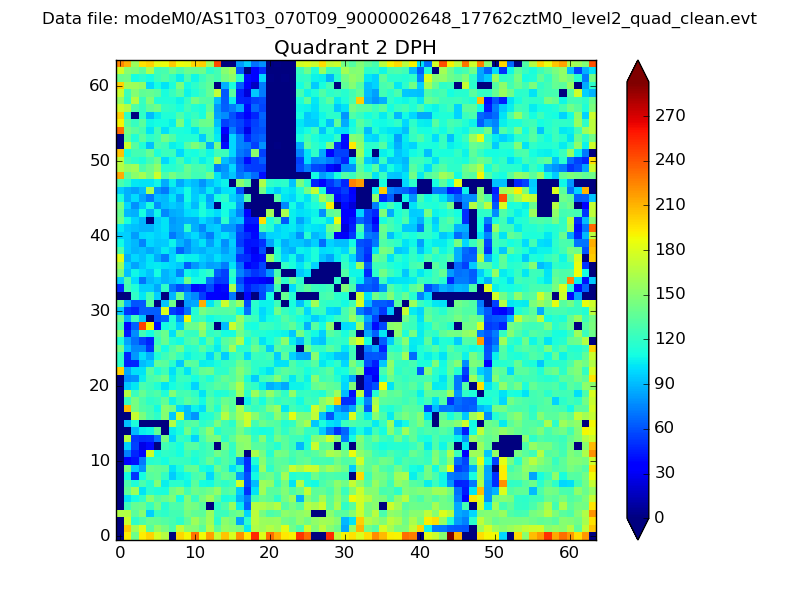
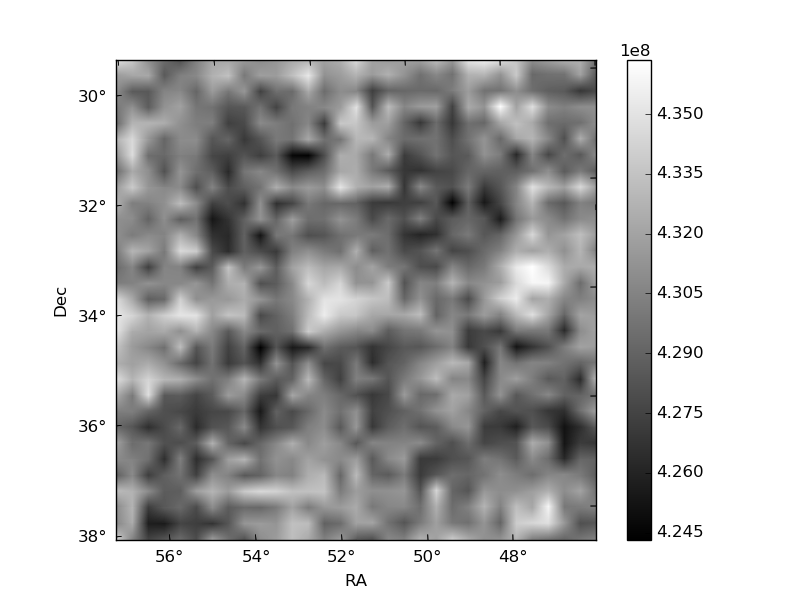
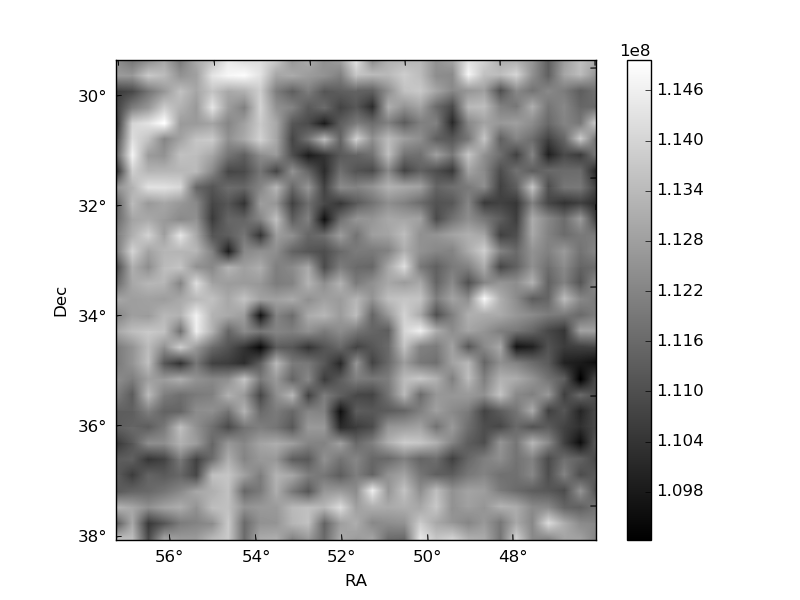
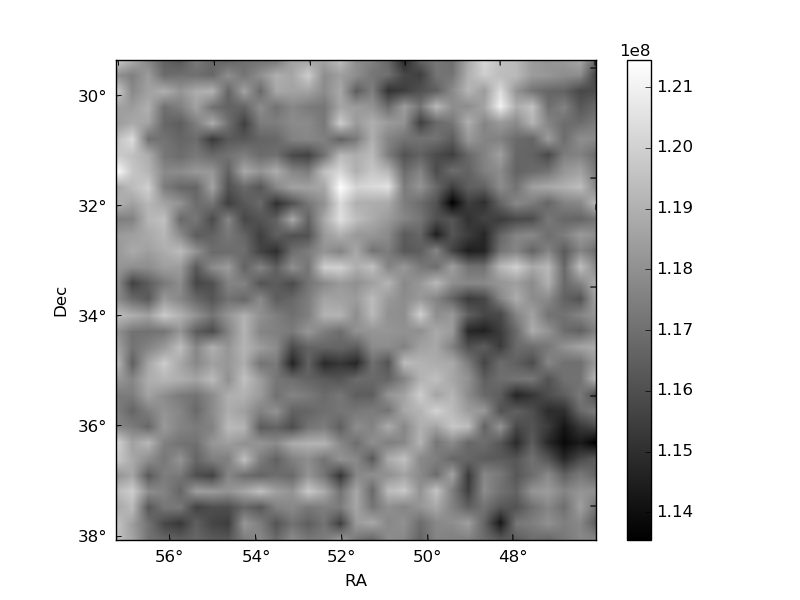
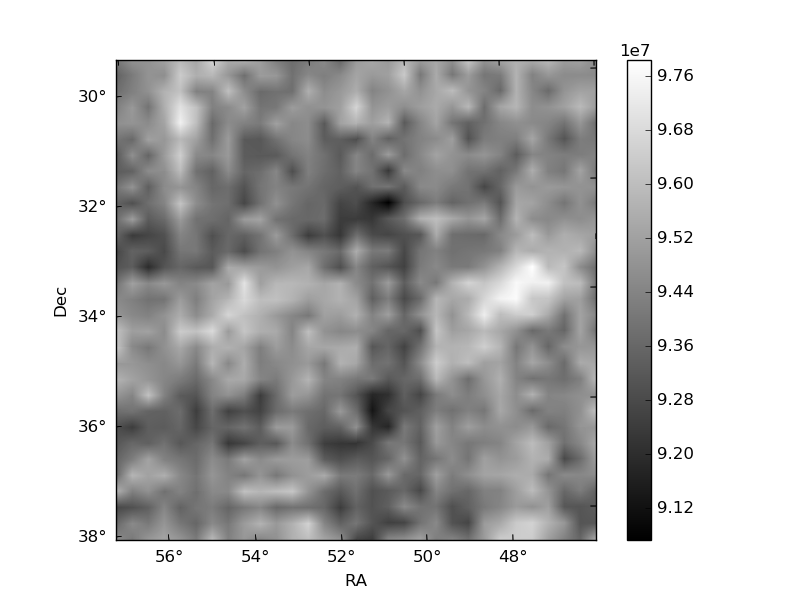
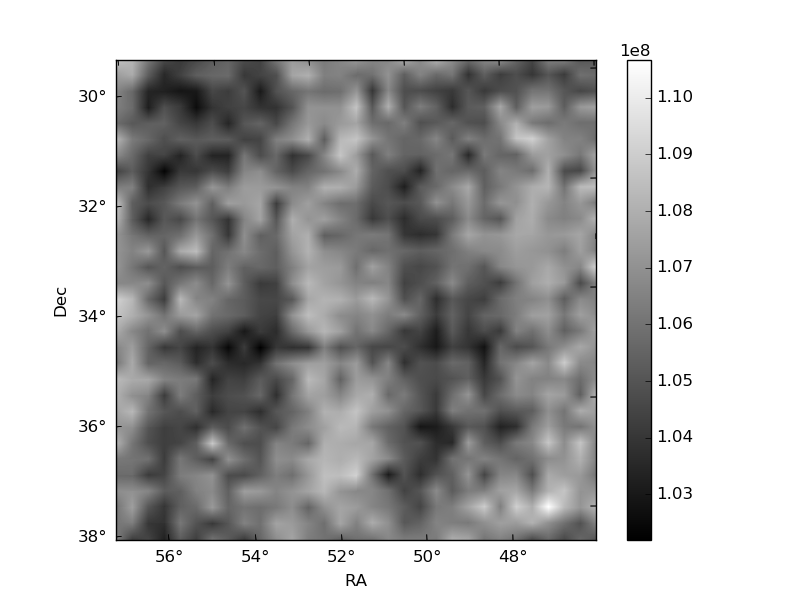
Histogram calculated using DETX and DETY for each event in the final _common_clean file
| Quadrant A | 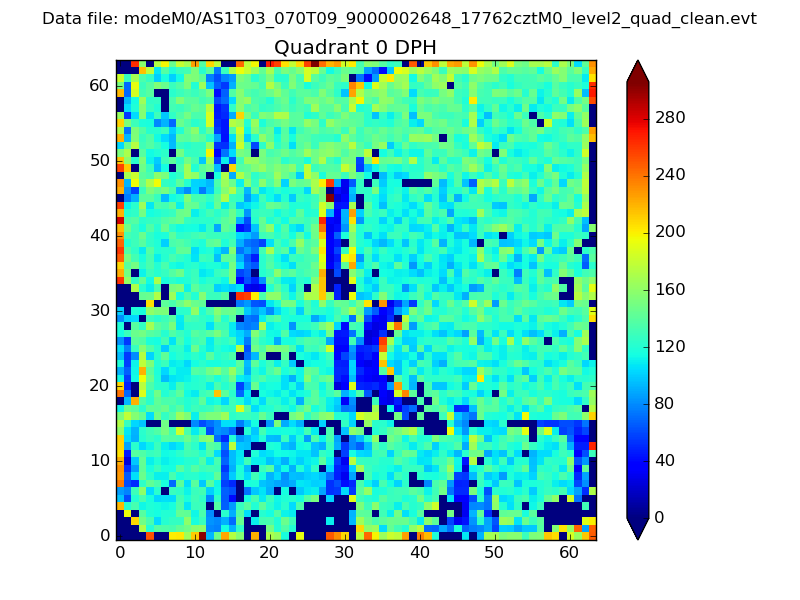 |
 |
Quadrant B |
|---|---|---|---|
| Quadrant D | 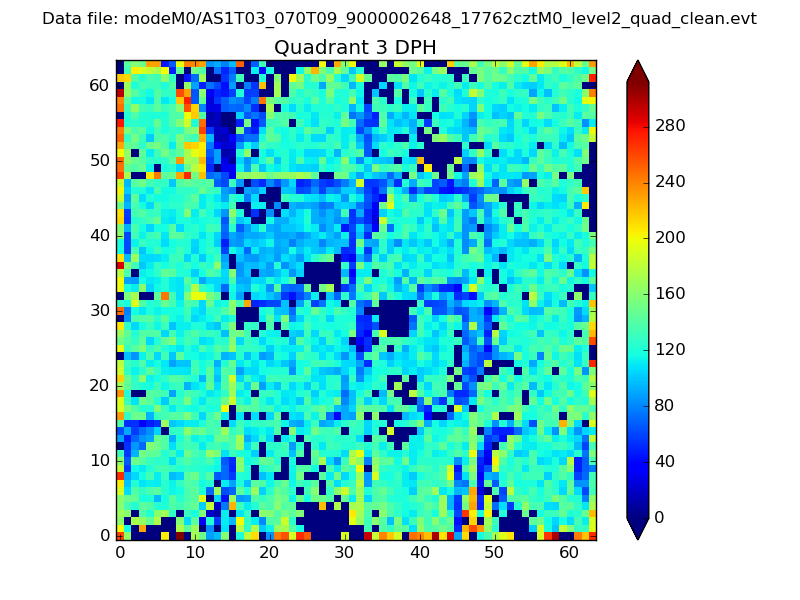 |
 |
Quadrant C |
| Plot type | Count rate plots | Images |
|---|---|---|
| Comparison with Poisson distribution Blue bars denote a histogram of data divided into 1 sec bins. Red curve is a Poisson curve with rate = median count rate of data. |
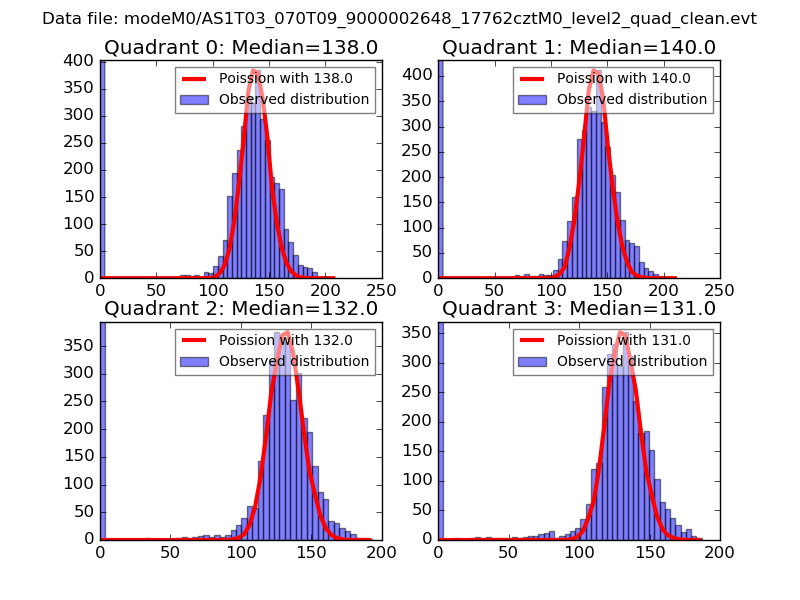 |
 |
| Quadrant-wise count rates Data is divided into 100 sec bins |
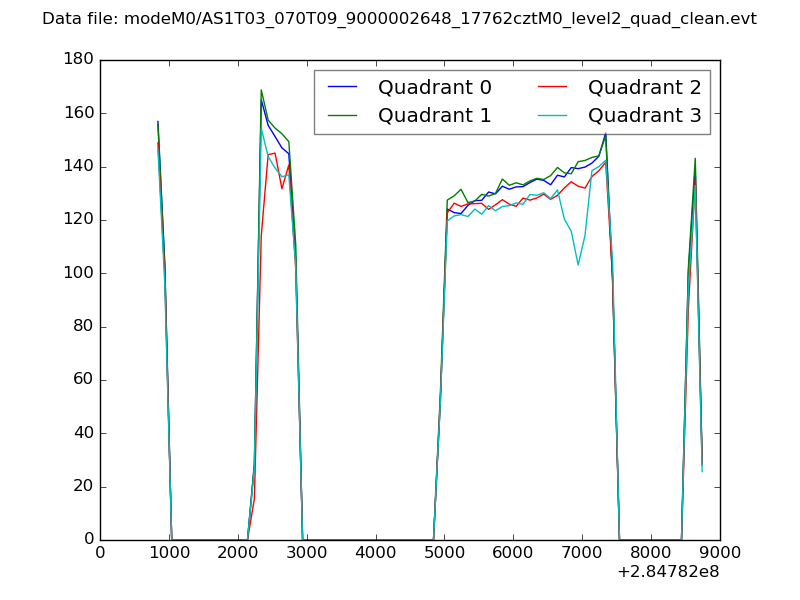 |
|
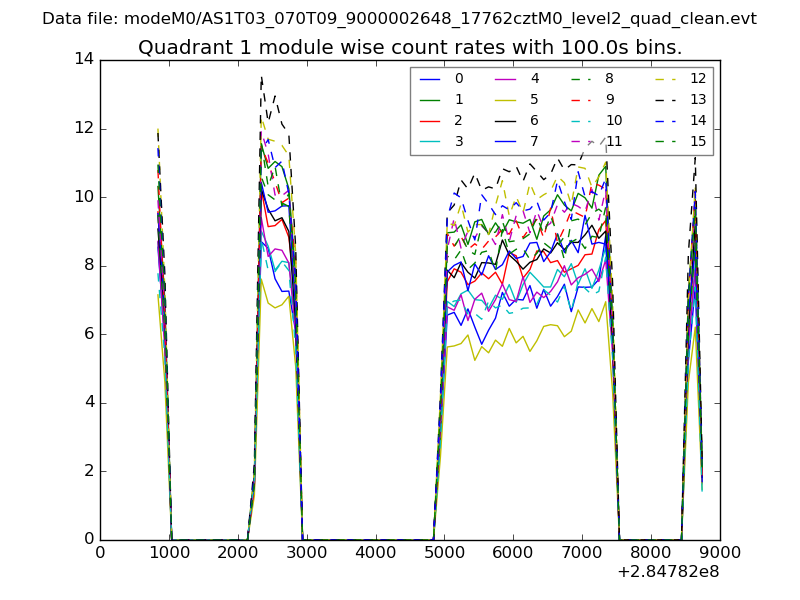
| Module-wise count rates for Quadrant A Data is divided into 100 sec bins |
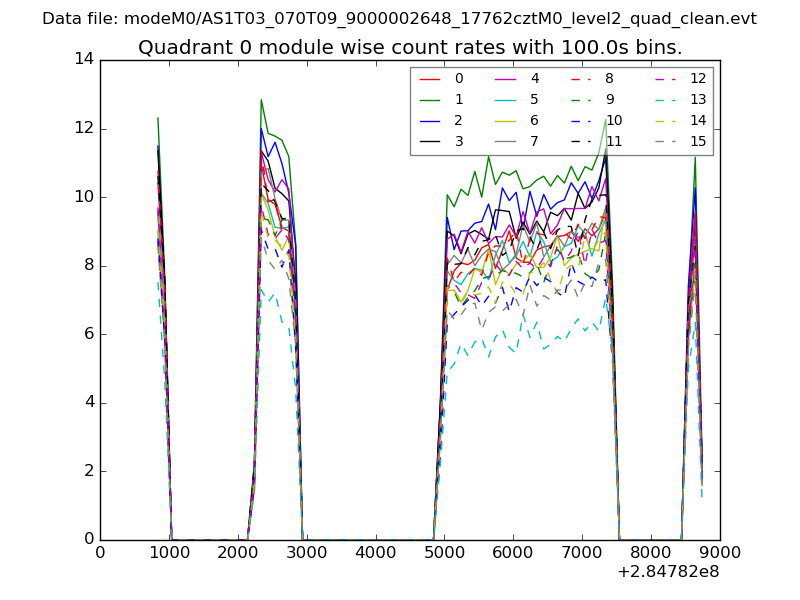 |
 |
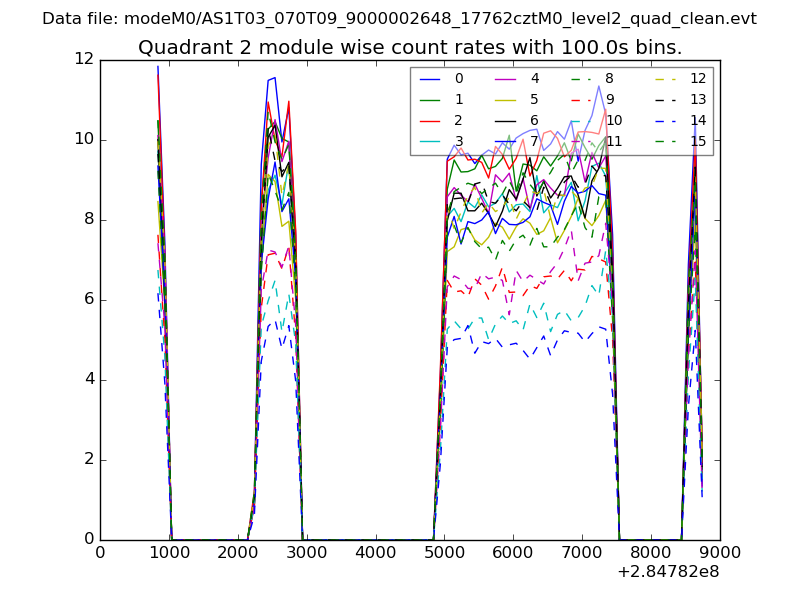
| Module-wise count rates for Quadrant B Data is divided into 100 sec bins |
 |
 |
| Module-wise count rates for Quadrant C Data is divided into 100 sec bins |
 |
 |
| Module-wise count rates for Quadrant D Data is divided into 100 sec bins |
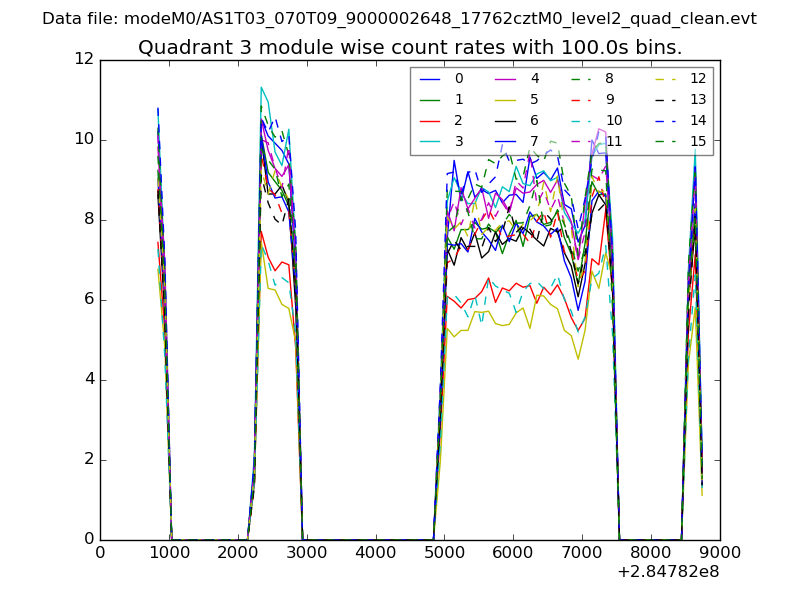 |
 |
| Parameter | Plot |
|---|---|
| CZT HV Monitor | 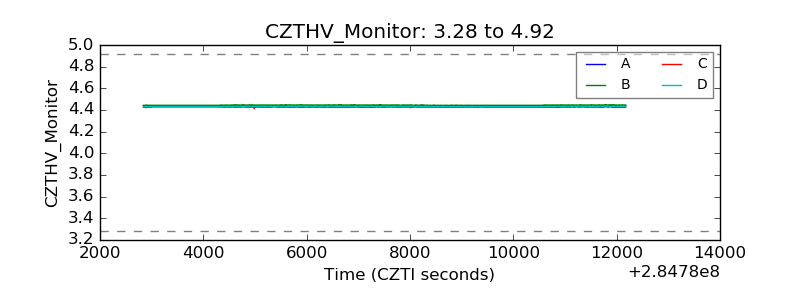 |
| D_VDD |  |
| Temperature 1 | 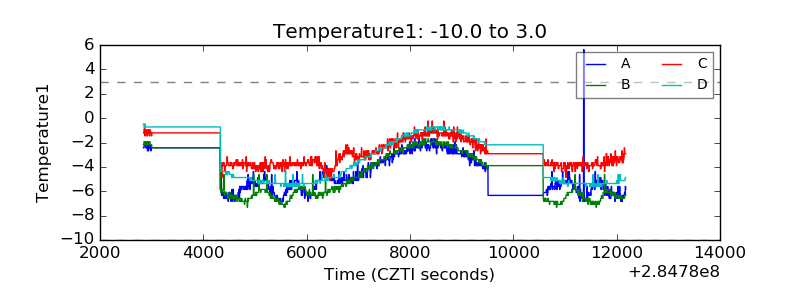 |
| Veto HV Monitor | 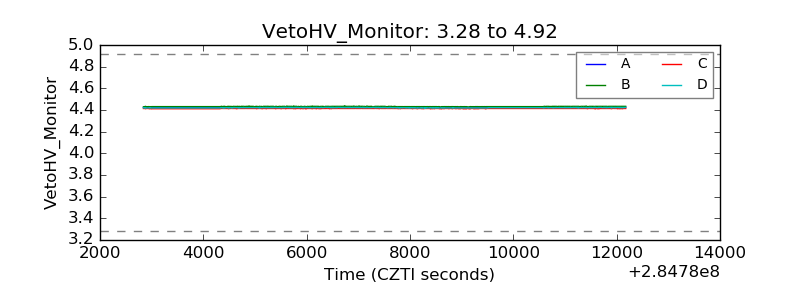 |
| Veto LLD | 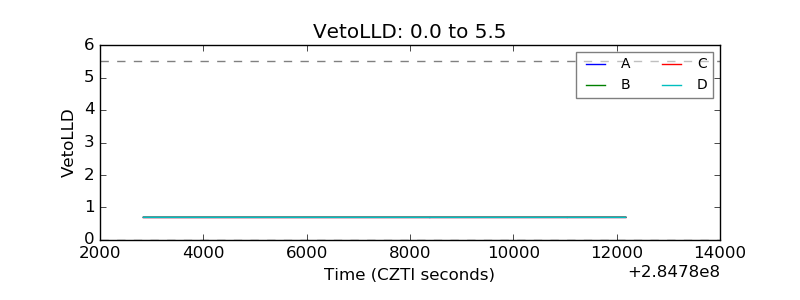 |
| Alpha Counter | 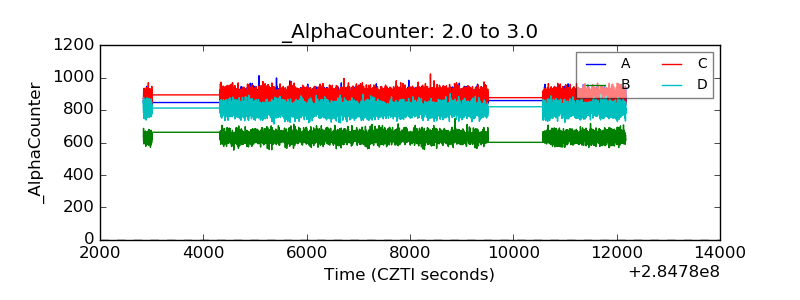 |
| _CPM_Rate | 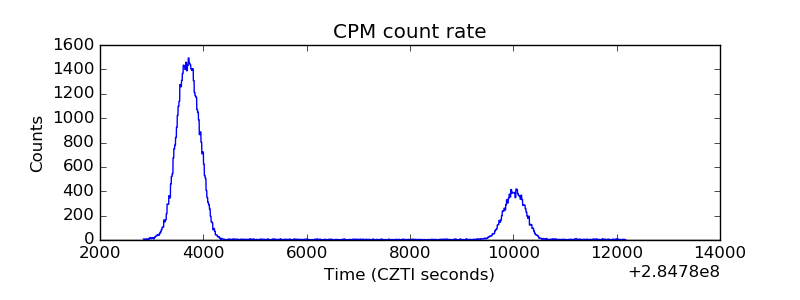 |
| CZT Counter | 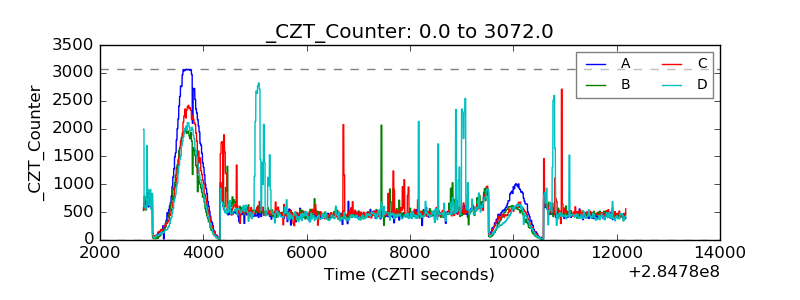 |
| +2.5 Volts monitor |  |
| +5 Volts monitor |  |
| _ROLL_ROT | 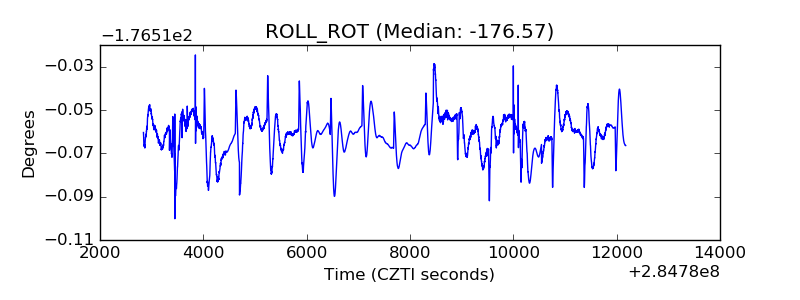 |
| _Roll_DEC | 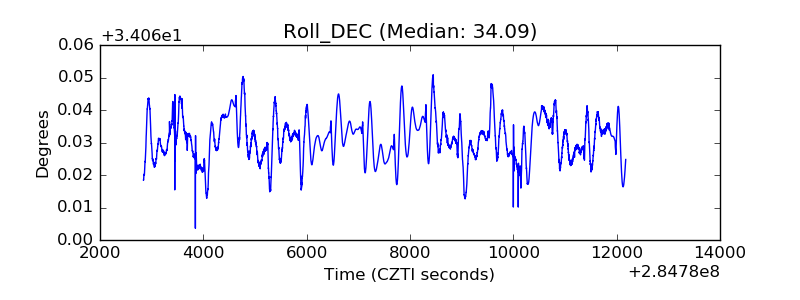 |
| _Roll_RA | 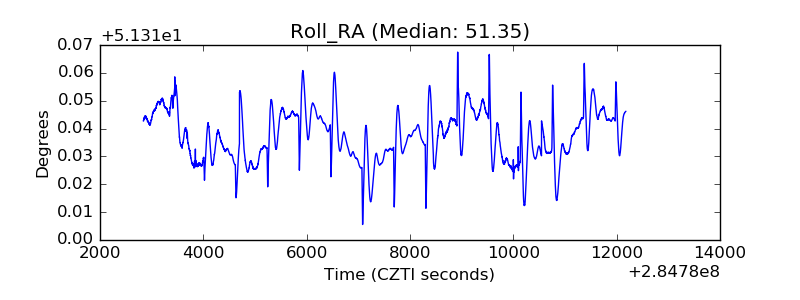 |
| Veto Counter | 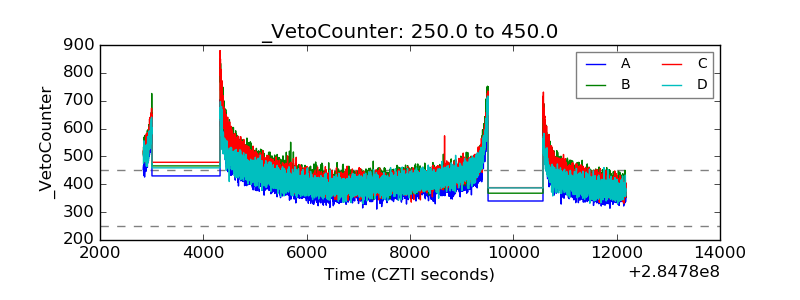 |