| Param | Original file | Final file |
|---|---|---|
| Filename | modeM0/AS1T03_070T09_9000002648_17763cztM0_level2.evt | modeM0/AS1T03_070T09_9000002648_17763cztM0_level2_quad_clean.evt |
| Size (bytes) | 504,993,600 | 74,145,600 |
| Size | 481.6 MB | 70.7 MB |
| Events in quadrant A | 3,318,029 | 447,458 |
| Events in quadrant B | 3,491,730 | 452,738 |
| Events in quadrant C | 4,120,412 | 416,557 |
| Events in quadrant D | 3,877,526 | 430,229 |
| Mode M9 | |||
|---|---|---|---|
| Quadrant | BADHDUFLAG | Total packets | Discarded packets |
| A | 0 | 16 | 0 |
| B | 0 | 16 | 0 |
| C | 0 | 16 | 0 |
| D | 0 | 16 | 0 |
| Mode SS | |||
|---|---|---|---|
| Quadrant | BADHDUFLAG | Total packets | Discarded packets |
| A | 0 | 148 | 0 |
| B | 0 | 148 | 0 |
| C | 0 | 148 | 0 |
| D | 0 | 148 | 0 |
| Mode M0 | |||
|---|---|---|---|
| Quadrant | BADHDUFLAG | Total packets | Discarded packets |
| A | 0 | 14671 | 2 |
| B | 0 | 14945 | 2 |
| C | 0 | 16812 | 2 |
| D | 0 | 16614 | 2 |
| Quadrant | Total seconds | Saturated seconds | Saturation percentage |
|---|---|---|---|
| A | 7146 | 114 | 1.595298% |
| B | 7147 | 150 | 2.098783% |
| C | 7147 | 462 | 6.464251% |
| D | 7147 | 238 | 3.330069% |
Noise dominated data is calculated using 1-second bins in cleaned event files. If a bin has >2000 counts, and if more than 50% of those come from <1% of pixels, then it is considered to be noise-dominated and hence unusable.
| Quadrant | # 1 sec bins | Bins with >0 counts | Bins with >2000 counts | High rate bins dominated by noise | Noise dominated (total time) | Noise dominated (detector-on time) | Marked lightcurve |
|---|---|---|---|---|---|---|---|
| A | 8831 | 7147 | 0 | 0 | 0.00% | 0.00% | 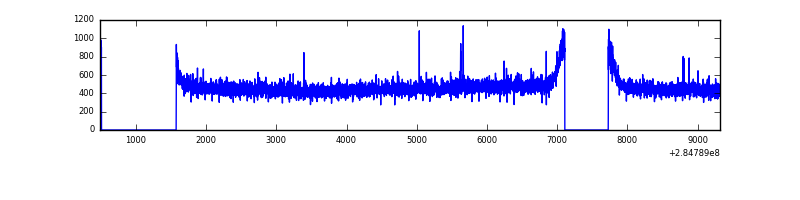 |
| B | 8832 | 7149 | 7 | 7 | 0.08% | 0.10% | 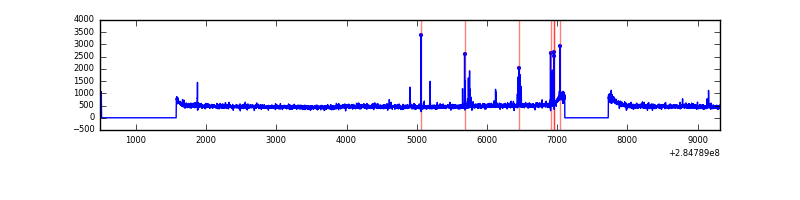 |
| C | 8832 | 7148 | 192 | 192 | 2.17% | 2.69% | 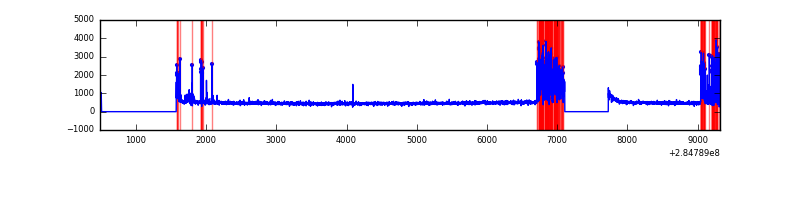 |
| D | 8832 | 7149 | 140 | 140 | 1.59% | 1.96% |  |
Top three noisy pixels from each quadrant. If the there are fewer than three noisy pixels in the level2.evt file, extra rows are filled as -1
| Pixel properties | Quadrant properties | ||||||
|---|---|---|---|---|---|---|---|
| Quadrant | DetID | PixID | Counts | Sigma | Mean | Median | Sigma |
| A | 15 | 174 | 10189 | 53.27 | 860 | 841 | 175.5 |
| A | 0 | 226 | 7363 | 37.17 | 860 | 841 | 175.5 |
| A | 3 | 137 | 6437 | 31.89 | 860 | 841 | 175.5 |
| B | 0 | 219 | 29366 | 170.87 | 865 | 842 | 166.9 |
| B | 0 | 197 | 26036 | 150.92 | 865 | 842 | 166.9 |
| B | 7 | 220 | 19945 | 114.43 | 865 | 842 | 166.9 |
| C | 4 | 254 | 757304 | 3967.03 | 809 | 814 | 190.7 |
| C | 14 | 238 | 124002 | 646.0 | 809 | 814 | 190.7 |
| C | 5 | 218 | 60519 | 313.09 | 809 | 814 | 190.7 |
| D | 7 | 238 | 439726 | 2221.75 | 827 | 806 | 197.6 |
| D | 10 | 70 | 236614 | 1193.63 | 827 | 806 | 197.6 |
| D | 7 | 38 | 35103 | 173.61 | 827 | 806 | 197.6 |
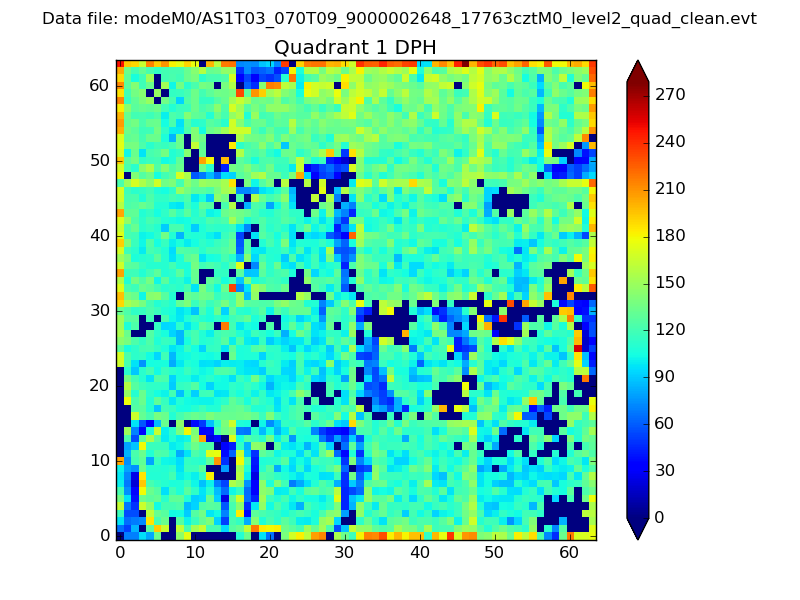
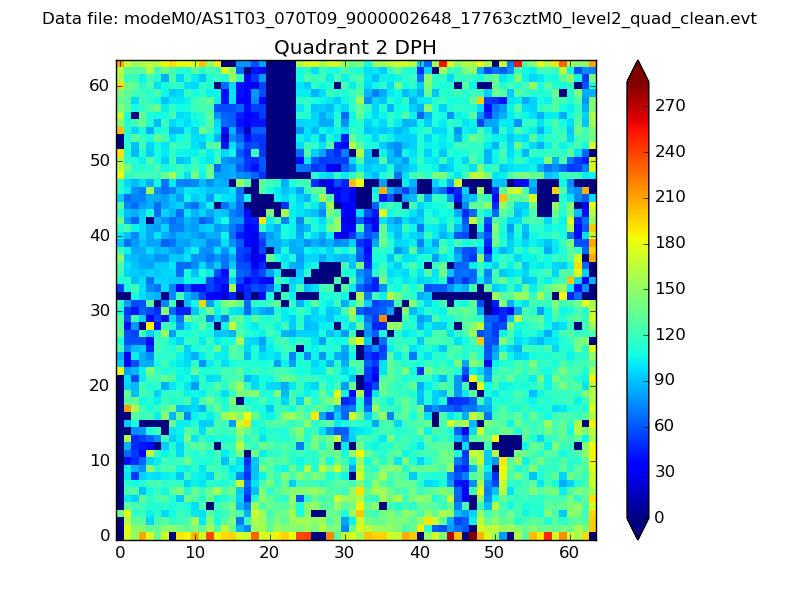
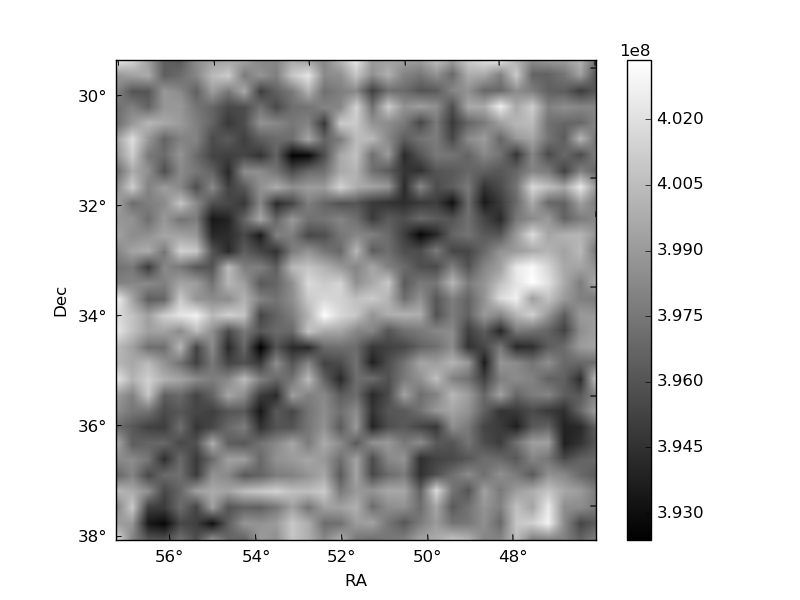
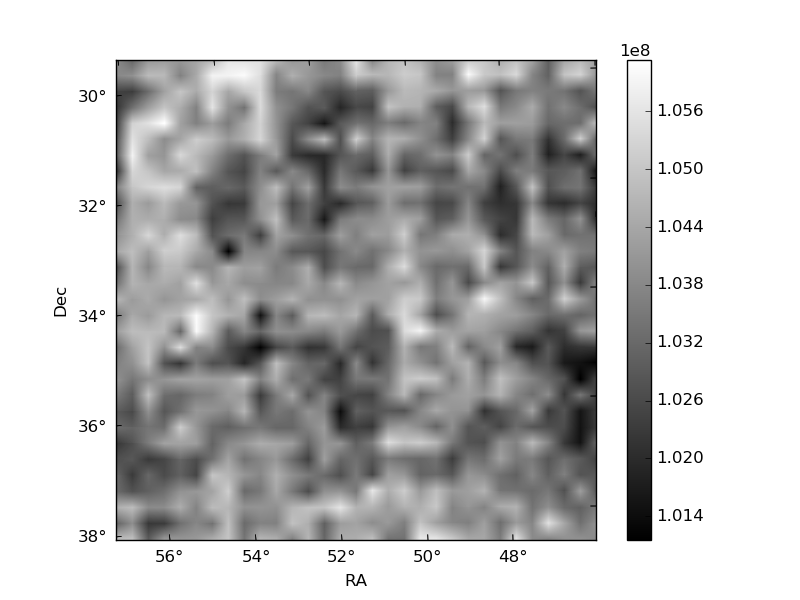
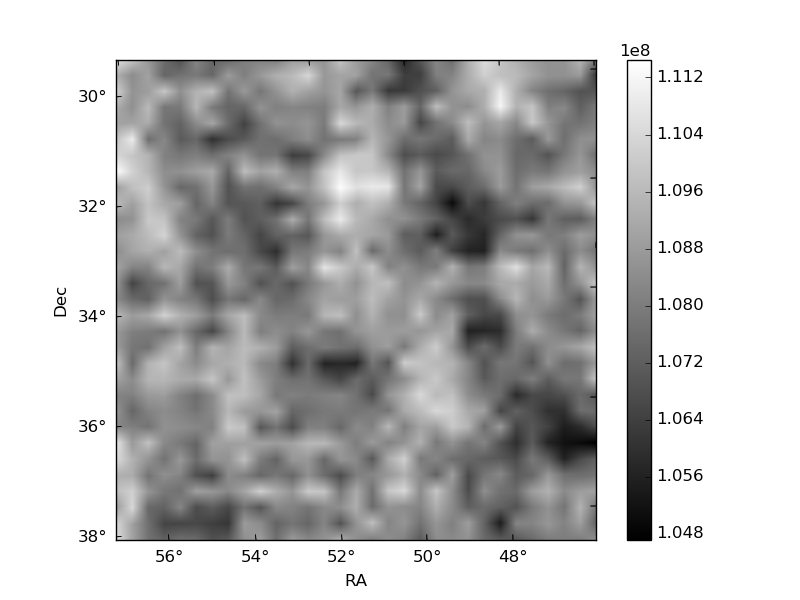
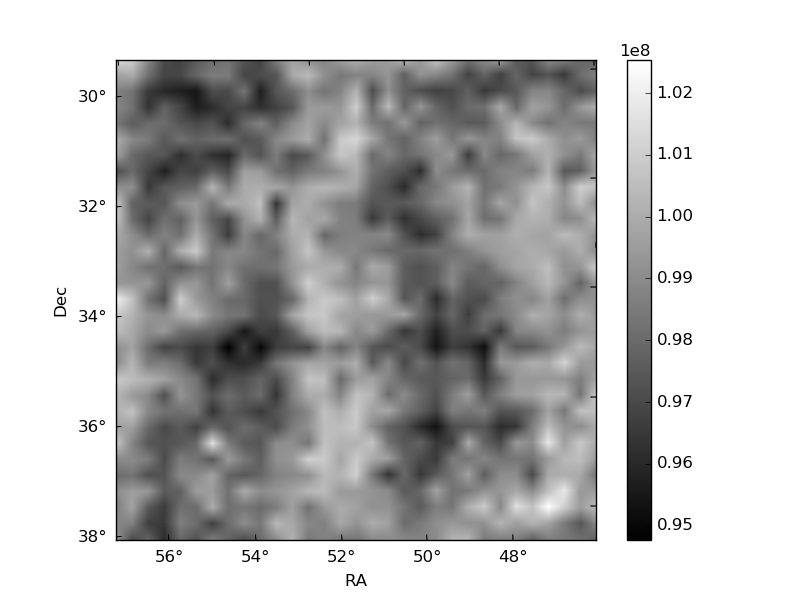
Histogram calculated using DETX and DETY for each event in the final _common_clean file
| Quadrant A | 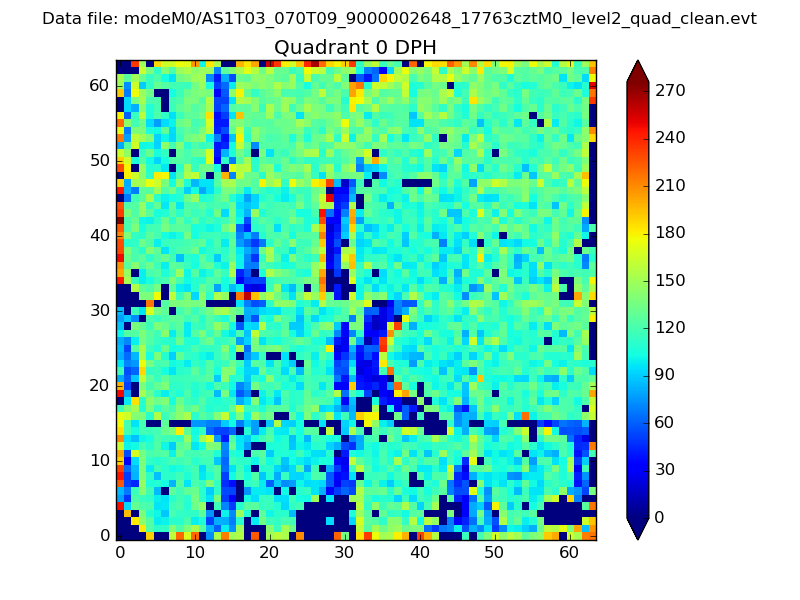 |
 |
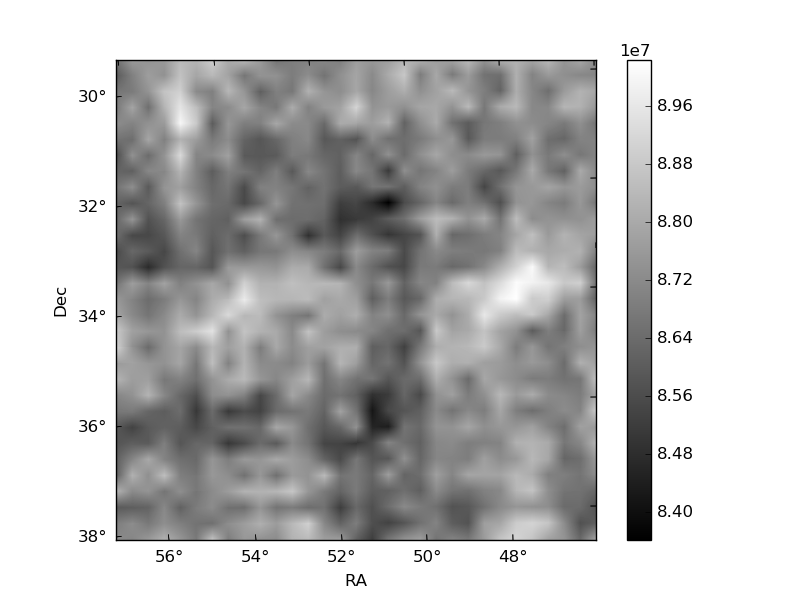
Quadrant B |
|---|---|---|---|
| Quadrant D | 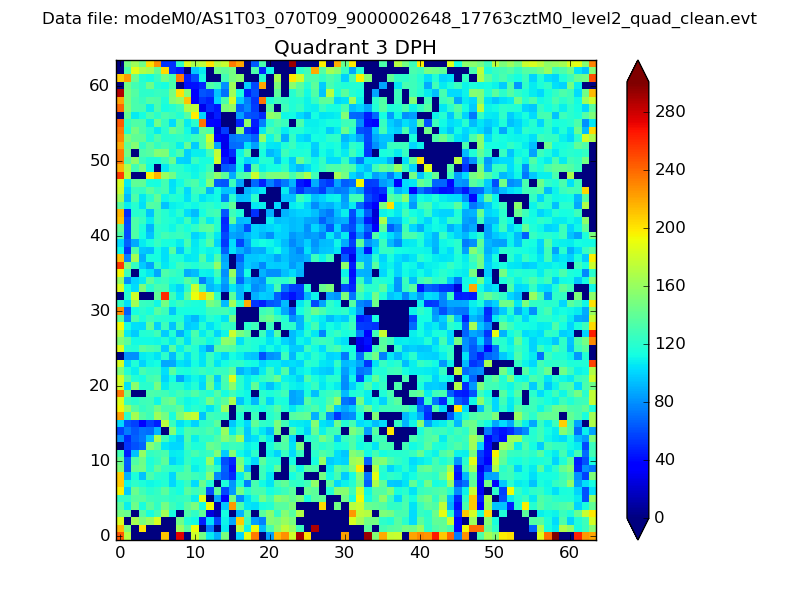 |
 |
Quadrant C |
| Plot type | Count rate plots | Images |
|---|---|---|
| Comparison with Poisson distribution Blue bars denote a histogram of data divided into 1 sec bins. Red curve is a Poisson curve with rate = median count rate of data. |
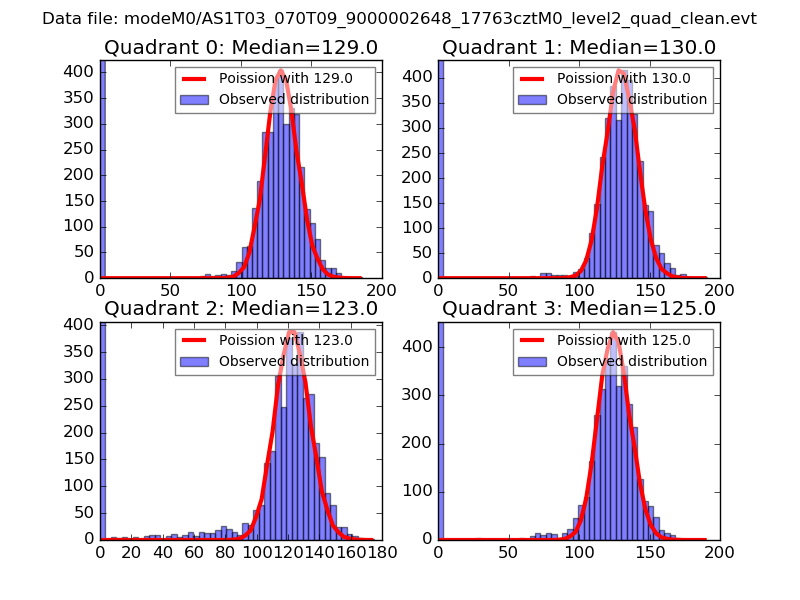 |
 |
| Quadrant-wise count rates Data is divided into 100 sec bins |
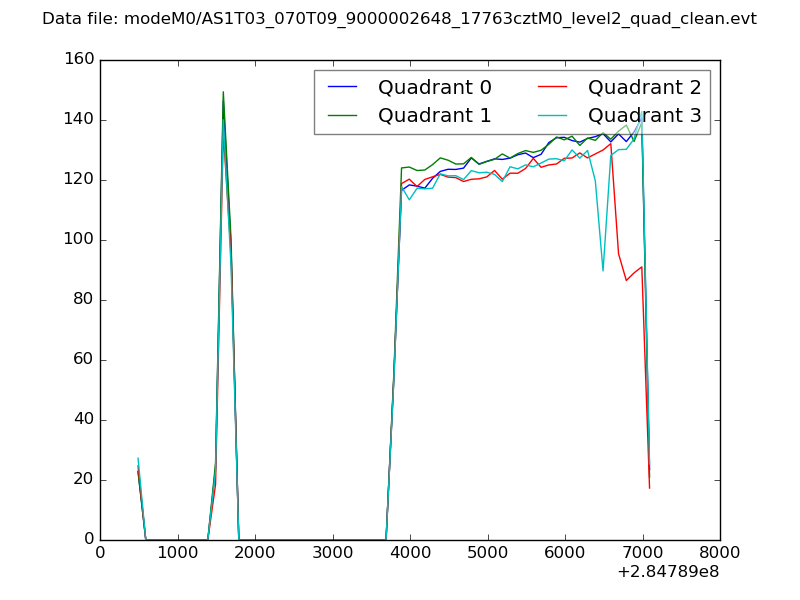 |
|
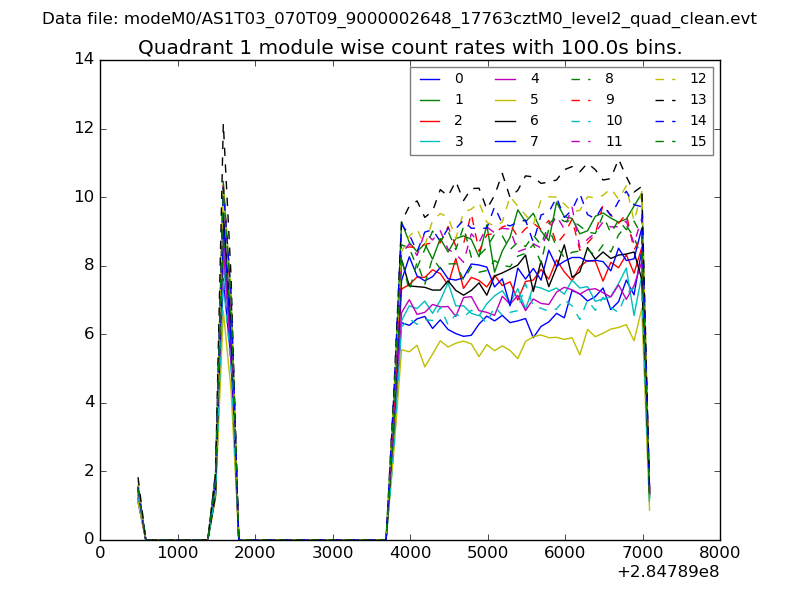
| Module-wise count rates for Quadrant A Data is divided into 100 sec bins |
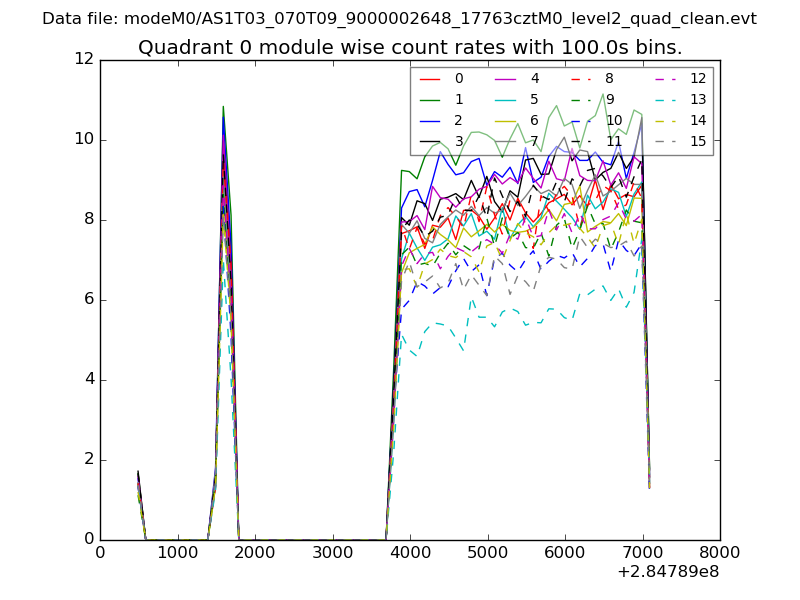 |
 |
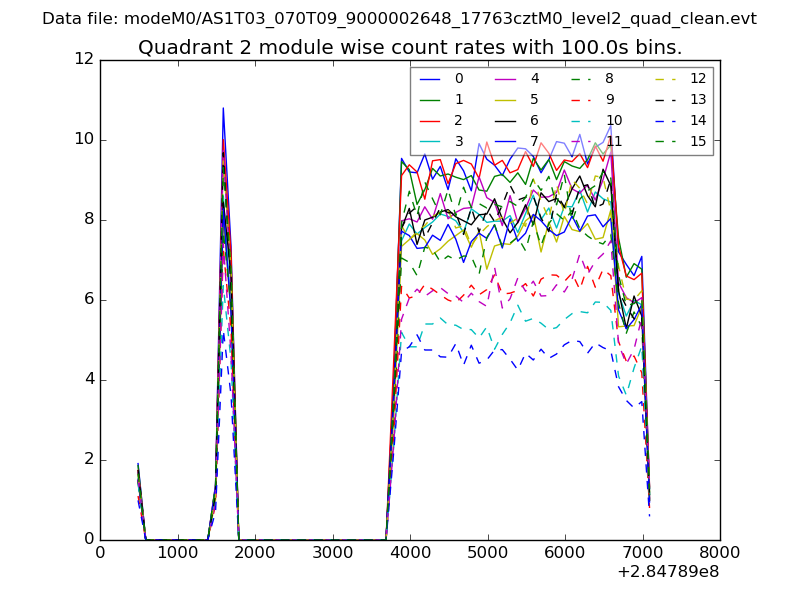
| Module-wise count rates for Quadrant B Data is divided into 100 sec bins |
 |
 |
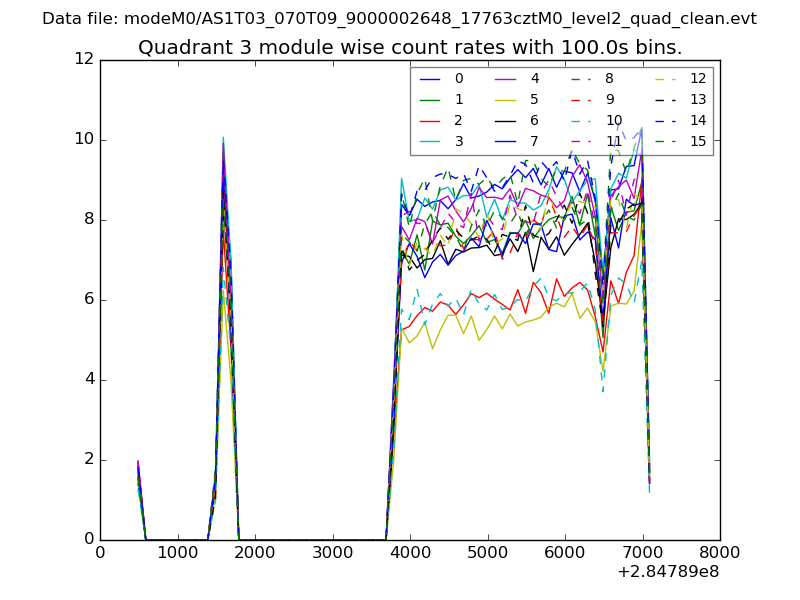
| Module-wise count rates for Quadrant C Data is divided into 100 sec bins |
 |
 |
| Module-wise count rates for Quadrant D Data is divided into 100 sec bins |
 |
 |
| Parameter | Plot |
|---|---|
| CZT HV Monitor | 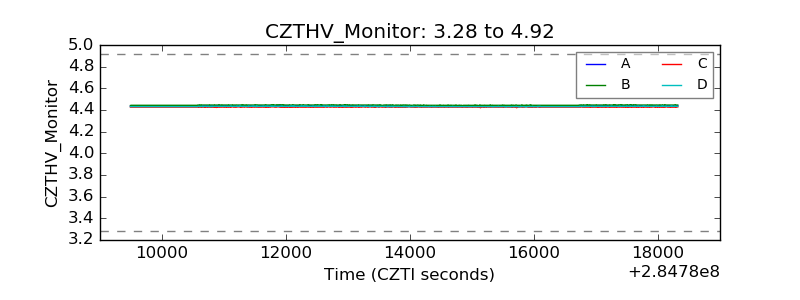 |
| D_VDD |  |
| Temperature 1 | 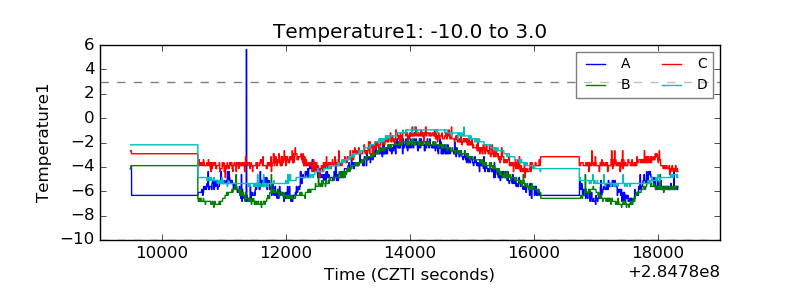 |
| Veto HV Monitor | 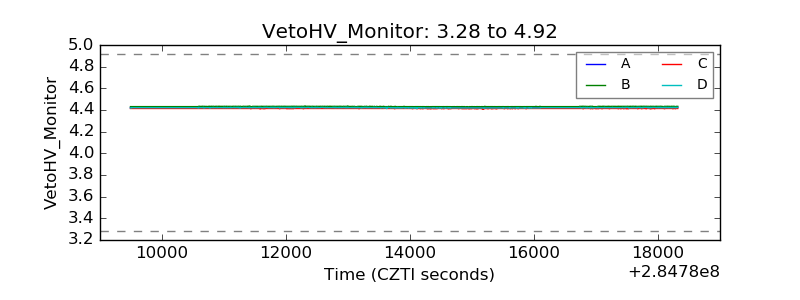 |
| Veto LLD | 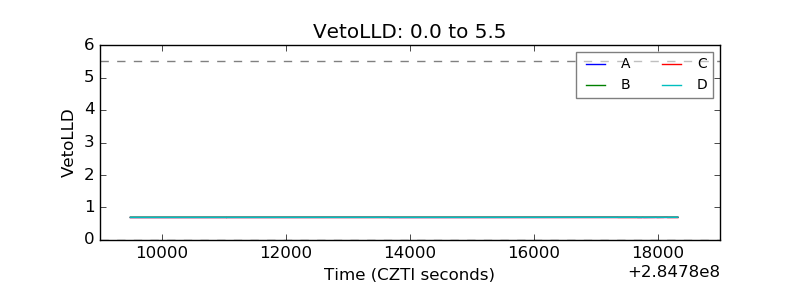 |
| Alpha Counter | 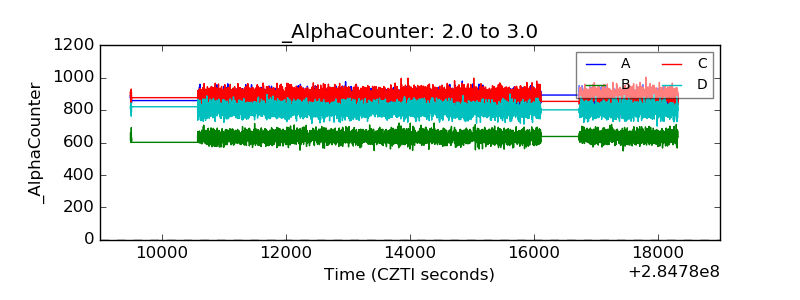 |
| _CPM_Rate | 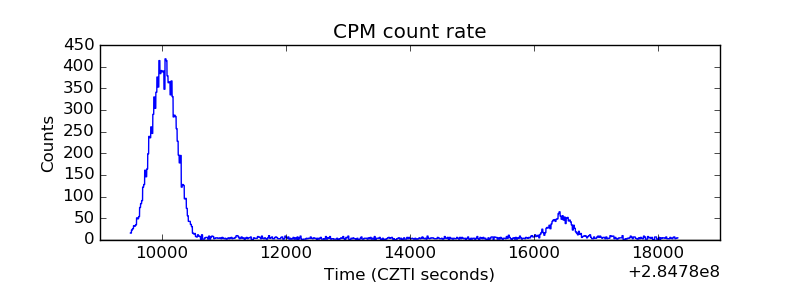 |
| CZT Counter | 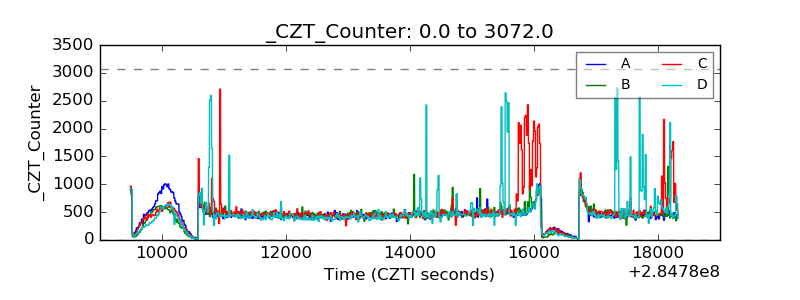 |
| +2.5 Volts monitor |  |
| +5 Volts monitor |  |
| _ROLL_ROT | 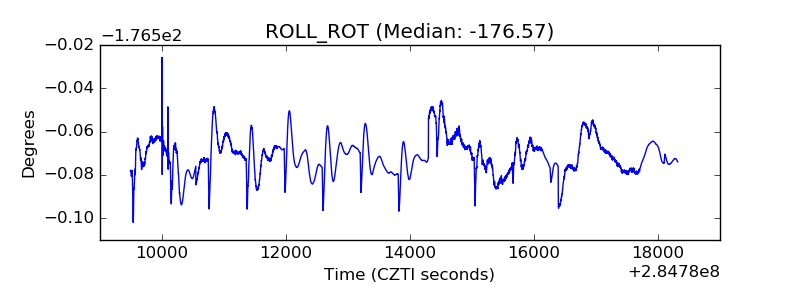 |
| _Roll_DEC | 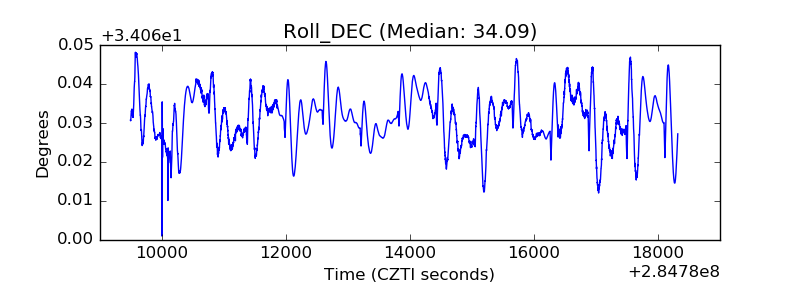 |
| _Roll_RA |  |
| Veto Counter | 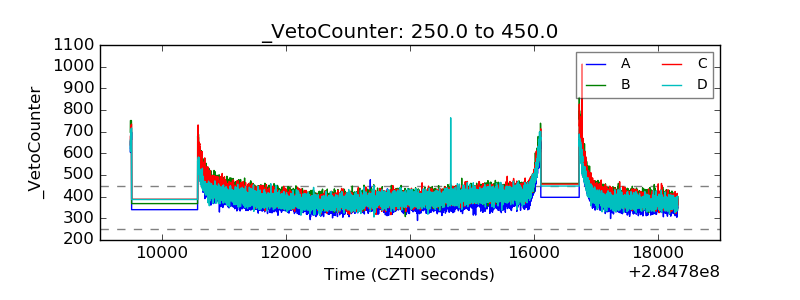 |