| Param | Original file | Final file |
|---|---|---|
| Filename | modeM0/AS1T03_070T09_9000002648_17768cztM0_level2.evt | modeM0/AS1T03_070T09_9000002648_17768cztM0_level2_quad_clean.evt |
| Size (bytes) | 222,520,320 | 48,075,840 |
| Size | 212.2 MB | 45.8 MB |
| Events in quadrant A | 1,368,555 | 313,986 |
| Events in quadrant B | 1,621,432 | 316,968 |
| Events in quadrant C | 2,082,977 | 298,019 |
| Events in quadrant D | 1,449,956 | 302,641 |
| Mode SS | |||
|---|---|---|---|
| Quadrant | BADHDUFLAG | Total packets | Discarded packets |
| A | 0 | 62 | 0 |
| B | 0 | 62 | 0 |
| C | 0 | 62 | 0 |
| D | 0 | 62 | 0 |
| Mode M0 | |||
|---|---|---|---|
| Quadrant | BADHDUFLAG | Total packets | Discarded packets |
| A | 0 | 6313 | 0 |
| B | 0 | 6978 | 0 |
| C | 0 | 8249 | 0 |
| D | 0 | 6572 | 0 |
| Quadrant | Total seconds | Saturated seconds | Saturation percentage |
|---|---|---|---|
| A | 3152 | 2 | 0.063452% |
| B | 3153 | 13 | 0.412306% |
| C | 3153 | 220 | 6.977482% |
| D | 3153 | 8 | 0.253727% |
Noise dominated data is calculated using 1-second bins in cleaned event files. If a bin has >2000 counts, and if more than 50% of those come from <1% of pixels, then it is considered to be noise-dominated and hence unusable.
| Quadrant | # 1 sec bins | Bins with >0 counts | Bins with >2000 counts | High rate bins dominated by noise | Noise dominated (total time) | Noise dominated (detector-on time) | Marked lightcurve |
|---|---|---|---|---|---|---|---|
| A | 3152 | 3152 | 0 | 0 | 0.00% | 0.00% | 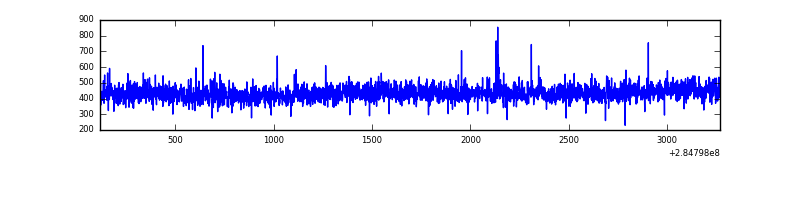 |
| B | 3153 | 3153 | 7 | 7 | 0.22% | 0.22% | 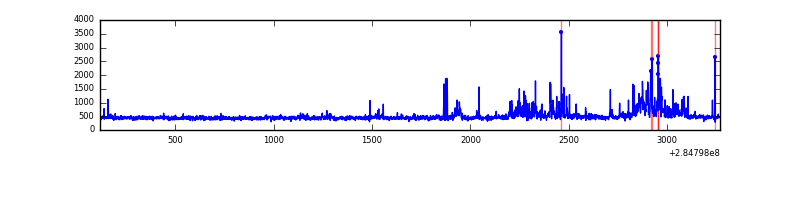 |
| C | 3153 | 3153 | 165 | 165 | 5.23% | 5.23% | 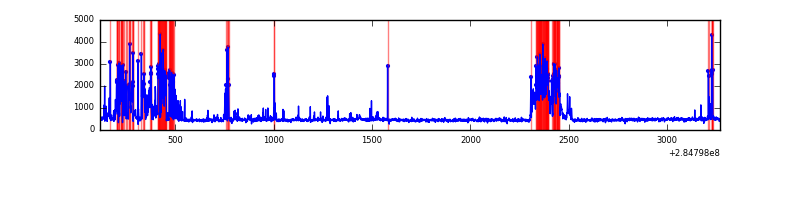 |
| D | 3153 | 3153 | 10 | 10 | 0.32% | 0.32% | 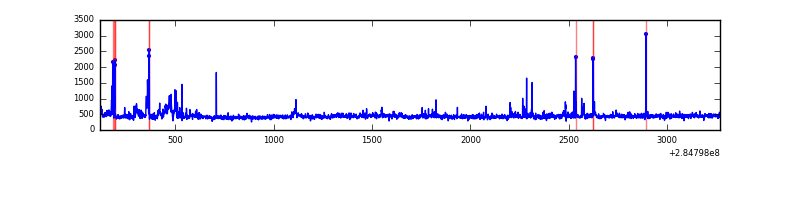 |
Top three noisy pixels from each quadrant. If the there are fewer than three noisy pixels in the level2.evt file, extra rows are filled as -1
| Pixel properties | Quadrant properties | ||||||
|---|---|---|---|---|---|---|---|
| Quadrant | DetID | PixID | Counts | Sigma | Mean | Median | Sigma |
| A | 15 | 174 | 4832 | 61.13 | 354 | 347 | 73.4 |
| A | 0 | 226 | 3198 | 38.86 | 354 | 347 | 73.4 |
| A | 12 | 194 | 2660 | 31.52 | 354 | 347 | 73.4 |
| B | 10 | 245 | 93185 | 1375.17 | 351 | 343 | 67.5 |
| B | 7 | 220 | 73653 | 1085.86 | 351 | 343 | 67.5 |
| B | 4 | 142 | 32626 | 478.17 | 351 | 343 | 67.5 |
| C | 4 | 254 | 694390 | 8948.69 | 328 | 331 | 77.6 |
| C | 14 | 238 | 51006 | 653.37 | 328 | 331 | 77.6 |
| C | 5 | 218 | 27614 | 351.77 | 328 | 331 | 77.6 |
| D | 7 | 238 | 91229 | 1098.01 | 342 | 334 | 82.8 |
| D | 2 | 152 | 22517 | 267.97 | 342 | 334 | 82.8 |
| D | 2 | 165 | 15375 | 181.7 | 342 | 334 | 82.8 |
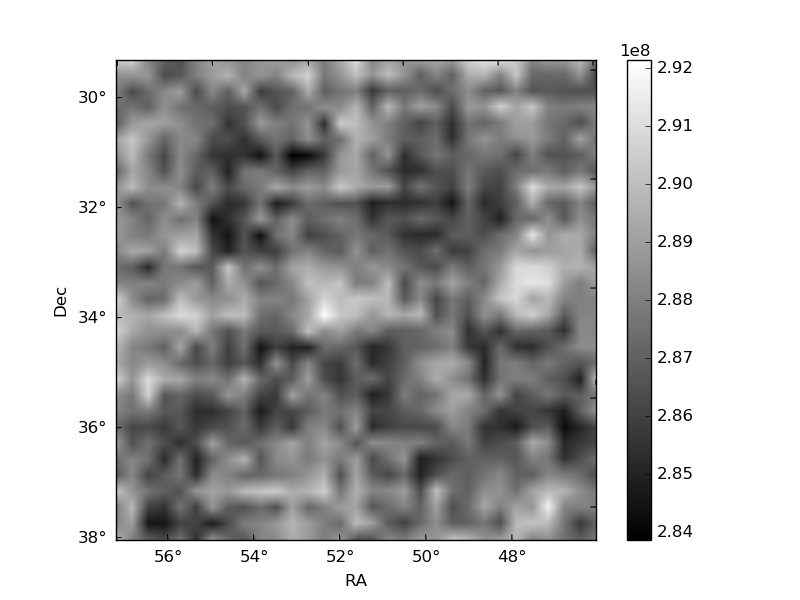
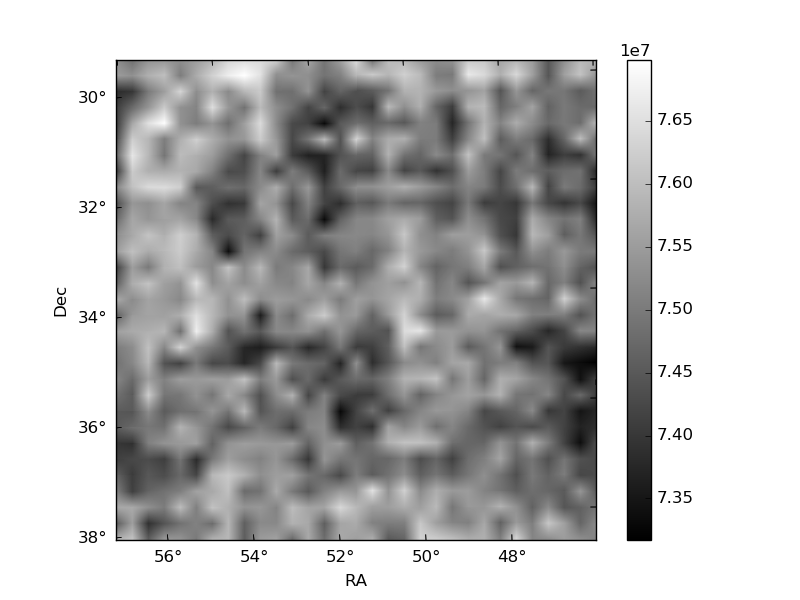
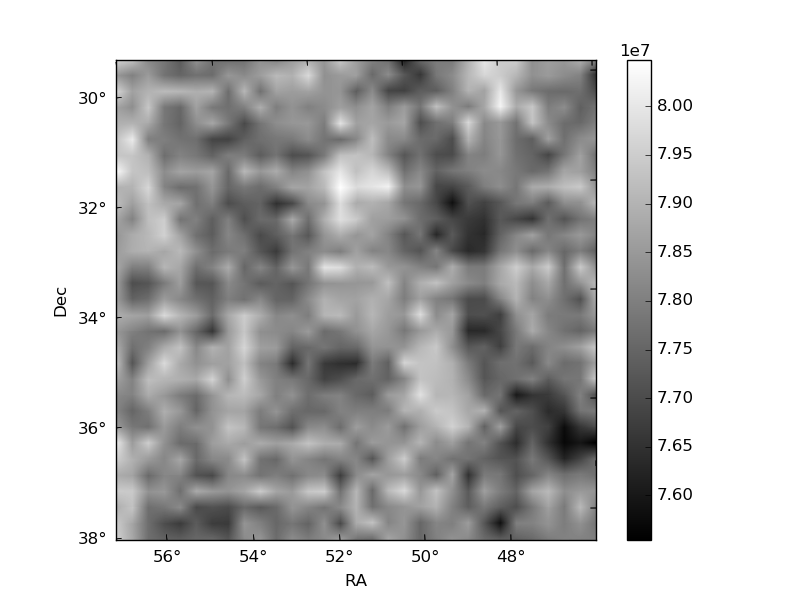
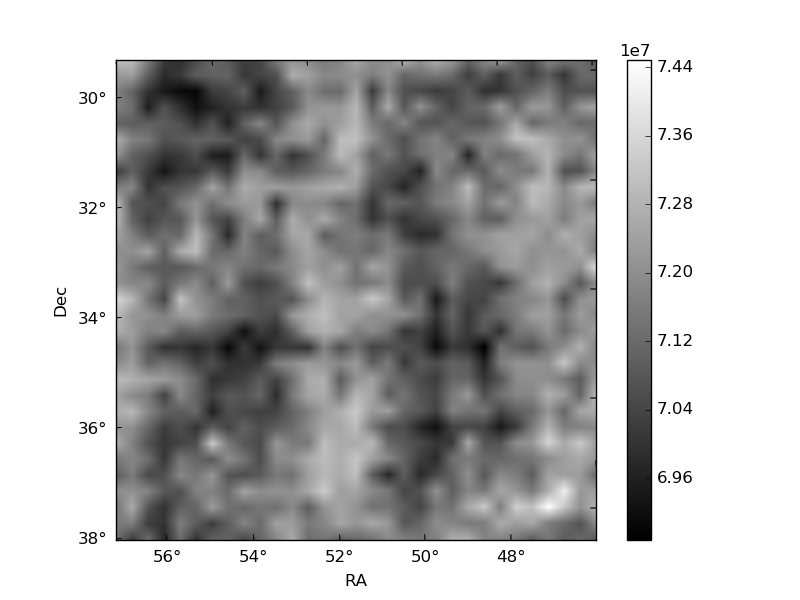
Histogram calculated using DETX and DETY for each event in the final _common_clean file
| Quadrant A | 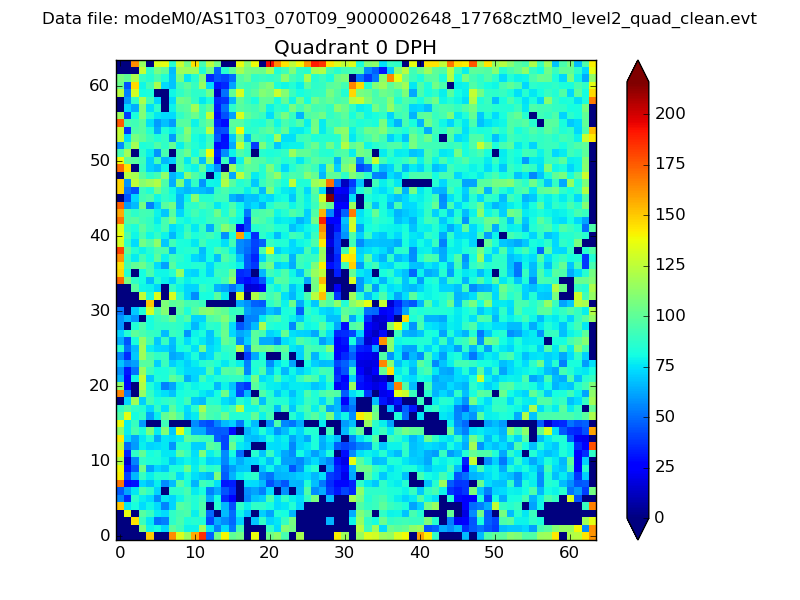 |
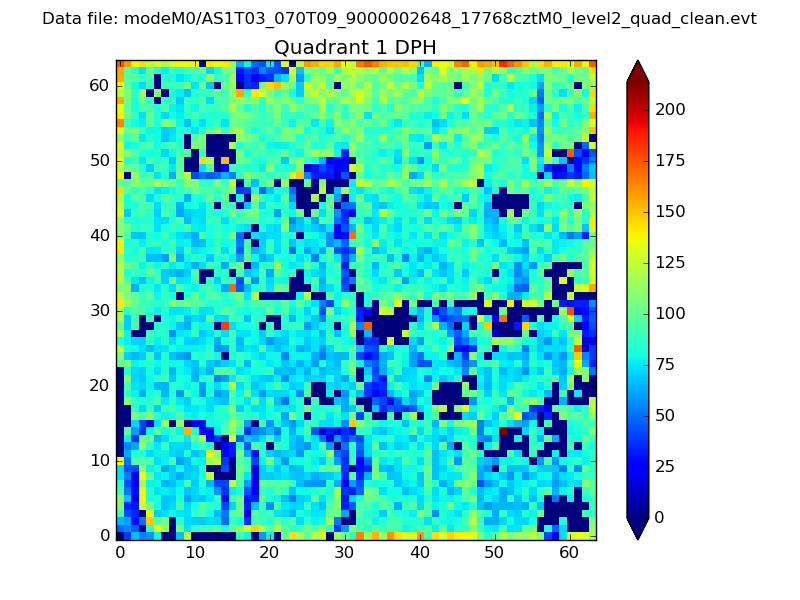 |
Quadrant B |
|---|---|---|---|
| Quadrant D | 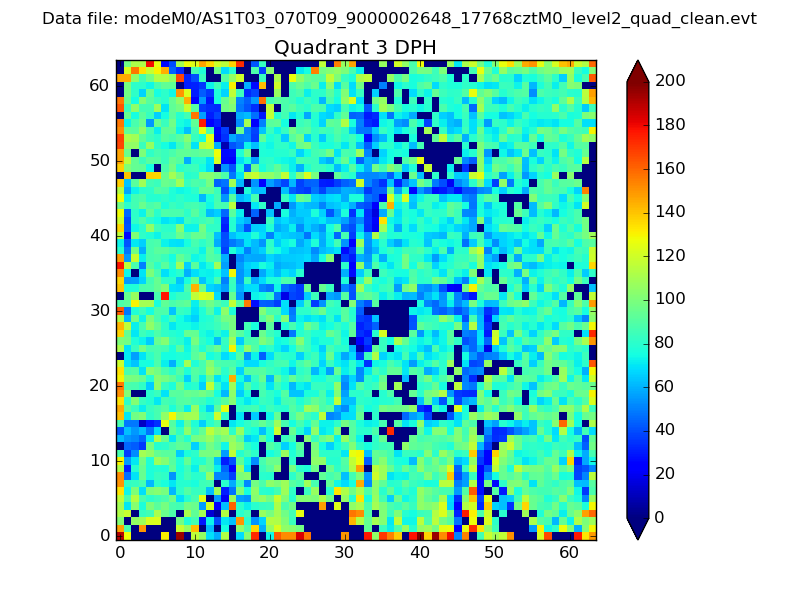 |
 |
Quadrant C |
| Plot type | Count rate plots | Images |
|---|---|---|
| Comparison with Poisson distribution Blue bars denote a histogram of data divided into 1 sec bins. Red curve is a Poisson curve with rate = median count rate of data. |
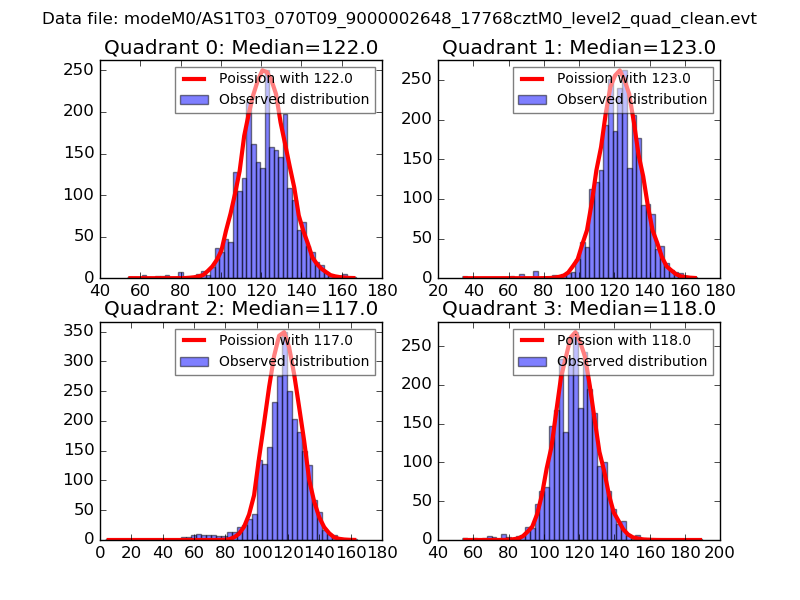 |
 |
| Quadrant-wise count rates Data is divided into 100 sec bins |
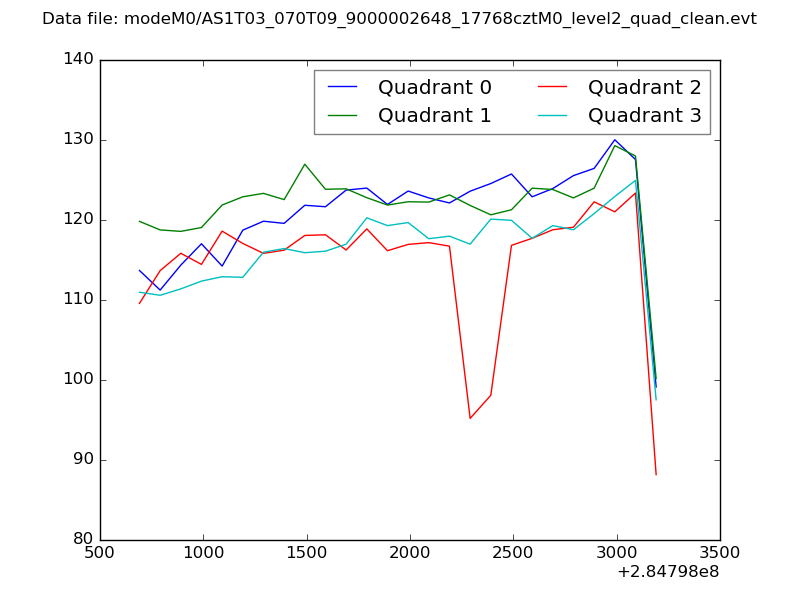 |
|
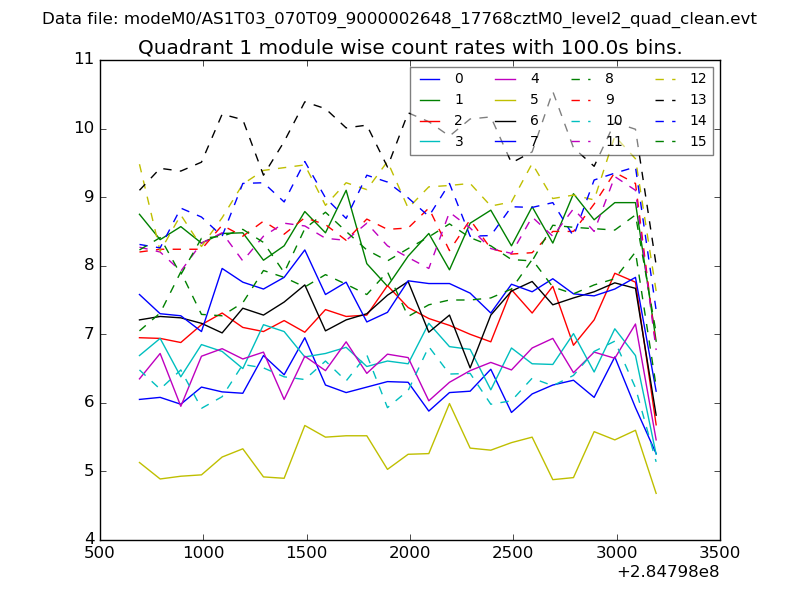
| Module-wise count rates for Quadrant A Data is divided into 100 sec bins |
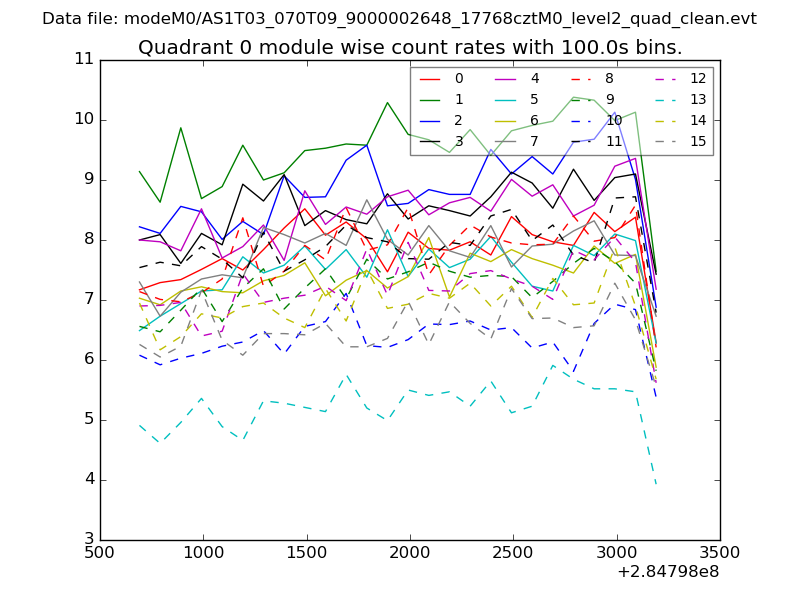 |
 |
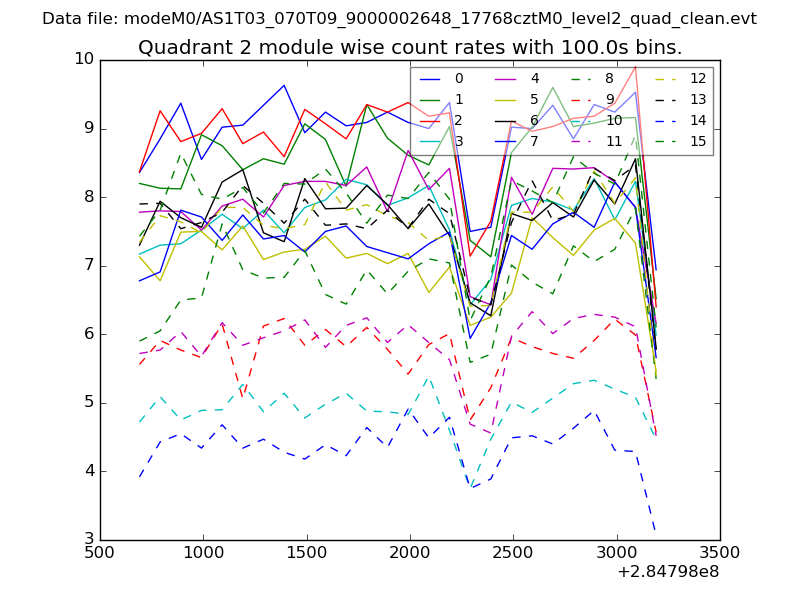
| Module-wise count rates for Quadrant B Data is divided into 100 sec bins |
 |
 |
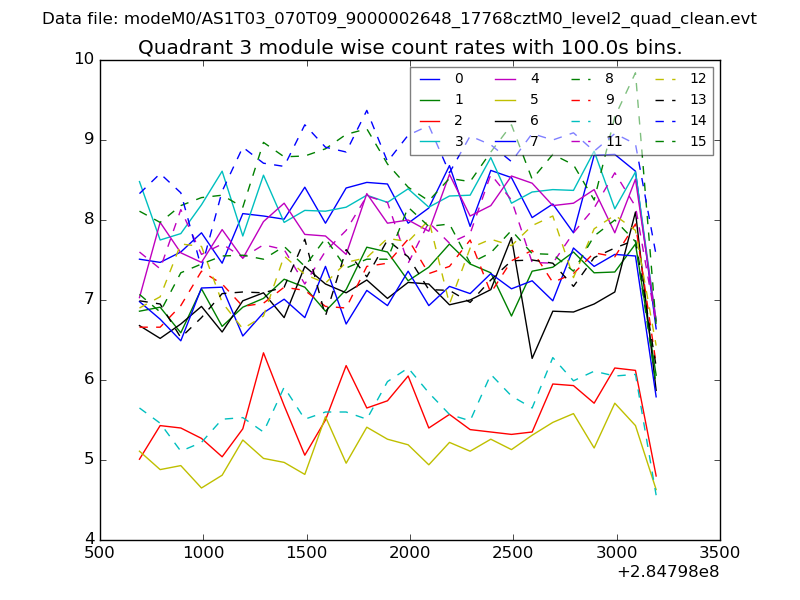
| Module-wise count rates for Quadrant C Data is divided into 100 sec bins |
 |
 |
| Module-wise count rates for Quadrant D Data is divided into 100 sec bins |
 |
 |
| Parameter | Plot |
|---|---|
| CZT HV Monitor | 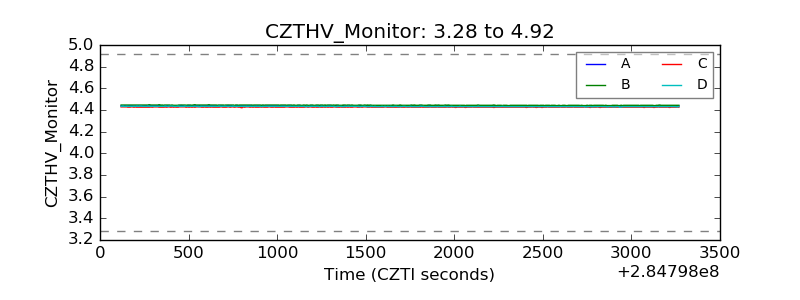 |
| D_VDD | 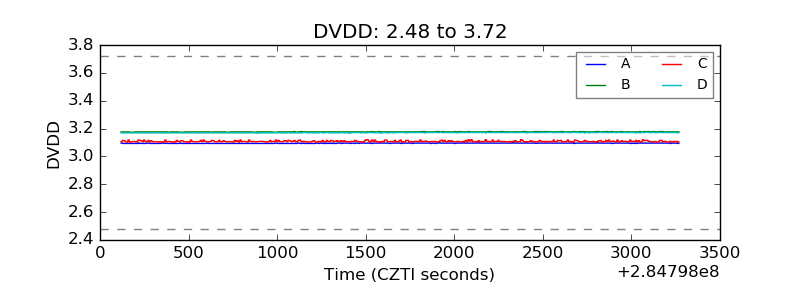 |
| Temperature 1 | 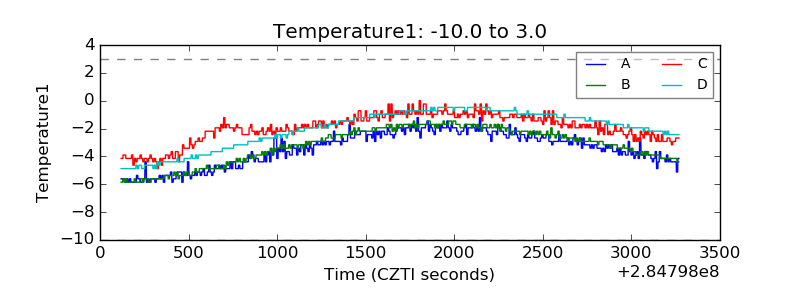 |
| Veto HV Monitor | 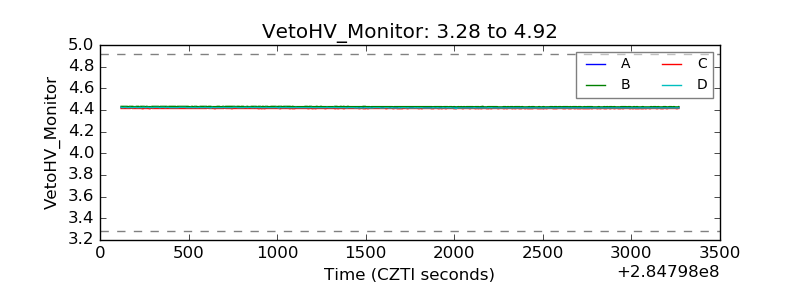 |
| Veto LLD | 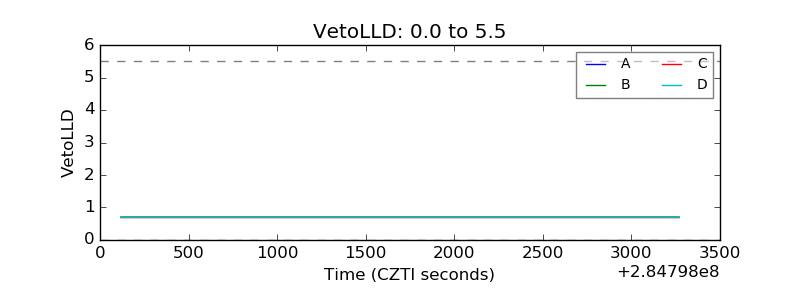 |
| Alpha Counter | 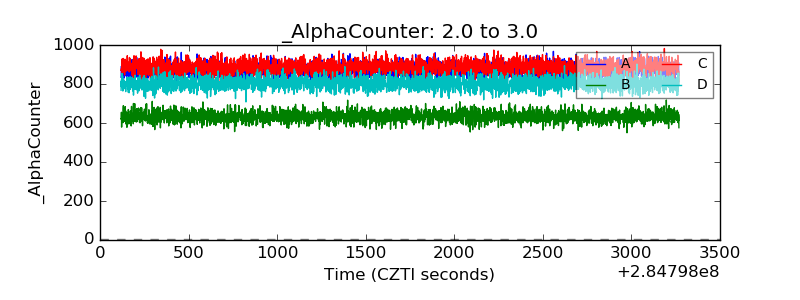 |
| _CPM_Rate | 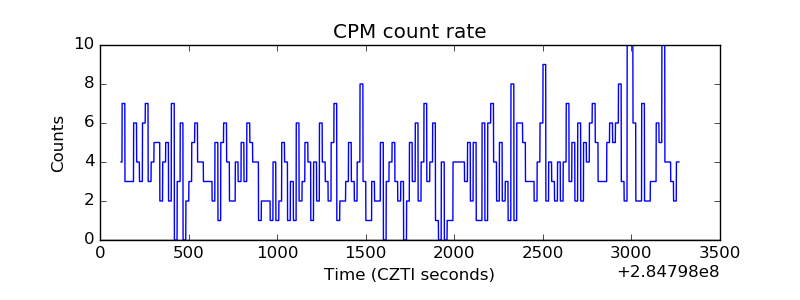 |
| CZT Counter | 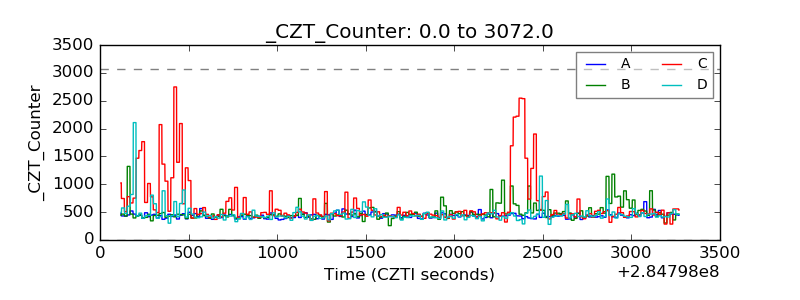 |
| +2.5 Volts monitor |  |
| +5 Volts monitor |  |
| _ROLL_ROT | 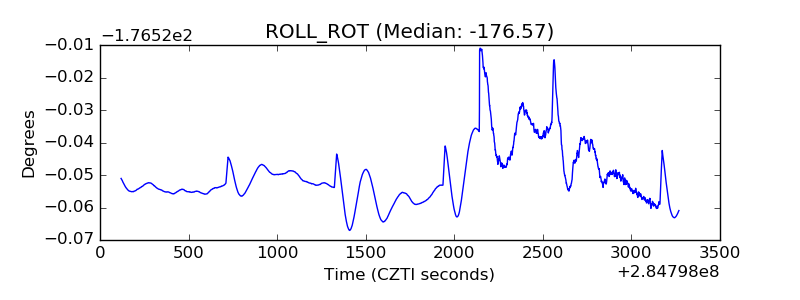 |
| _Roll_DEC | 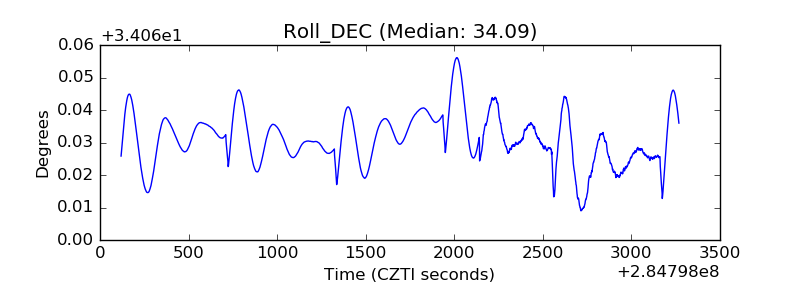 |
| _Roll_RA | 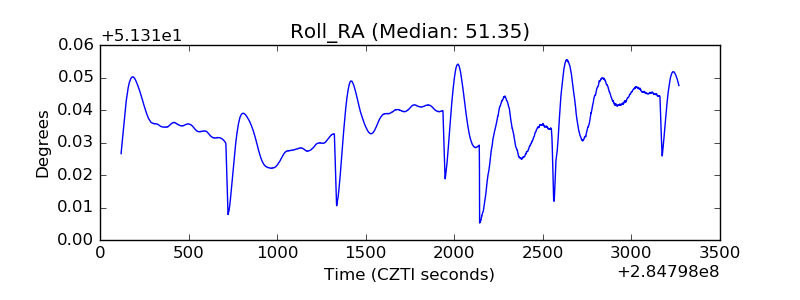 |
| Veto Counter | 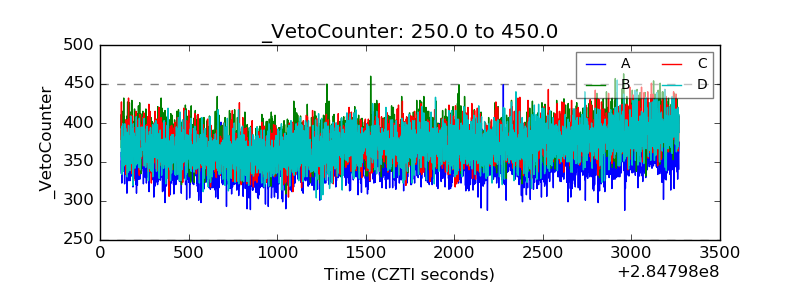 |