| Param | Original file | Final file |
|---|---|---|
| Filename | modeM0/AS1A05_025T04_9000002652_17831cztM0_level2.evt | modeM0/AS1A05_025T04_9000002652_17831cztM0_level2_quad_clean.evt |
| Size (bytes) | 158,869,440 | 31,207,680 |
| Size | 151.5 MB | 29.8 MB |
| Events in quadrant A | 1,126,996 | 200,219 |
| Events in quadrant B | 1,227,181 | 207,328 |
| Events in quadrant C | 1,152,656 | 196,729 |
| Events in quadrant D | 1,160,168 | 188,757 |
| Mode SS | |||
|---|---|---|---|
| Quadrant | BADHDUFLAG | Total packets | Discarded packets |
| A | 0 | 44 | 0 |
| B | 0 | 44 | 0 |
| C | 0 | 44 | 0 |
| D | 0 | 44 | 0 |
| Mode M0 | |||
|---|---|---|---|
| Quadrant | BADHDUFLAG | Total packets | Discarded packets |
| A | 0 | 4577 | 2 |
| B | 0 | 4916 | 1 |
| C | 0 | 4636 | 1 |
| D | 0 | 4689 | 1 |
| Mode M9 | |||
|---|---|---|---|
| Quadrant | BADHDUFLAG | Total packets | Discarded packets |
| A | 0 | 13 | 0 |
| B | 0 | 13 | 0 |
| C | 0 | 13 | 0 |
| D | 0 | 13 | 0 |
| Quadrant | Total seconds | Saturated seconds | Saturation percentage |
|---|---|---|---|
| A | 2088 | 17 | 0.814176% |
| B | 2088 | 28 | 1.340996% |
| C | 2088 | 39 | 1.867816% |
| D | 2088 | 30 | 1.436782% |
Noise dominated data is calculated using 1-second bins in cleaned event files. If a bin has >2000 counts, and if more than 50% of those come from <1% of pixels, then it is considered to be noise-dominated and hence unusable.
| Quadrant | # 1 sec bins | Bins with >0 counts | Bins with >2000 counts | High rate bins dominated by noise | Noise dominated (total time) | Noise dominated (detector-on time) | Marked lightcurve |
|---|---|---|---|---|---|---|---|
| A | 3413 | 2089 | 0 | 0 | 0.00% | 0.00% | 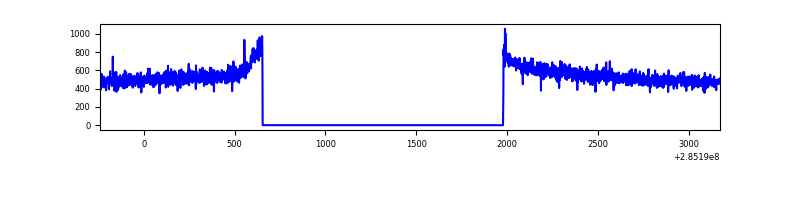 |
| B | 3413 | 2089 | 3 | 3 | 0.09% | 0.14% | 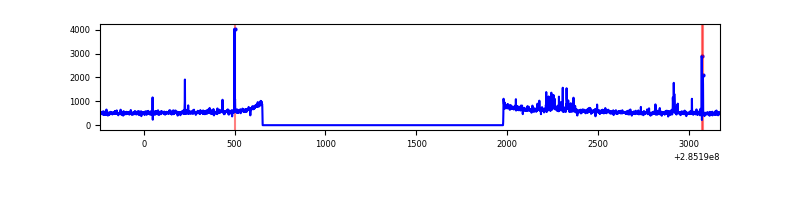 |
| C | 3413 | 2089 | 0 | 0 | 0.00% | 0.00% | 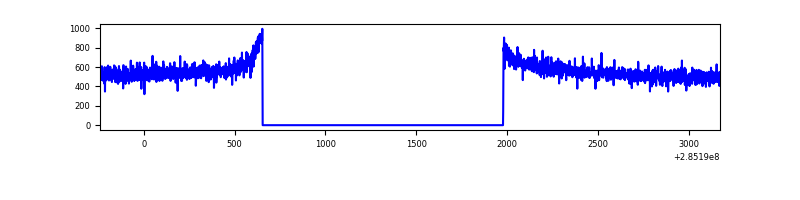 |
| D | 3413 | 2089 | 5 | 5 | 0.15% | 0.24% | 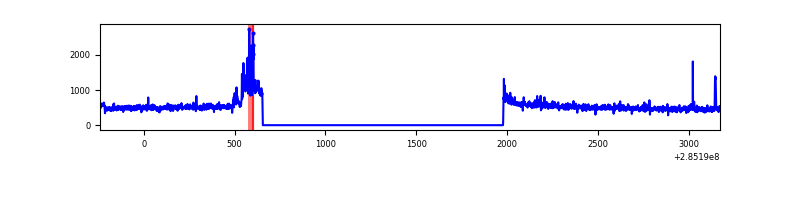 |
Top three noisy pixels from each quadrant. If the there are fewer than three noisy pixels in the level2.evt file, extra rows are filled as -1
| Pixel properties | Quadrant properties | ||||||
|---|---|---|---|---|---|---|---|
| Quadrant | DetID | PixID | Counts | Sigma | Mean | Median | Sigma |
| A | 15 | 174 | 3074 | 46.53 | 292 | 286 | 59.9 |
| A | 0 | 226 | 2561 | 37.97 | 292 | 286 | 59.9 |
| A | 3 | 137 | 2204 | 32.01 | 292 | 286 | 59.9 |
| B | 0 | 189 | 18395 | 314.54 | 296 | 290 | 57.6 |
| B | 4 | 171 | 16390 | 279.71 | 296 | 290 | 57.6 |
| B | 10 | 245 | 16082 | 274.36 | 296 | 290 | 57.6 |
| C | 14 | 238 | 44313 | 660.92 | 281 | 283 | 66.6 |
| C | 5 | 218 | 10437 | 152.42 | 281 | 283 | 66.6 |
| C | 13 | 61 | 1925 | 24.65 | 281 | 283 | 66.6 |
| D | 10 | 70 | 57753 | 798.52 | 280 | 273 | 72.0 |
| D | 7 | 238 | 19217 | 263.17 | 280 | 273 | 72.0 |
| D | 2 | 234 | 7801 | 104.57 | 280 | 273 | 72.0 |
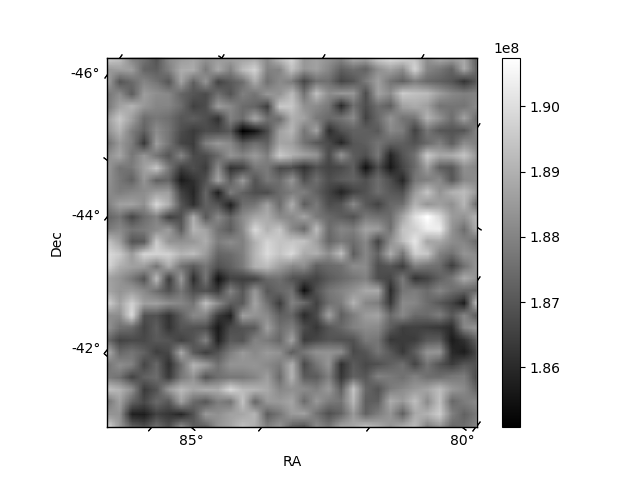
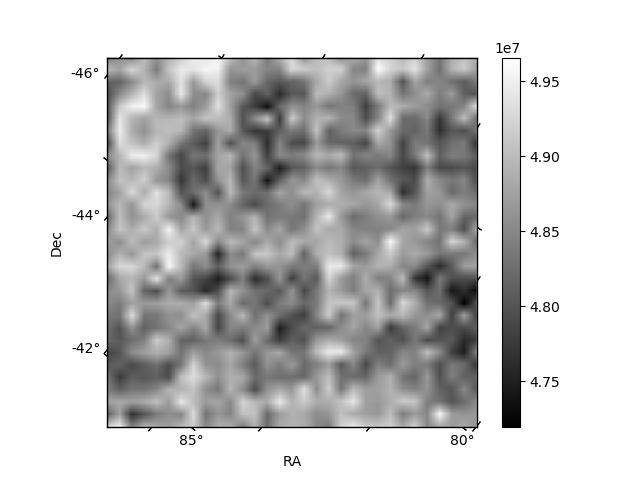
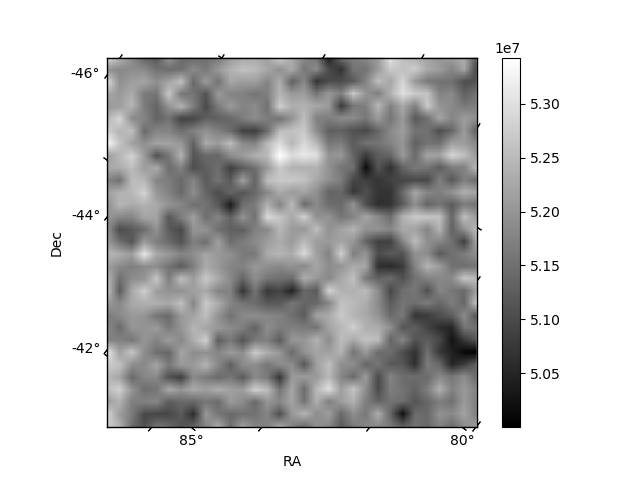
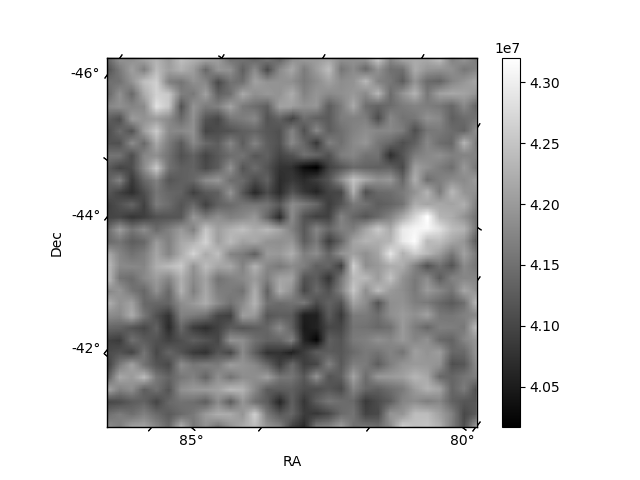
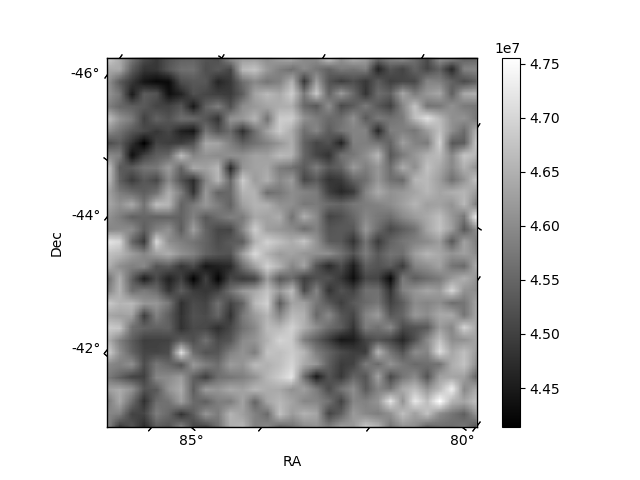
Histogram calculated using DETX and DETY for each event in the final _common_clean file
| Quadrant A | 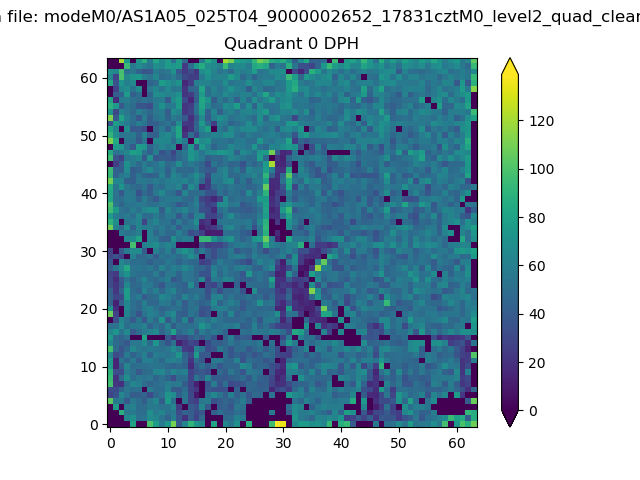 |
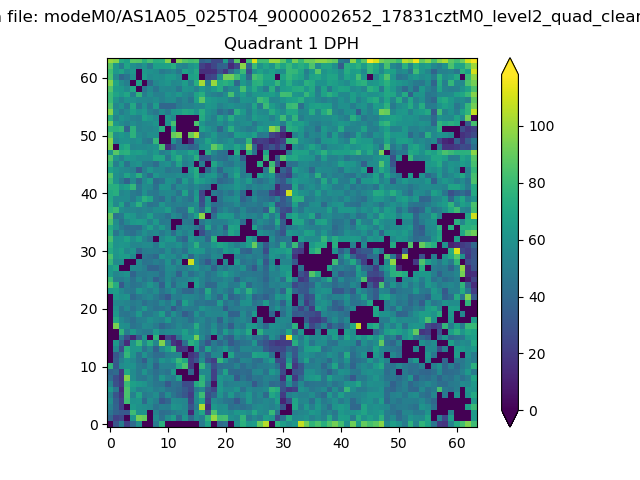 |
Quadrant B |
|---|---|---|---|
| Quadrant D | 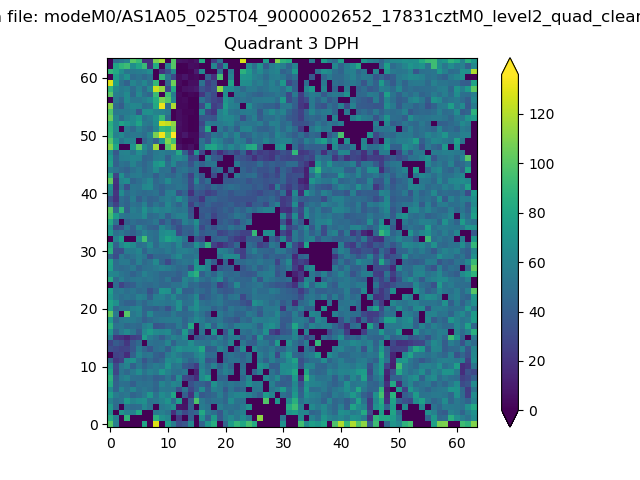 |
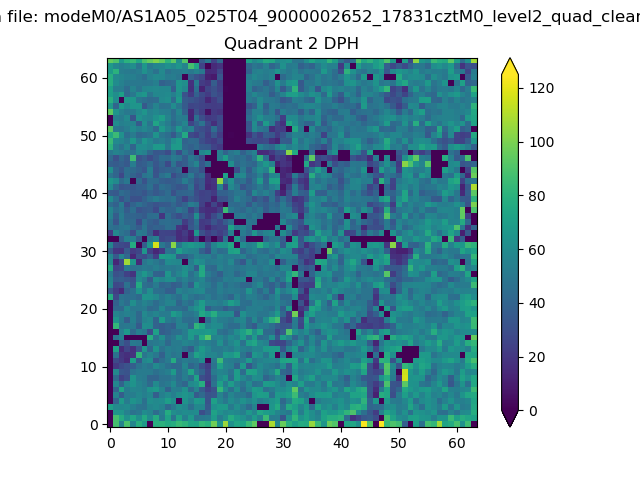 |
Quadrant C |
| Plot type | Count rate plots | Images |
|---|---|---|
| Comparison with Poisson distribution Blue bars denote a histogram of data divided into 1 sec bins. Red curve is a Poisson curve with rate = median count rate of data. |
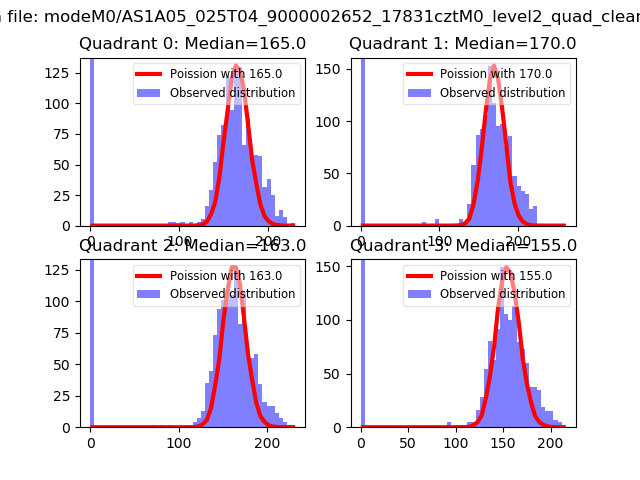 |
 |
| Quadrant-wise count rates Data is divided into 100 sec bins |
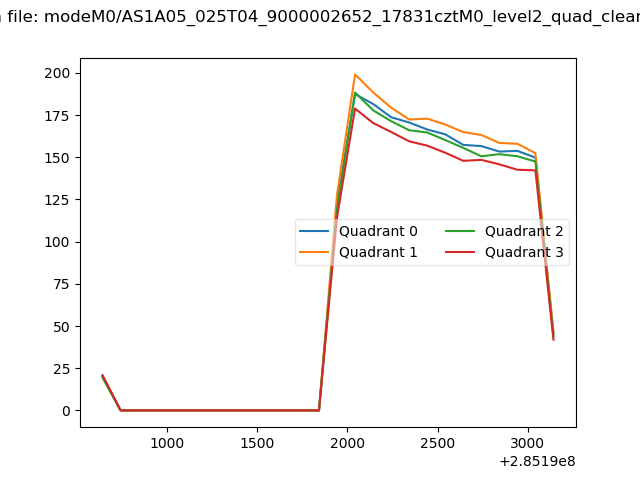 |
|
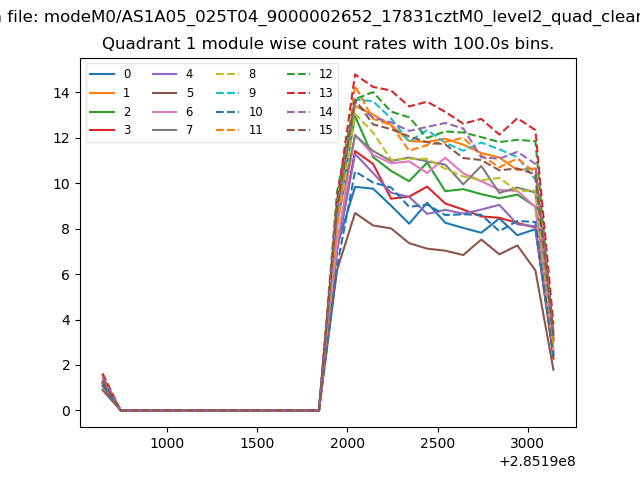
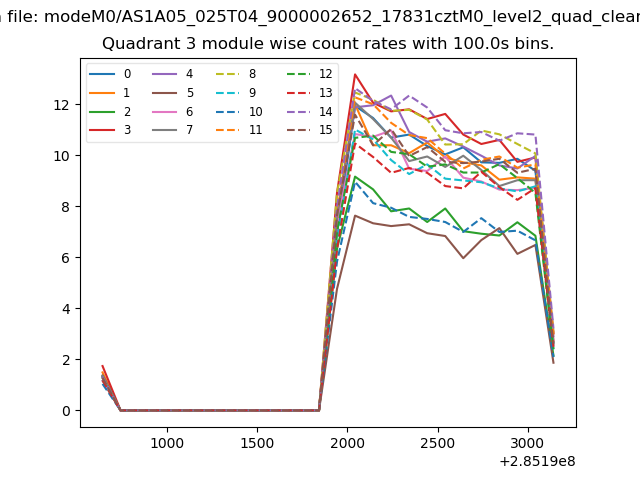
| Module-wise count rates for Quadrant A Data is divided into 100 sec bins |
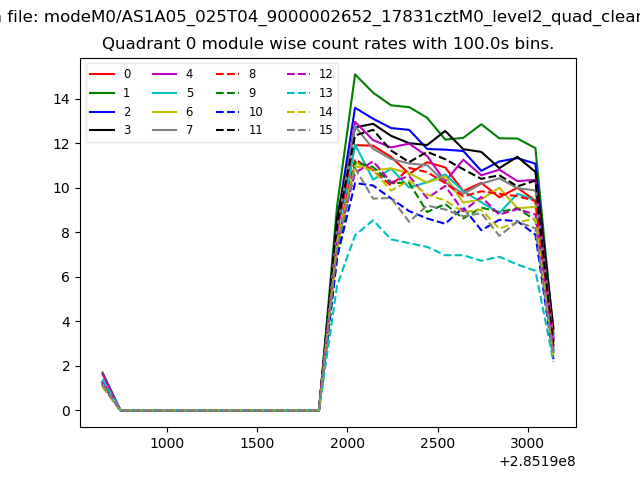 |
 |
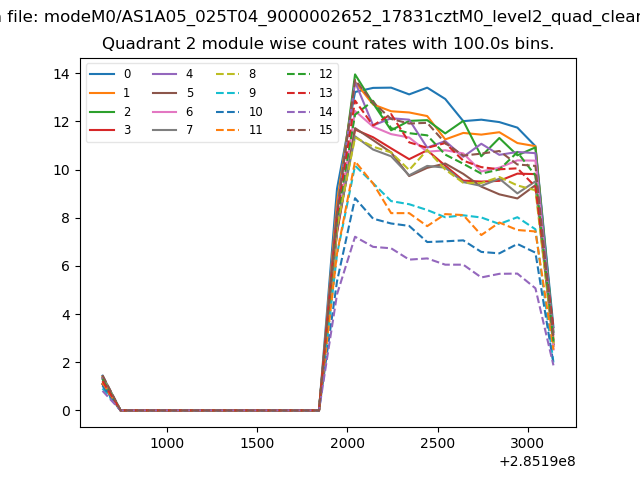
| Module-wise count rates for Quadrant B Data is divided into 100 sec bins |
 |
 |
| Module-wise count rates for Quadrant C Data is divided into 100 sec bins |
 |
 |
| Module-wise count rates for Quadrant D Data is divided into 100 sec bins |
 |
 |
| Parameter | Plot |
|---|---|
| CZT HV Monitor | 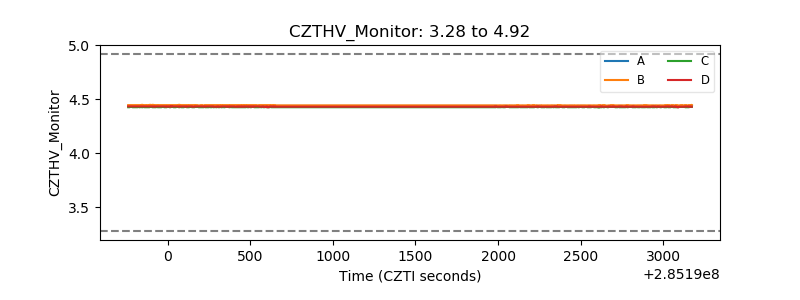 |
| D_VDD | 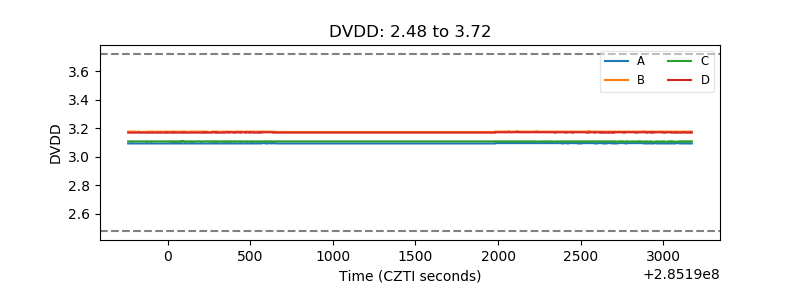 |
| Temperature 1 | 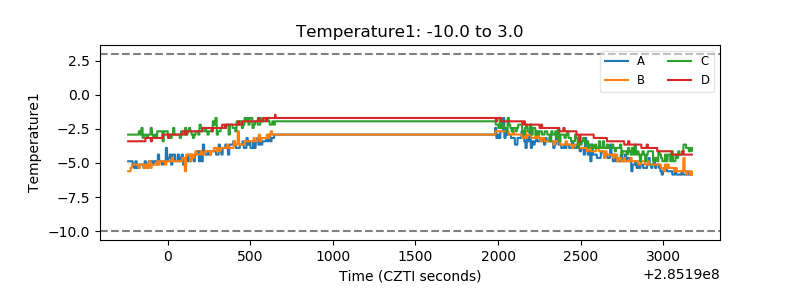 |
| Veto HV Monitor | 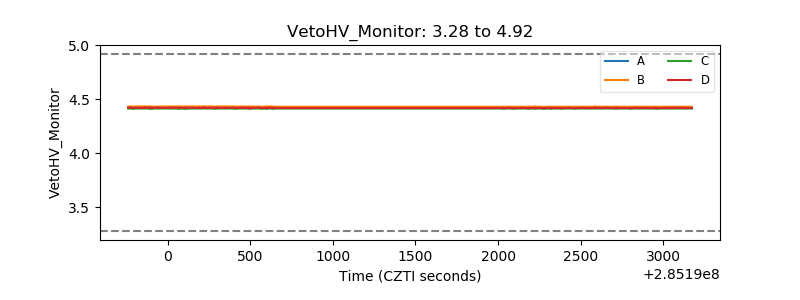 |
| Veto LLD | 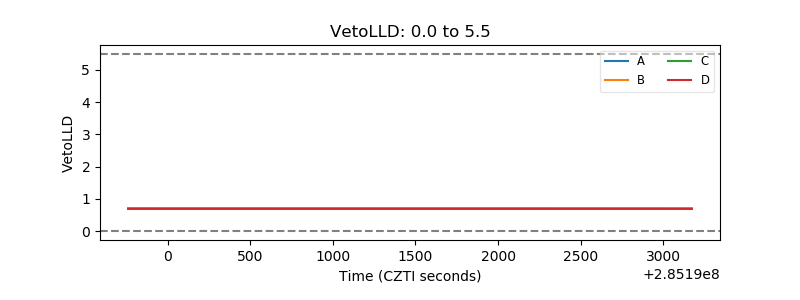 |
| Alpha Counter | 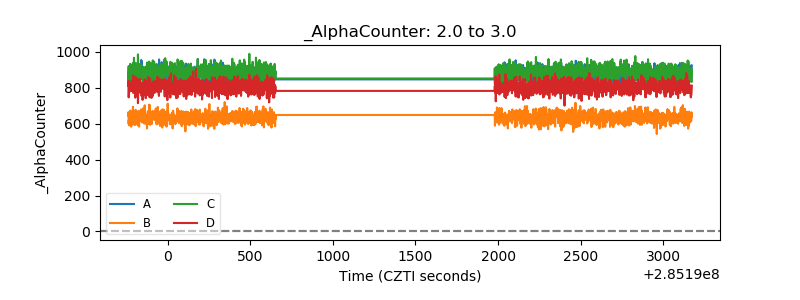 |
| _CPM_Rate | 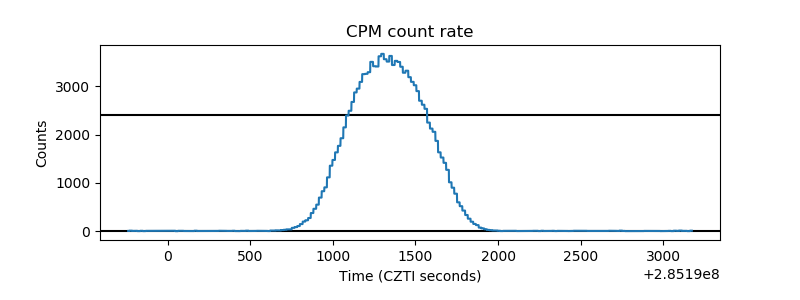 |
| CZT Counter | 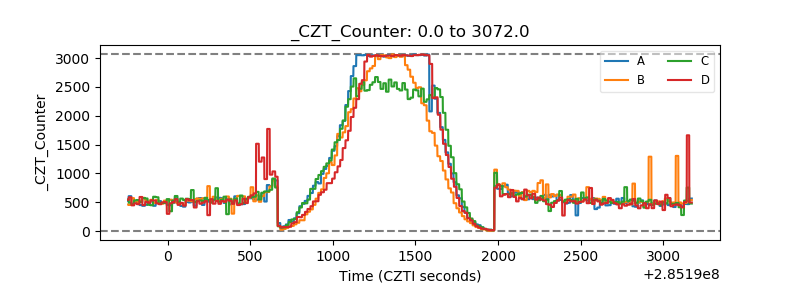 |
| +2.5 Volts monitor | 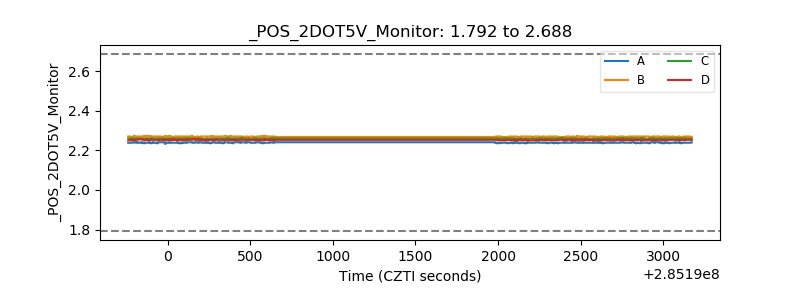 |
| +5 Volts monitor |  |
| _ROLL_ROT | 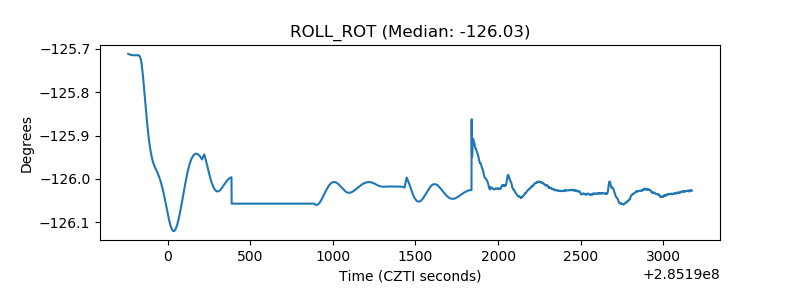 |
| _Roll_DEC | 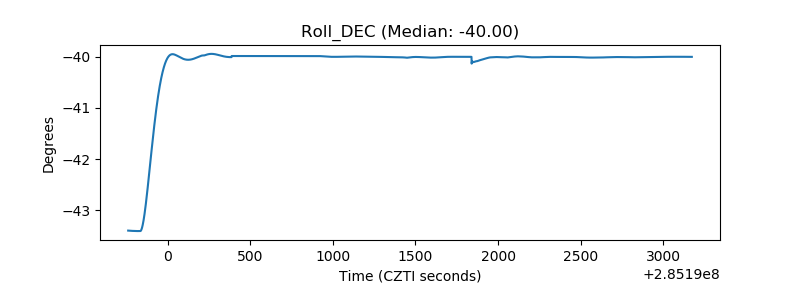 |
| _Roll_RA | 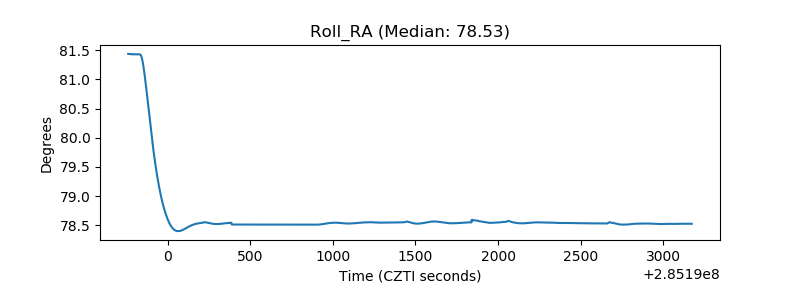 |
| Veto Counter | 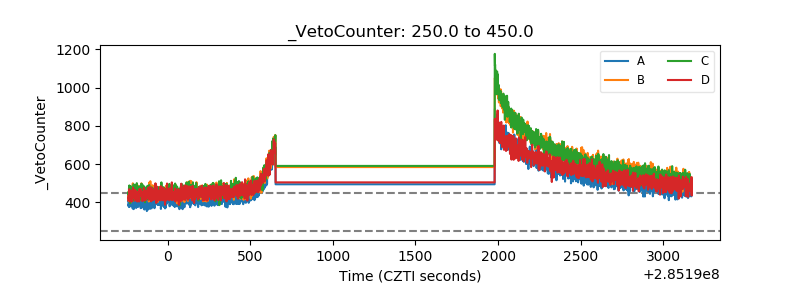 |