| Param | Original file | Final file |
|---|---|---|
| Filename | modeM0/AS1A05_025T04_9000002652_17832cztM0_level2.evt | modeM0/AS1A05_025T04_9000002652_17832cztM0_level2_quad_clean.evt |
| Size (bytes) | 447,134,400 | 94,262,400 |
| Size | 426.4 MB | 89.9 MB |
| Events in quadrant A | 3,579,128 | 606,593 |
| Events in quadrant B | 3,218,248 | 636,522 |
| Events in quadrant C | 3,109,113 | 605,776 |
| Events in quadrant D | 3,222,515 | 581,637 |
| Mode SS | |||
|---|---|---|---|
| Quadrant | BADHDUFLAG | Total packets | Discarded packets |
| A | 0 | 124 | 0 |
| B | 0 | 124 | 0 |
| C | 0 | 124 | 0 |
| D | 0 | 124 | 0 |
| Mode M0 | |||
|---|---|---|---|
| Quadrant | BADHDUFLAG | Total packets | Discarded packets |
| A | 0 | 14418 | 2 |
| B | 0 | 13305 | 2 |
| C | 0 | 12852 | 2 |
| D | 0 | 13563 | 2 |
| Mode M9 | |||
|---|---|---|---|
| Quadrant | BADHDUFLAG | Total packets | Discarded packets |
| A | 0 | 24 | 0 |
| B | 0 | 25 | 0 |
| C | 0 | 25 | 0 |
| D | 0 | 25 | 0 |
| Quadrant | Total seconds | Saturated seconds | Saturation percentage |
|---|---|---|---|
| A | 6071 | 204 | 3.360237% |
| B | 6071 | 35 | 0.576511% |
| C | 6071 | 40 | 0.658870% |
| D | 6070 | 16 | 0.263591% |
Noise dominated data is calculated using 1-second bins in cleaned event files. If a bin has >2000 counts, and if more than 50% of those come from <1% of pixels, then it is considered to be noise-dominated and hence unusable.
| Quadrant | # 1 sec bins | Bins with >0 counts | Bins with >2000 counts | High rate bins dominated by noise | Noise dominated (total time) | Noise dominated (detector-on time) | Marked lightcurve |
|---|---|---|---|---|---|---|---|
| A | 7476 | 6072 | 171 | 171 | 2.29% | 2.82% | 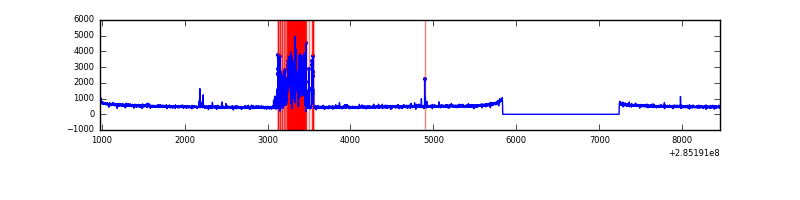 |
| B | 7476 | 6072 | 5 | 5 | 0.07% | 0.08% | 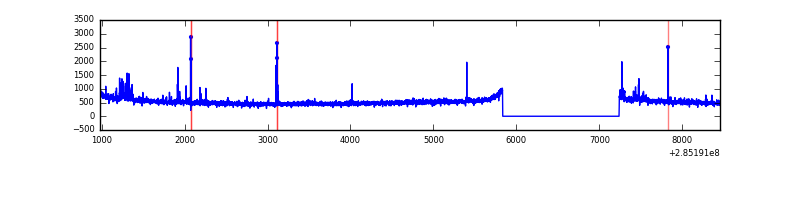 |
| C | 7476 | 6072 | 0 | 0 | 0.00% | 0.00% | 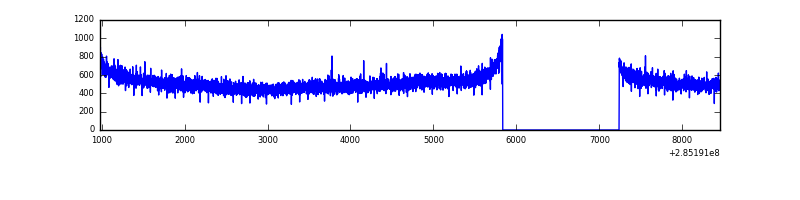 |
| D | 7475 | 6071 | 6 | 6 | 0.08% | 0.10% | 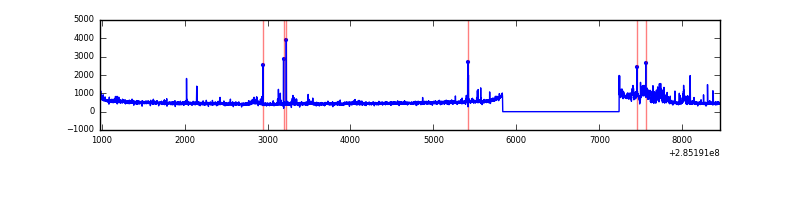 |
Top three noisy pixels from each quadrant. If the there are fewer than three noisy pixels in the level2.evt file, extra rows are filled as -1
| Pixel properties | Quadrant properties | ||||||
|---|---|---|---|---|---|---|---|
| Quadrant | DetID | PixID | Counts | Sigma | Mean | Median | Sigma |
| A | 15 | 174 | 606133 | 3959.36 | 773 | 758 | 152.9 |
| A | 0 | 226 | 6741 | 39.13 | 773 | 758 | 152.9 |
| A | 12 | 194 | 5541 | 31.28 | 773 | 758 | 152.9 |
| B | 10 | 245 | 44398 | 300.15 | 793 | 775 | 145.3 |
| B | 0 | 189 | 19817 | 131.02 | 793 | 775 | 145.3 |
| B | 12 | 111 | 16977 | 111.48 | 793 | 775 | 145.3 |
| C | 14 | 238 | 121043 | 680.31 | 759 | 766 | 176.8 |
| C | 5 | 218 | 26279 | 144.31 | 759 | 766 | 176.8 |
| C | 13 | 61 | 5286 | 25.57 | 759 | 766 | 176.8 |
| D | 7 | 238 | 157072 | 808.86 | 750 | 734 | 193.3 |
| D | 12 | 110 | 91841 | 471.37 | 750 | 734 | 193.3 |
| D | 10 | 70 | 51627 | 263.31 | 750 | 734 | 193.3 |
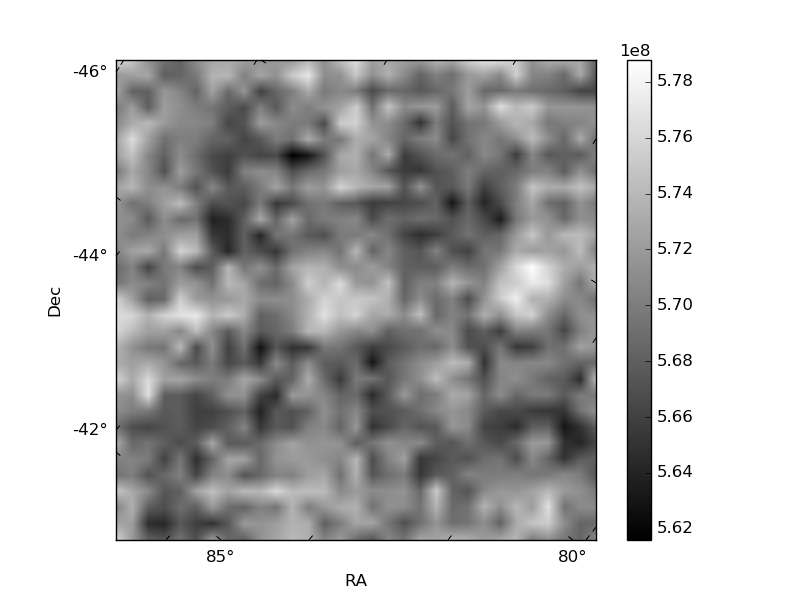
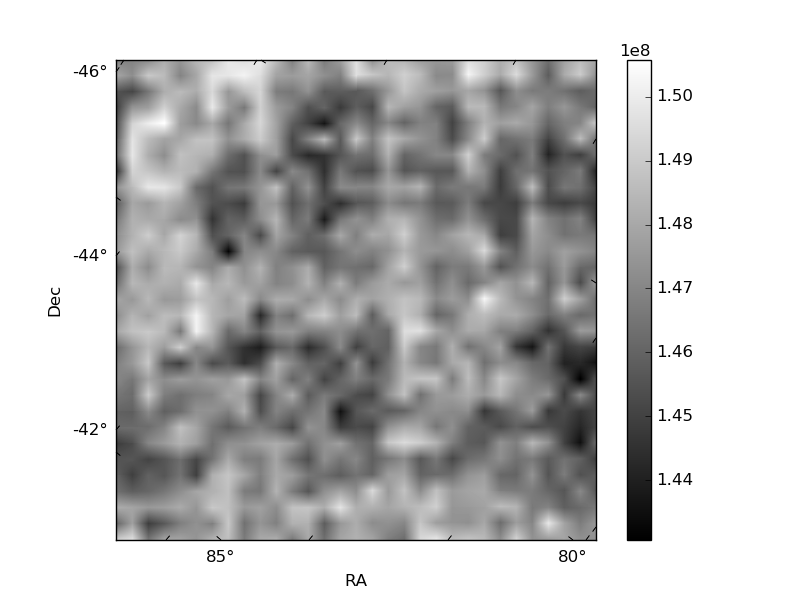
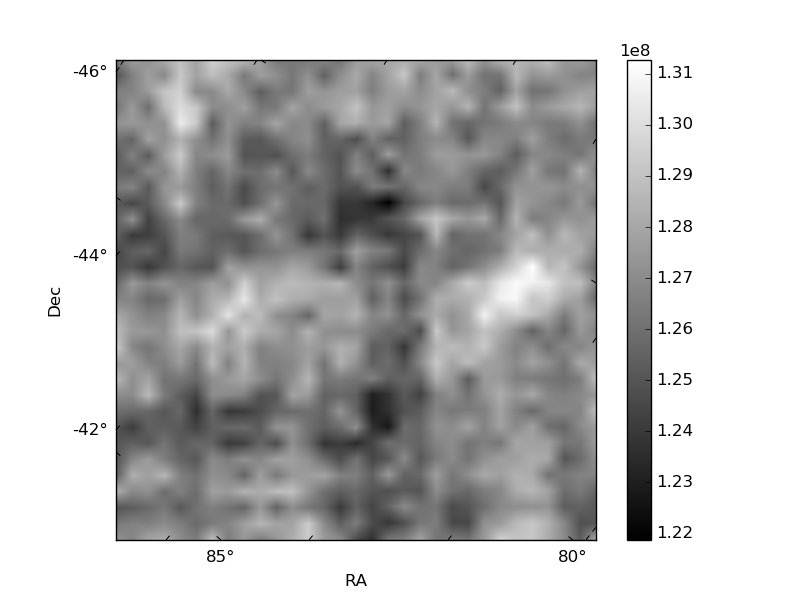
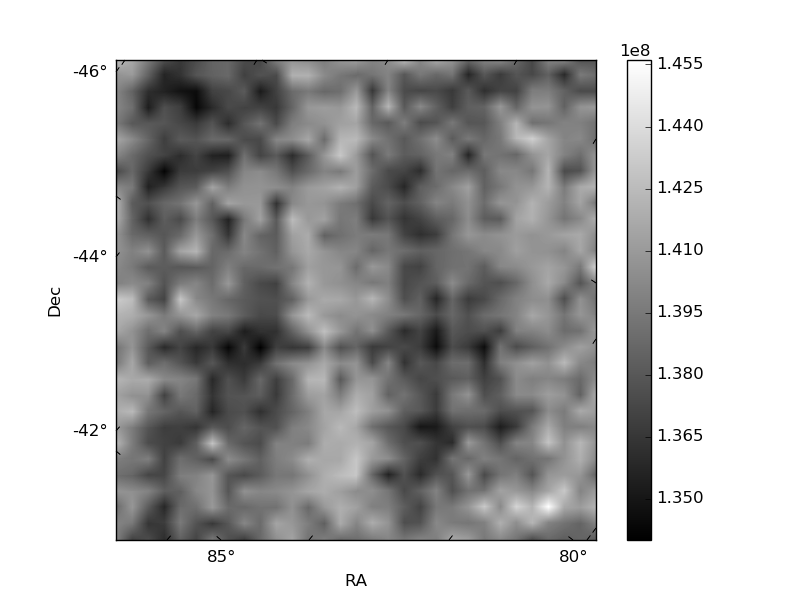
Histogram calculated using DETX and DETY for each event in the final _common_clean file
| Quadrant A | 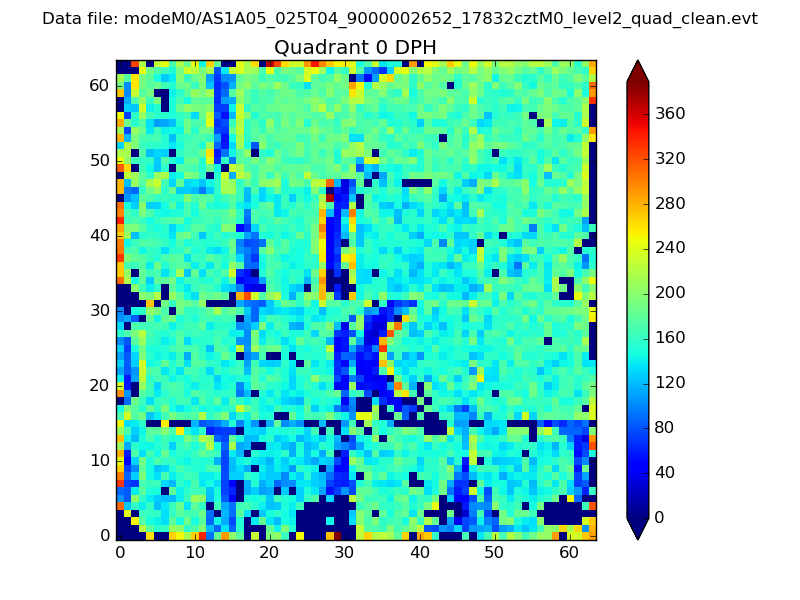 |
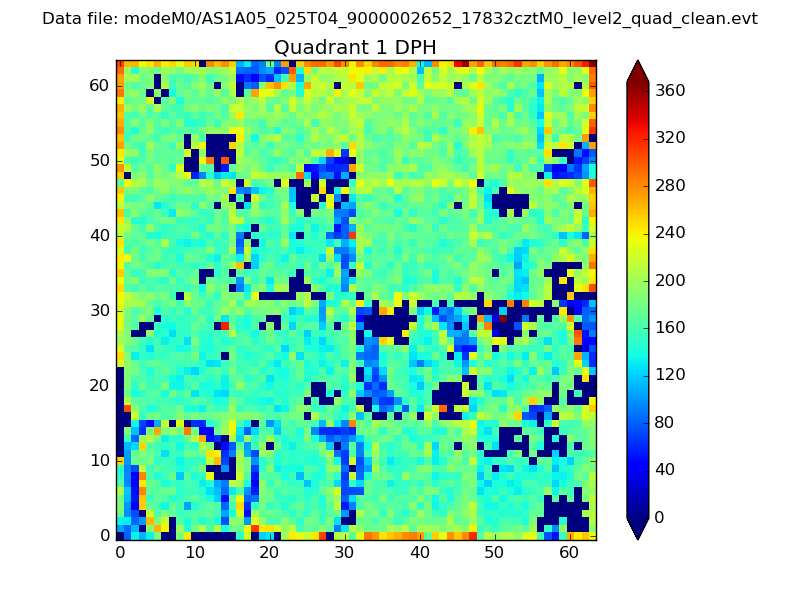 |
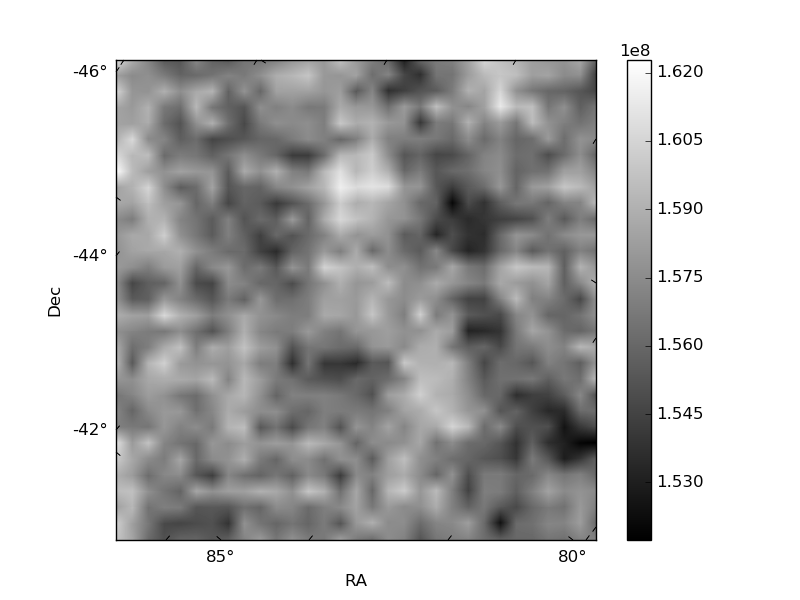
Quadrant B |
|---|---|---|---|
| Quadrant D | 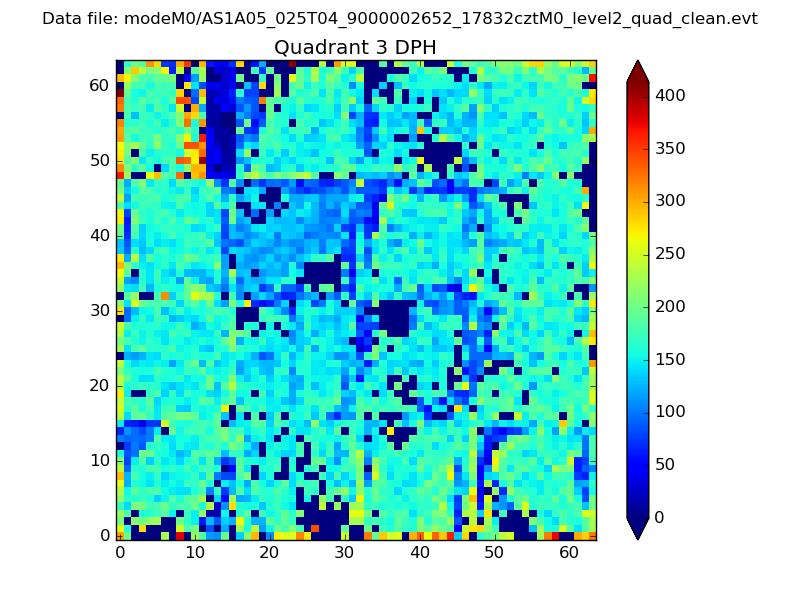 |
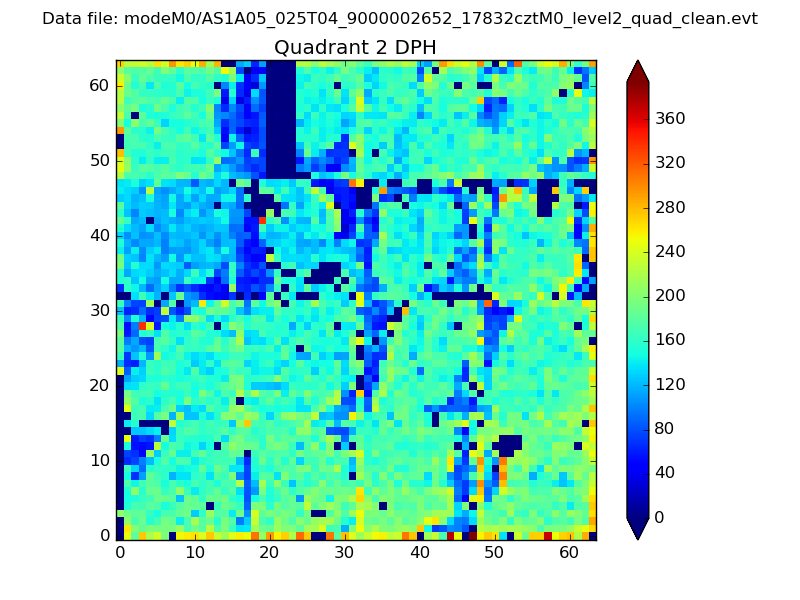 |
Quadrant C |
| Plot type | Count rate plots | Images |
|---|---|---|
| Comparison with Poisson distribution Blue bars denote a histogram of data divided into 1 sec bins. Red curve is a Poisson curve with rate = median count rate of data. |
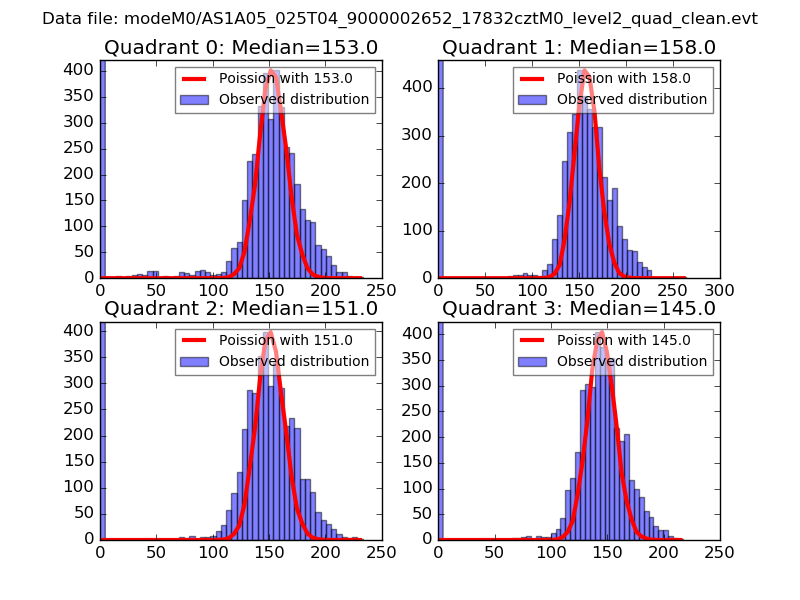 |
 |
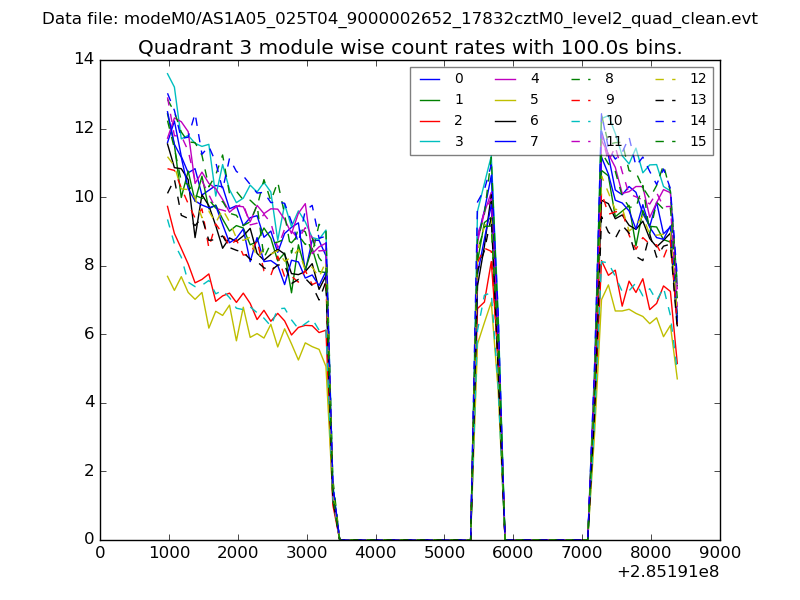
| Quadrant-wise count rates Data is divided into 100 sec bins |
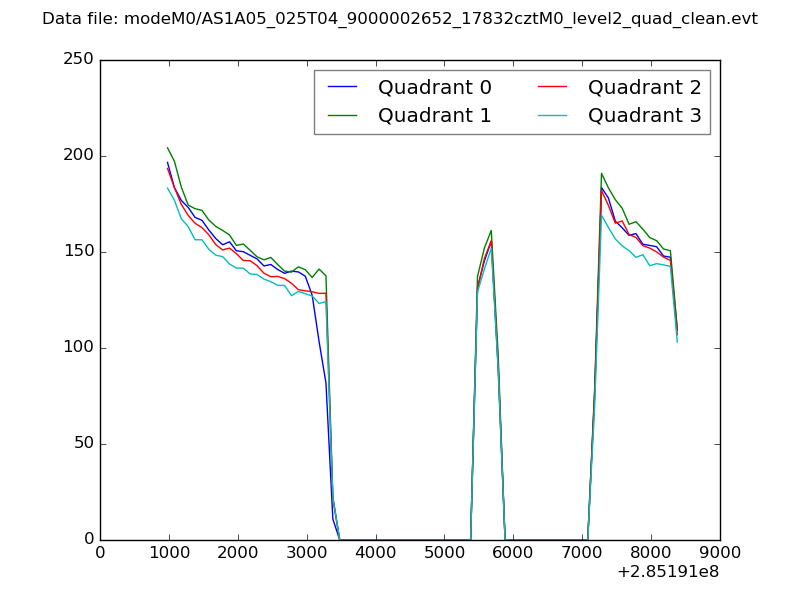 |
|
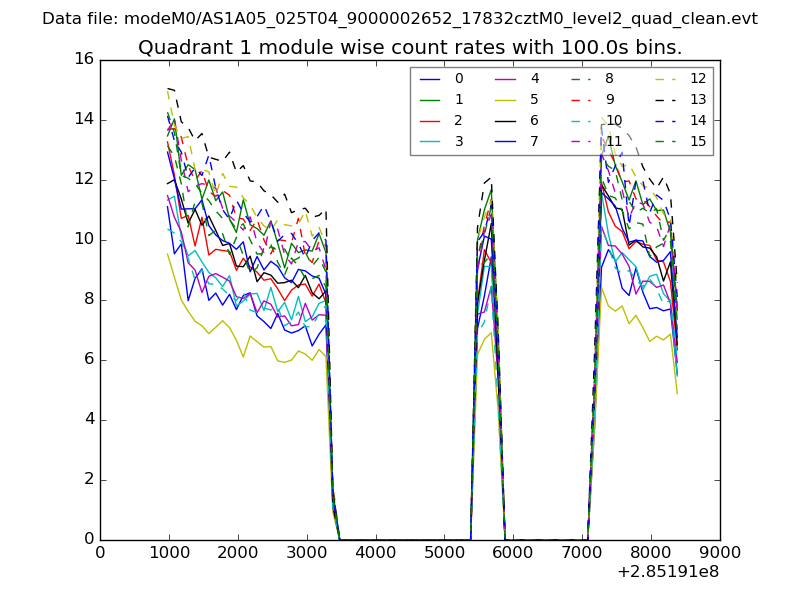
| Module-wise count rates for Quadrant A Data is divided into 100 sec bins |
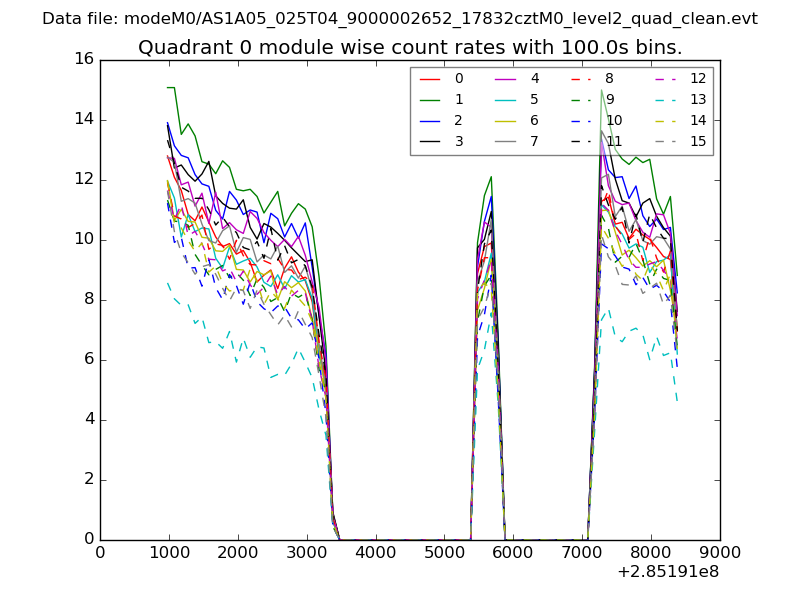 |
 |
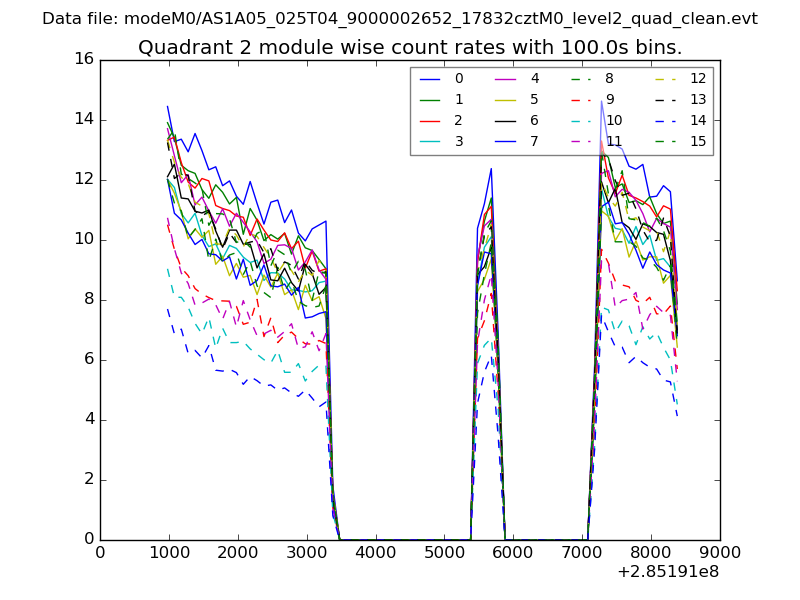
| Module-wise count rates for Quadrant B Data is divided into 100 sec bins |
 |
 |
| Module-wise count rates for Quadrant C Data is divided into 100 sec bins |
 |
 |
| Module-wise count rates for Quadrant D Data is divided into 100 sec bins |
 |
 |
| Parameter | Plot |
|---|---|
| CZT HV Monitor | 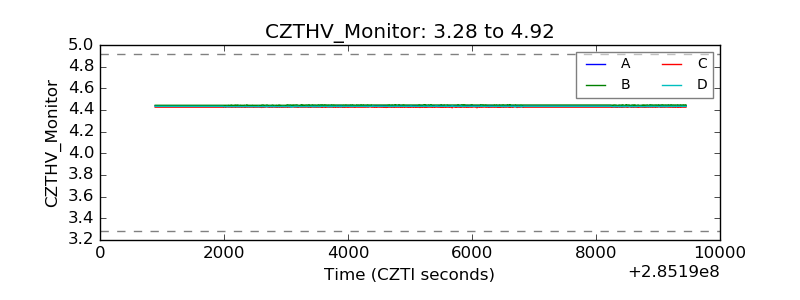 |
| D_VDD | 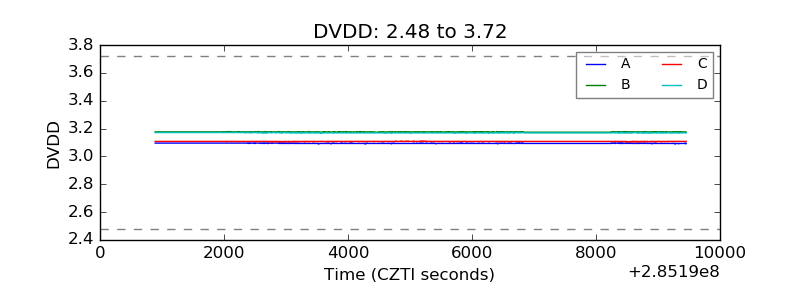 |
| Temperature 1 | 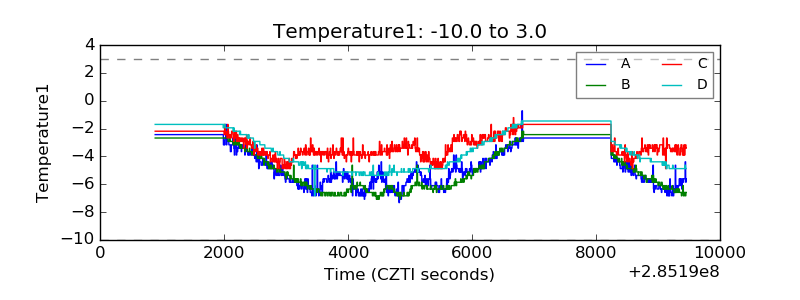 |
| Veto HV Monitor | 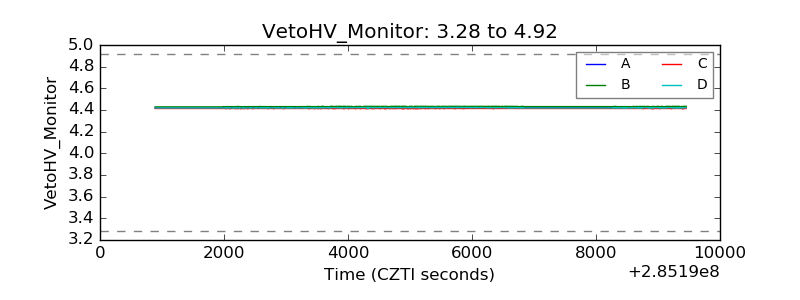 |
| Veto LLD | 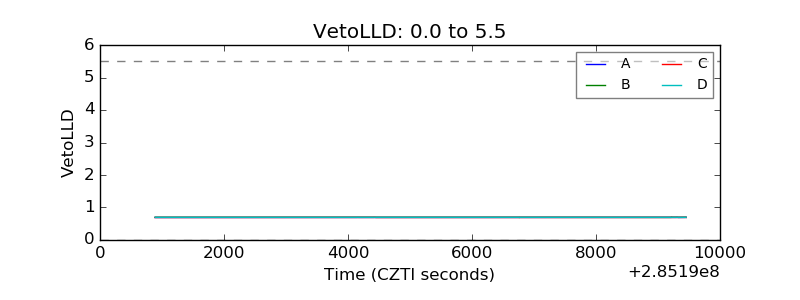 |
| Alpha Counter | 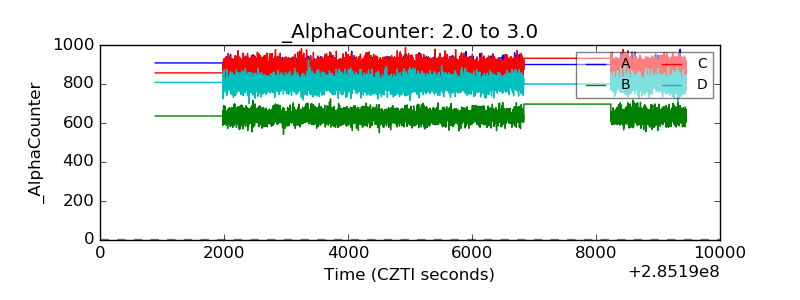 |
| _CPM_Rate | 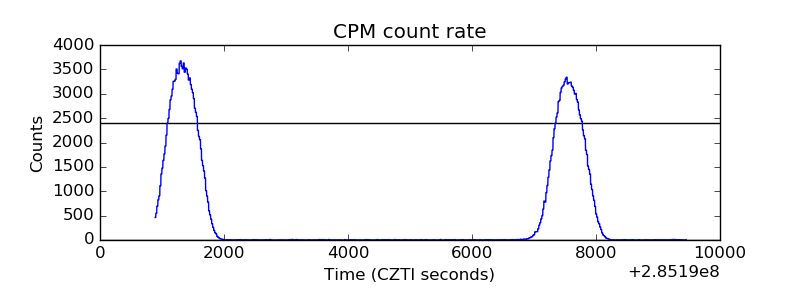 |
| CZT Counter | 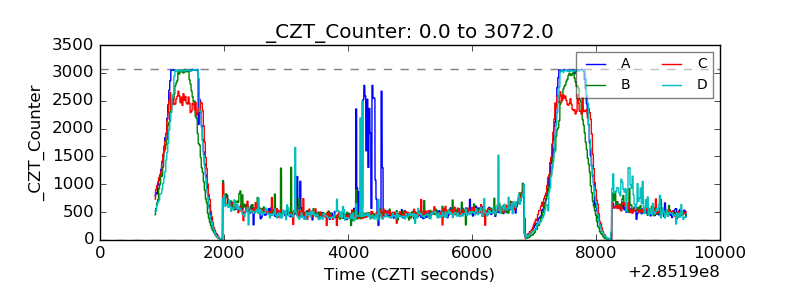 |
| +2.5 Volts monitor | 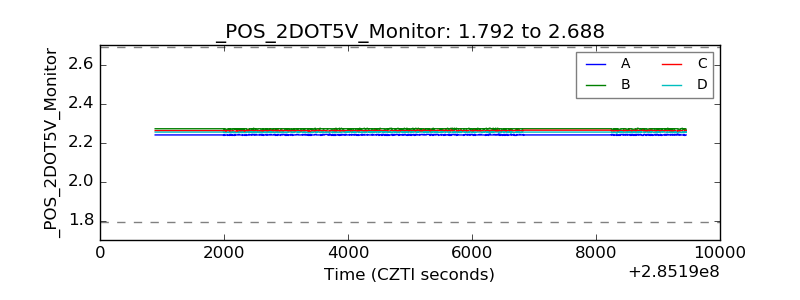 |
| +5 Volts monitor |  |
| _ROLL_ROT | 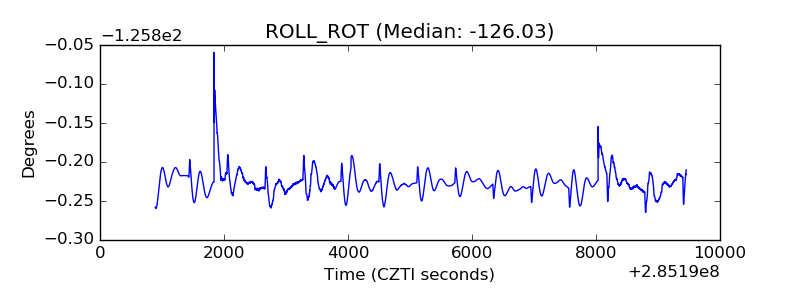 |
| _Roll_DEC | 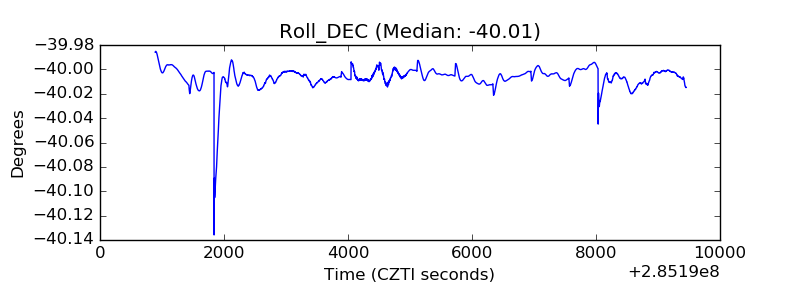 |
| _Roll_RA | 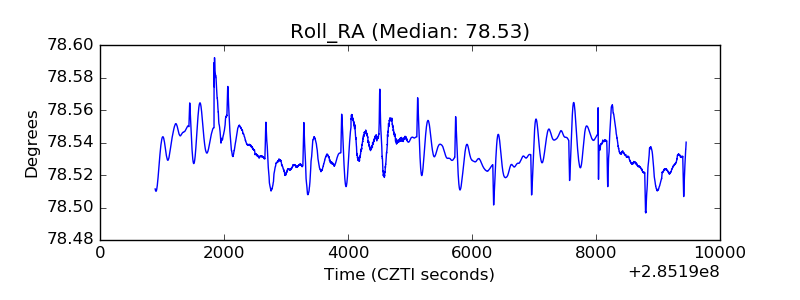 |
| Veto Counter | 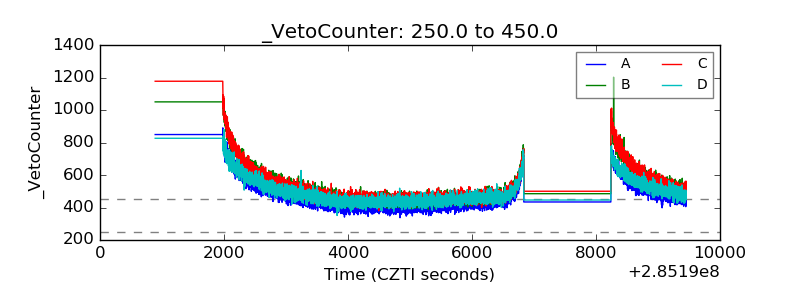 |