| Param | Original file | Final file |
|---|---|---|
| Filename | modeM0/AS1A05_025T04_9000002652_17834cztM0_level2.evt | modeM0/AS1A05_025T04_9000002652_17834cztM0_level2_quad_clean.evt |
| Size (bytes) | 482,256,000 | 92,666,880 |
| Size | 459.9 MB | 88.4 MB |
| Events in quadrant A | 3,138,157 | 593,194 |
| Events in quadrant B | 3,350,051 | 610,365 |
| Events in quadrant C | 3,504,459 | 584,596 |
| Events in quadrant D | 4,165,526 | 559,056 |
| Mode SS | |||
|---|---|---|---|
| Quadrant | BADHDUFLAG | Total packets | Discarded packets |
| A | 0 | 134 | 0 |
| B | 0 | 134 | 0 |
| C | 0 | 134 | 0 |
| D | 0 | 134 | 0 |
| Mode M0 | |||
|---|---|---|---|
| Quadrant | BADHDUFLAG | Total packets | Discarded packets |
| A | 0 | 13649 | 2 |
| B | 0 | 13994 | 2 |
| C | 0 | 14289 | 2 |
| D | 0 | 16897 | 2 |
| Mode M9 | |||
|---|---|---|---|
| Quadrant | BADHDUFLAG | Total packets | Discarded packets |
| A | 0 | 17 | 0 |
| B | 0 | 18 | 0 |
| C | 0 | 18 | 0 |
| D | 0 | 18 | 0 |
| Quadrant | Total seconds | Saturated seconds | Saturation percentage |
|---|---|---|---|
| A | 6582 | 23 | 0.349438% |
| B | 6582 | 50 | 0.759648% |
| C | 6582 | 78 | 1.185050% |
| D | 6582 | 200 | 3.038590% |
Noise dominated data is calculated using 1-second bins in cleaned event files. If a bin has >2000 counts, and if more than 50% of those come from <1% of pixels, then it is considered to be noise-dominated and hence unusable.
| Quadrant | # 1 sec bins | Bins with >0 counts | Bins with >2000 counts | High rate bins dominated by noise | Noise dominated (total time) | Noise dominated (detector-on time) | Marked lightcurve |
|---|---|---|---|---|---|---|---|
| A | 7792 | 6583 | 0 | 0 | 0.00% | 0.00% | 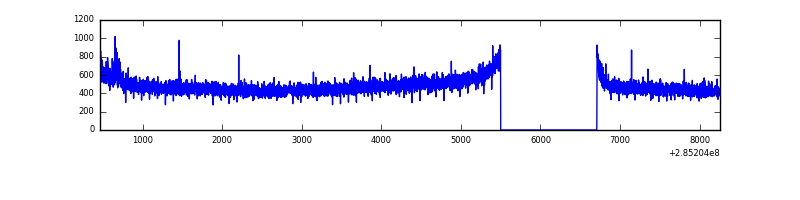 |
| B | 7792 | 6583 | 6 | 6 | 0.08% | 0.09% | 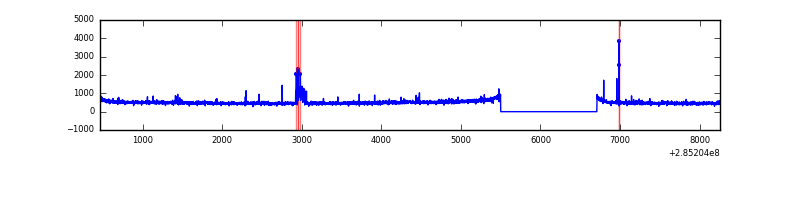 |
| C | 7792 | 6583 | 0 | 0 | 0.00% | 0.00% | 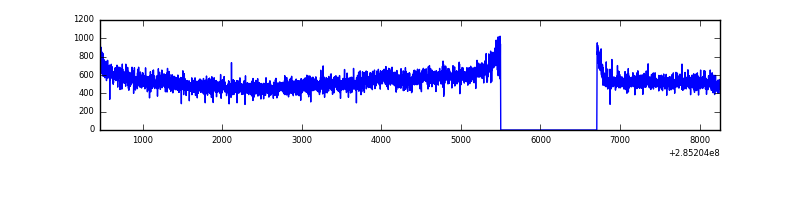 |
| D | 7792 | 6583 | 153 | 153 | 1.96% | 2.32% | 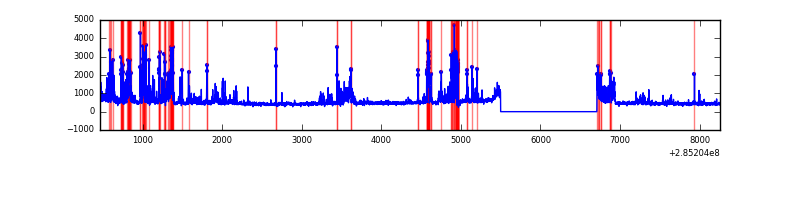 |
Top three noisy pixels from each quadrant. If the there are fewer than three noisy pixels in the level2.evt file, extra rows are filled as -1
| Pixel properties | Quadrant properties | ||||||
|---|---|---|---|---|---|---|---|
| Quadrant | DetID | PixID | Counts | Sigma | Mean | Median | Sigma |
| A | 15 | 174 | 16180 | 94.4 | 812 | 797 | 163.0 |
| A | 0 | 226 | 7114 | 38.77 | 812 | 797 | 163.0 |
| A | 3 | 137 | 6178 | 33.02 | 812 | 797 | 163.0 |
| B | 15 | 222 | 80903 | 517.47 | 823 | 804 | 154.8 |
| B | 0 | 219 | 22734 | 141.68 | 823 | 804 | 154.8 |
| B | 12 | 111 | 18350 | 113.35 | 823 | 804 | 154.8 |
| C | 13 | 62 | 254156 | 1358.95 | 795 | 802 | 186.4 |
| C | 14 | 238 | 123622 | 658.79 | 795 | 802 | 186.4 |
| C | 5 | 218 | 24961 | 129.58 | 795 | 802 | 186.4 |
| D | 7 | 238 | 1099282 | 5256.95 | 781 | 766 | 209.0 |
| D | 2 | 234 | 25096 | 116.43 | 781 | 766 | 209.0 |
| D | 10 | 70 | 23321 | 107.94 | 781 | 766 | 209.0 |
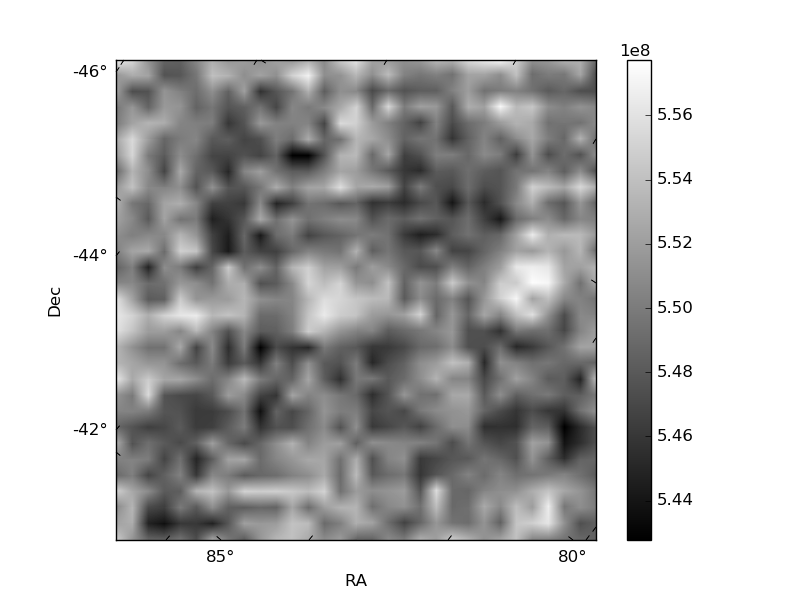
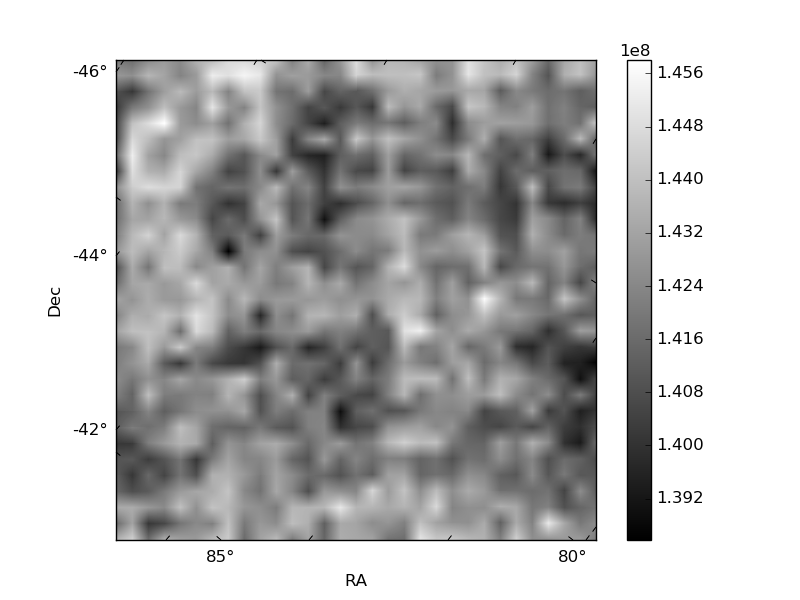
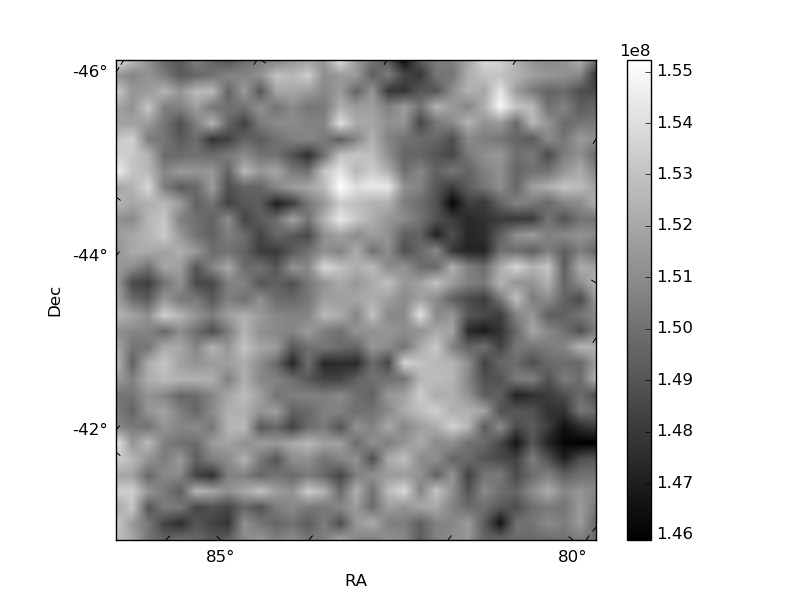
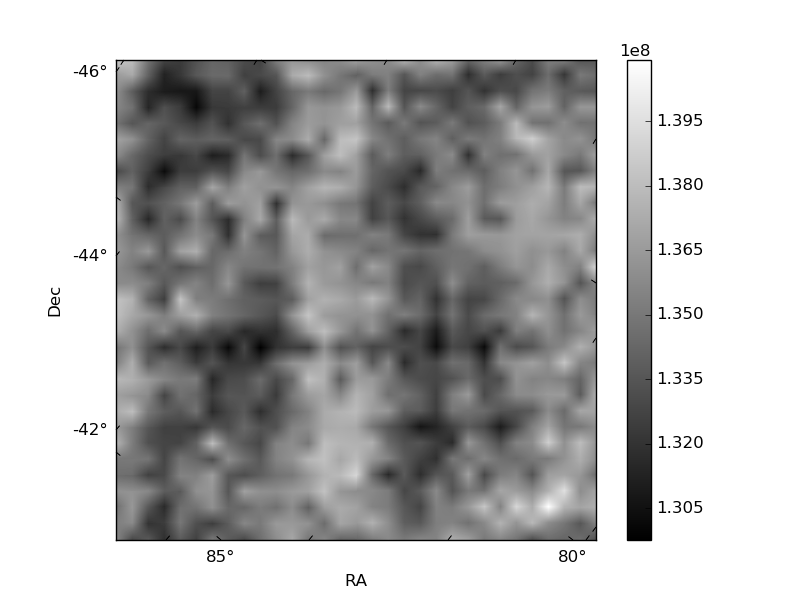
Histogram calculated using DETX and DETY for each event in the final _common_clean file
| Quadrant A | 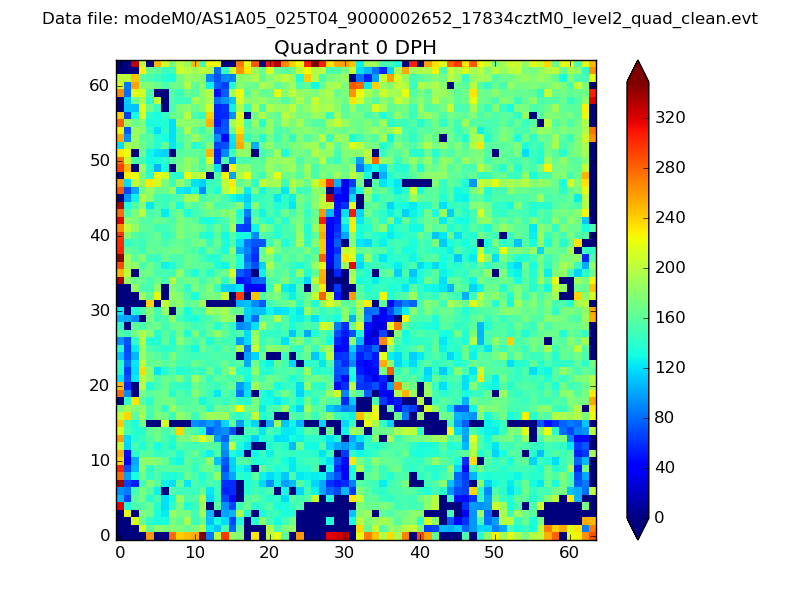 |
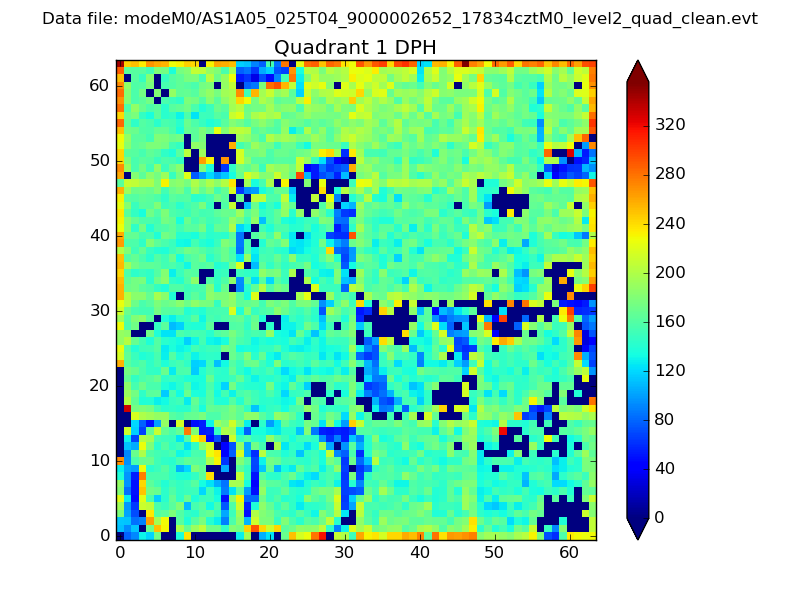 |
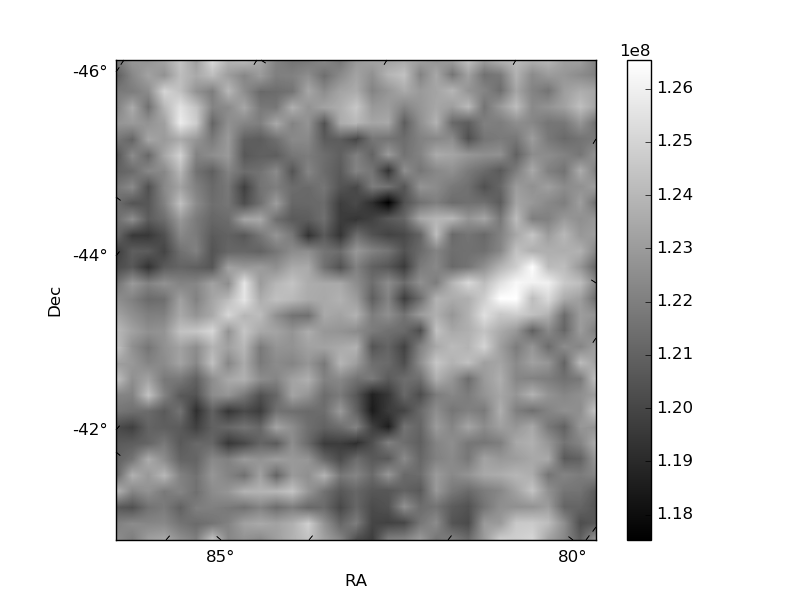
Quadrant B |
|---|---|---|---|
| Quadrant D | 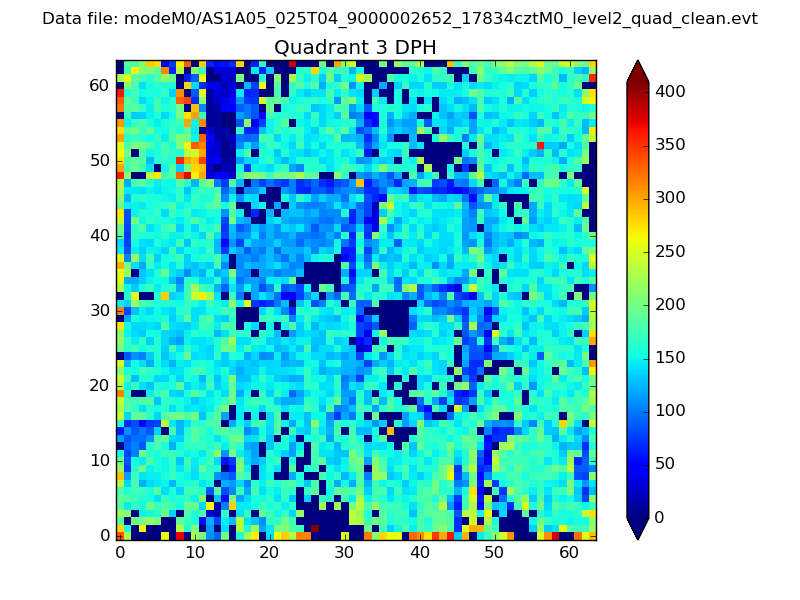 |
 |
Quadrant C |
| Plot type | Count rate plots | Images |
|---|---|---|
| Comparison with Poisson distribution Blue bars denote a histogram of data divided into 1 sec bins. Red curve is a Poisson curve with rate = median count rate of data. |
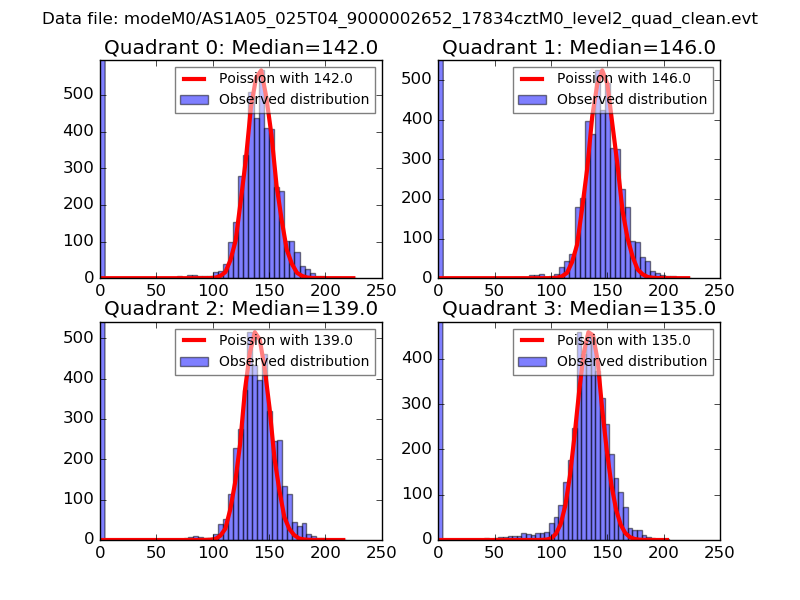 |
 |
| Quadrant-wise count rates Data is divided into 100 sec bins |
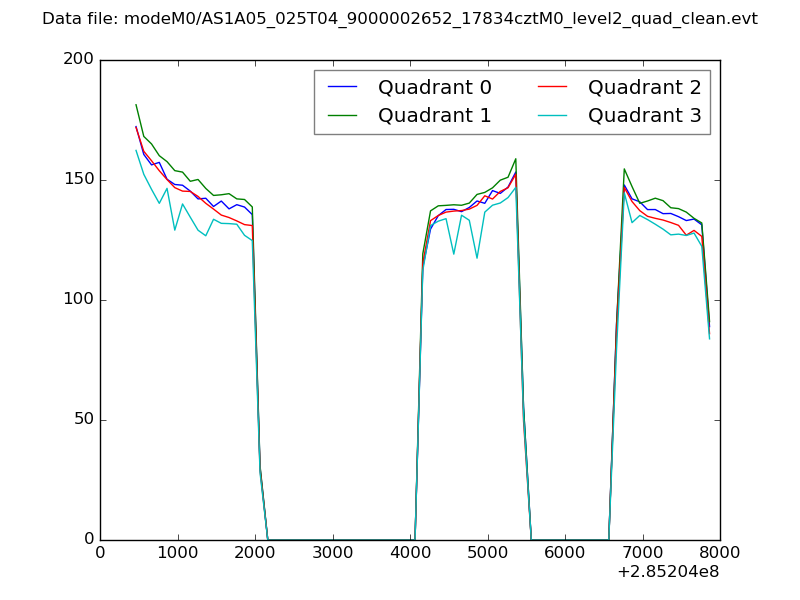 |
|
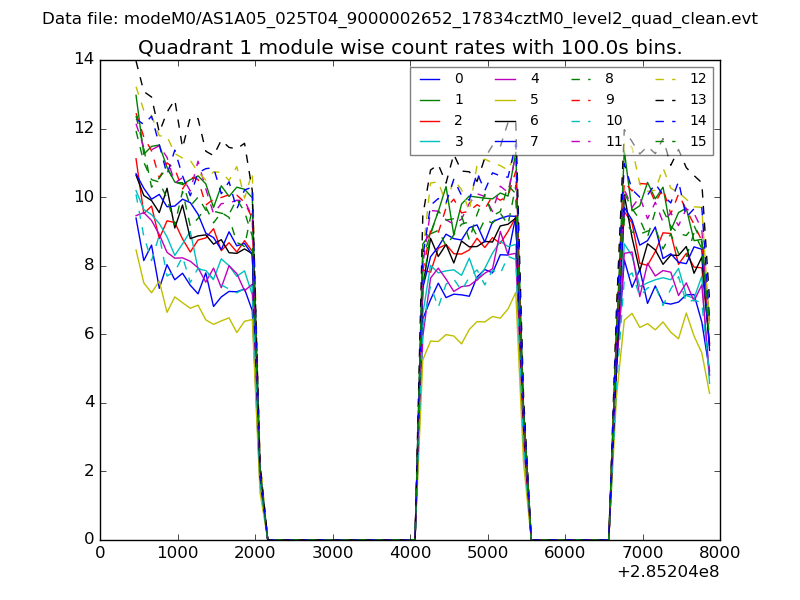
| Module-wise count rates for Quadrant A Data is divided into 100 sec bins |
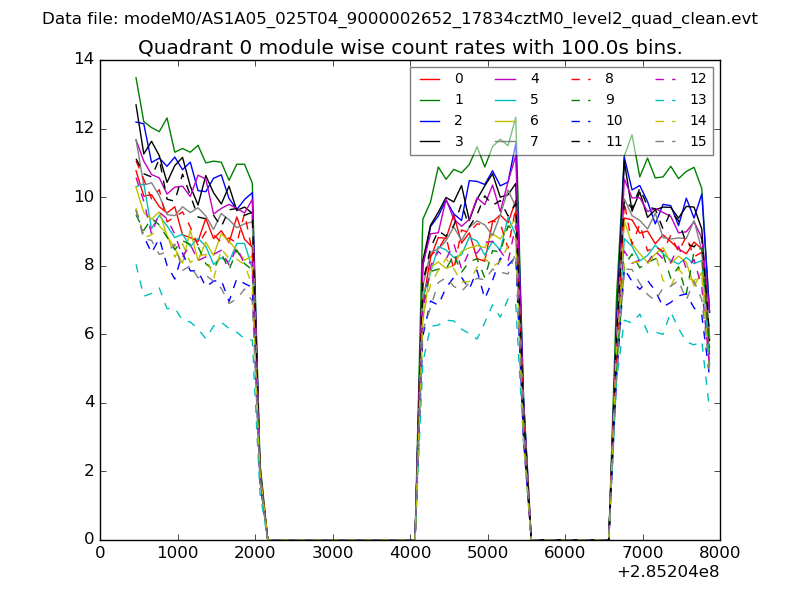 |
 |
| Module-wise count rates for Quadrant B Data is divided into 100 sec bins |
 |
 |
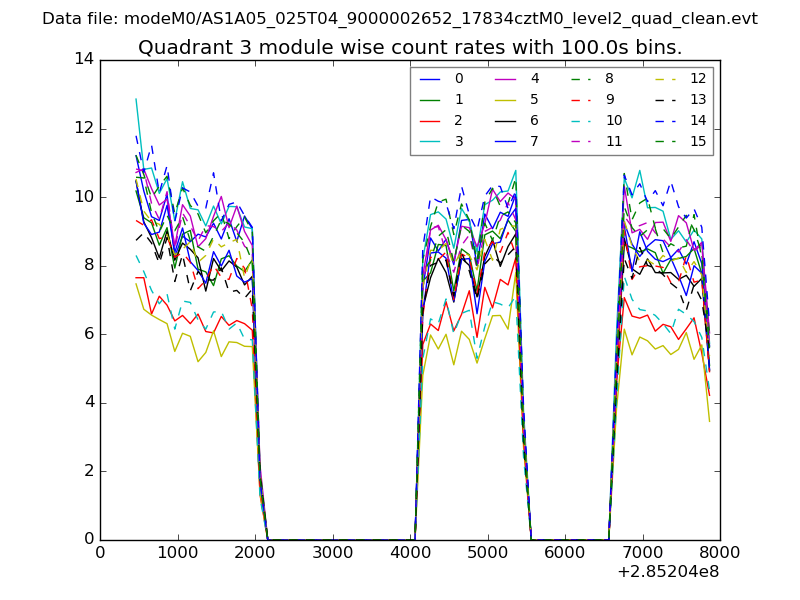
| Module-wise count rates for Quadrant C Data is divided into 100 sec bins |
 |
 |
| Module-wise count rates for Quadrant D Data is divided into 100 sec bins |
 |
 |
| Parameter | Plot |
|---|---|
| CZT HV Monitor | 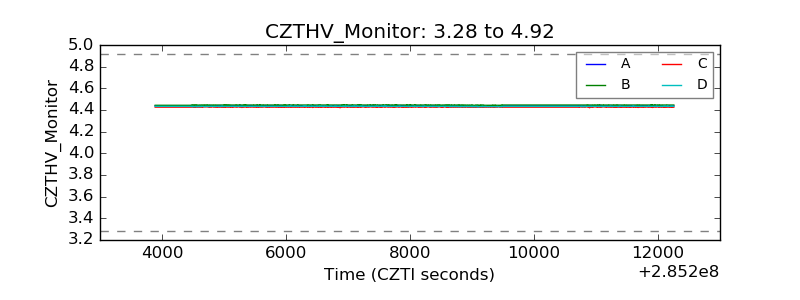 |
| D_VDD | 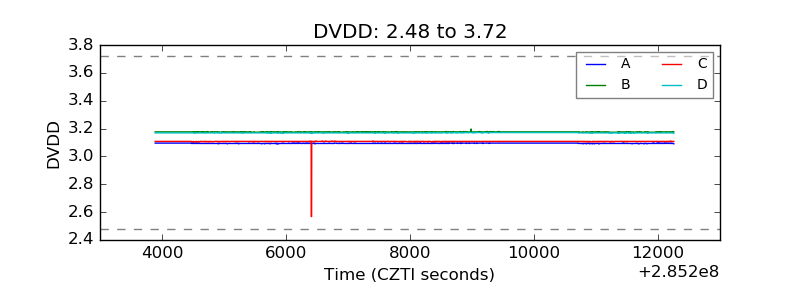 |
| Temperature 1 | 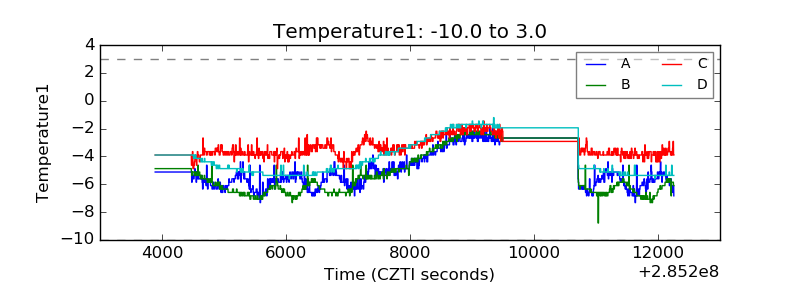 |
| Veto HV Monitor | 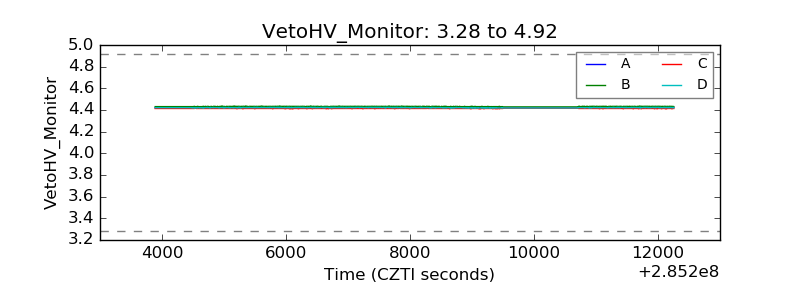 |
| Veto LLD | 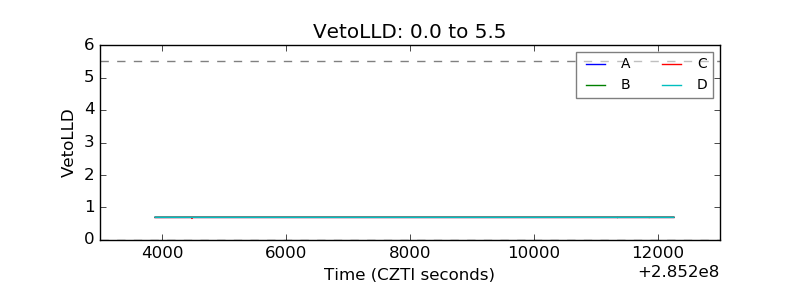 |
| Alpha Counter | 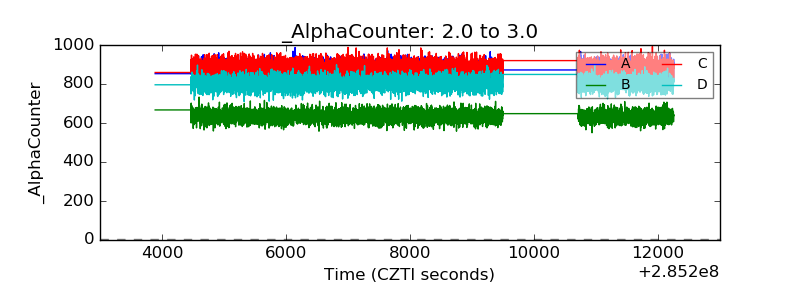 |
| _CPM_Rate | 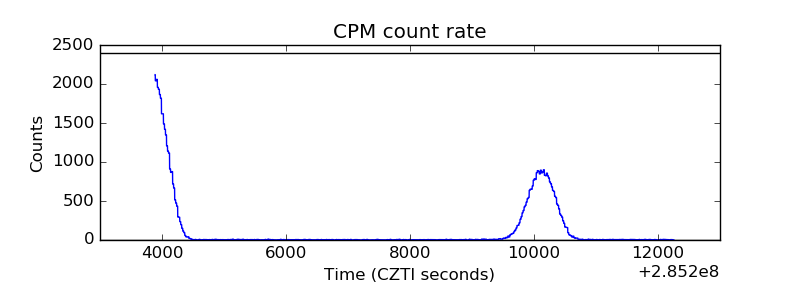 |
| CZT Counter | 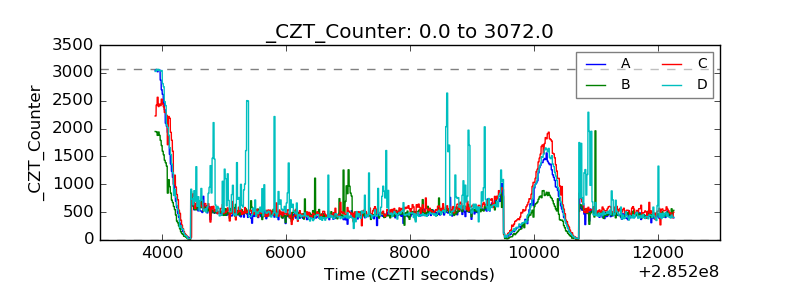 |
| +2.5 Volts monitor |  |
| +5 Volts monitor |  |
| _ROLL_ROT | 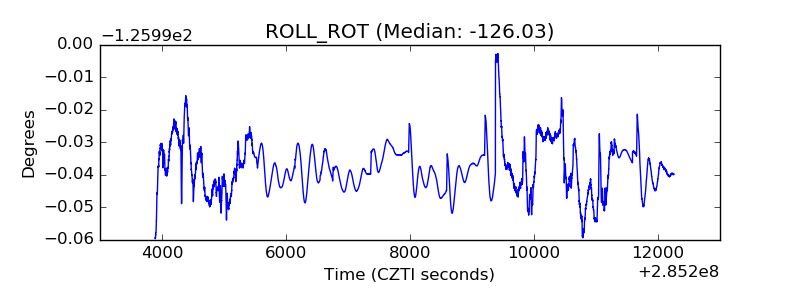 |
| _Roll_DEC | 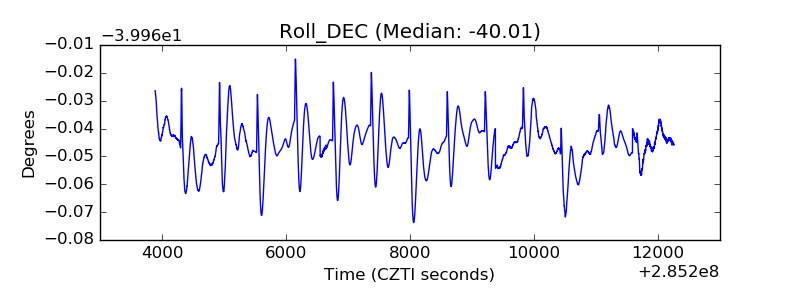 |
| _Roll_RA | 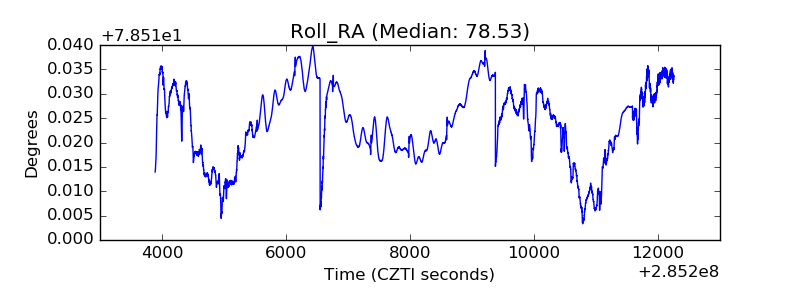 |
| Veto Counter | 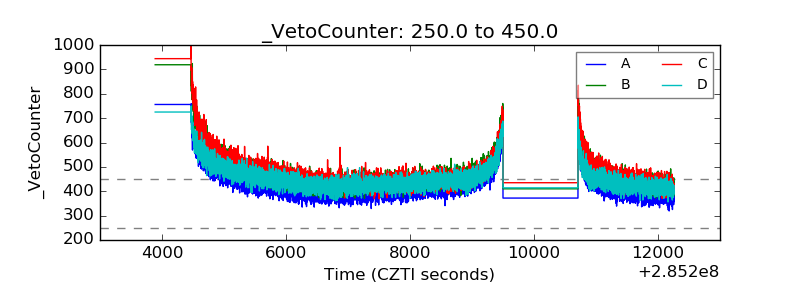 |