| Param | Original file | Final file |
|---|---|---|
| Filename | modeM0/AS1A05_025T04_9000002652_17835cztM0_level2.evt | modeM0/AS1A05_025T04_9000002652_17835cztM0_level2_quad_clean.evt |
| Size (bytes) | 463,504,320 | 87,255,360 |
| Size | 442.0 MB | 83.2 MB |
| Events in quadrant A | 3,112,941 | 552,209 |
| Events in quadrant B | 3,289,111 | 560,056 |
| Events in quadrant C | 3,425,516 | 537,871 |
| Events in quadrant D | 3,751,049 | 521,630 |
| Mode SS | |||
|---|---|---|---|
| Quadrant | BADHDUFLAG | Total packets | Discarded packets |
| A | 0 | 136 | 0 |
| B | 0 | 136 | 0 |
| C | 0 | 136 | 0 |
| D | 0 | 136 | 0 |
| Mode M0 | |||
|---|---|---|---|
| Quadrant | BADHDUFLAG | Total packets | Discarded packets |
| A | 0 | 13736 | 2 |
| B | 0 | 13999 | 2 |
| C | 0 | 13905 | 2 |
| D | 0 | 15883 | 2 |
| Mode M9 | |||
|---|---|---|---|
| Quadrant | BADHDUFLAG | Total packets | Discarded packets |
| A | 0 | 10 | 0 |
| B | 0 | 11 | 0 |
| C | 0 | 11 | 0 |
| D | 0 | 11 | 0 |
| Quadrant | Total seconds | Saturated seconds | Saturation percentage |
|---|---|---|---|
| A | 6753 | 31 | 0.459055% |
| B | 6753 | 67 | 0.992152% |
| C | 6753 | 69 | 1.021768% |
| D | 6753 | 123 | 1.821413% |
Noise dominated data is calculated using 1-second bins in cleaned event files. If a bin has >2000 counts, and if more than 50% of those come from <1% of pixels, then it is considered to be noise-dominated and hence unusable.
| Quadrant | # 1 sec bins | Bins with >0 counts | Bins with >2000 counts | High rate bins dominated by noise | Noise dominated (total time) | Noise dominated (detector-on time) | Marked lightcurve |
|---|---|---|---|---|---|---|---|
| A | 7628 | 6755 | 1 | 1 | 0.01% | 0.01% |  |
| B | 7628 | 6755 | 8 | 8 | 0.10% | 0.12% |  |
| C | 7628 | 6755 | 0 | 0 | 0.00% | 0.00% |  |
| D | 7628 | 6755 | 81 | 81 | 1.06% | 1.20% | 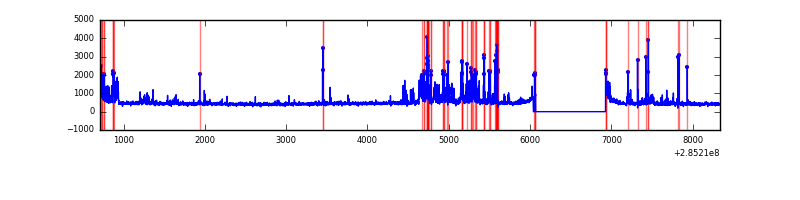 |
Top three noisy pixels from each quadrant. If the there are fewer than three noisy pixels in the level2.evt file, extra rows are filled as -1
| Pixel properties | Quadrant properties | ||||||
|---|---|---|---|---|---|---|---|
| Quadrant | DetID | PixID | Counts | Sigma | Mean | Median | Sigma |
| A | 15 | 174 | 7188 | 39.28 | 808 | 791 | 162.9 |
| A | 0 | 226 | 6955 | 37.85 | 808 | 791 | 162.9 |
| A | 3 | 137 | 6181 | 33.1 | 808 | 791 | 162.9 |
| B | 10 | 245 | 48375 | 308.56 | 813 | 791 | 154.2 |
| B | 15 | 222 | 25733 | 161.74 | 813 | 791 | 154.2 |
| B | 12 | 111 | 18589 | 115.41 | 813 | 791 | 154.2 |
| C | 13 | 62 | 213166 | 1165.29 | 784 | 791 | 182.3 |
| C | 14 | 238 | 122036 | 665.27 | 784 | 791 | 182.3 |
| C | 5 | 218 | 26028 | 138.47 | 784 | 791 | 182.3 |
| D | 7 | 238 | 717942 | 3743.39 | 783 | 761 | 191.6 |
| D | 1 | 52 | 27427 | 139.19 | 783 | 761 | 191.6 |
| D | 2 | 234 | 26286 | 133.23 | 783 | 761 | 191.6 |
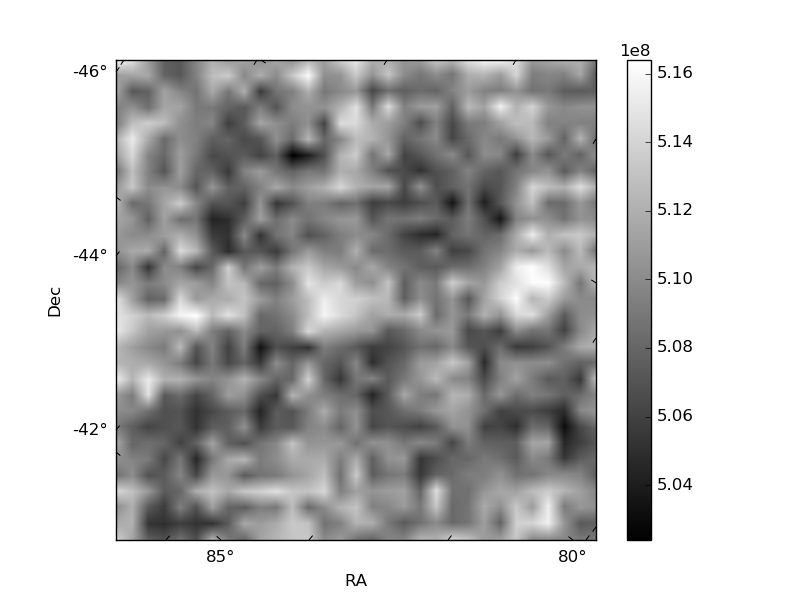
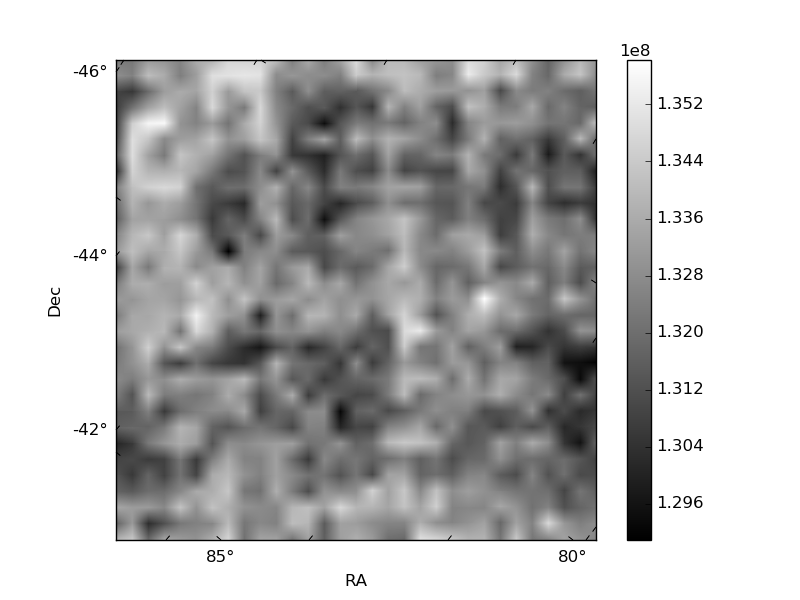
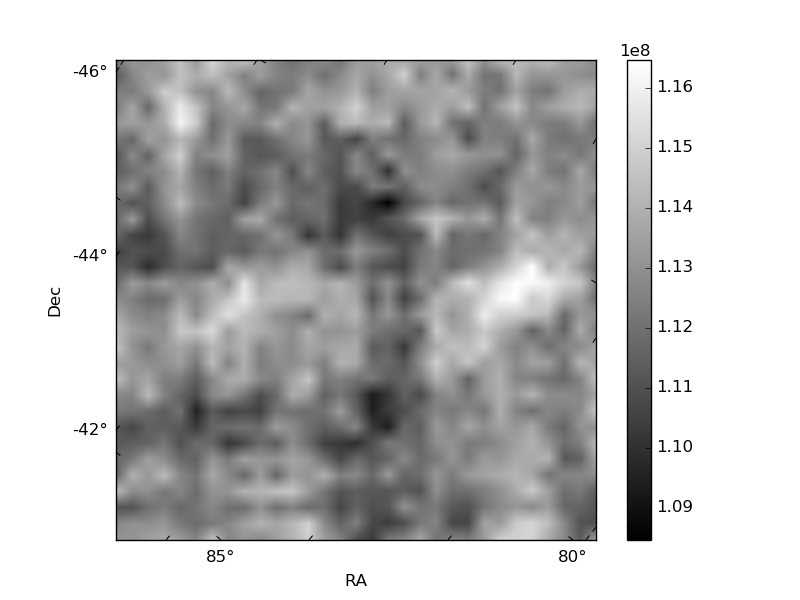
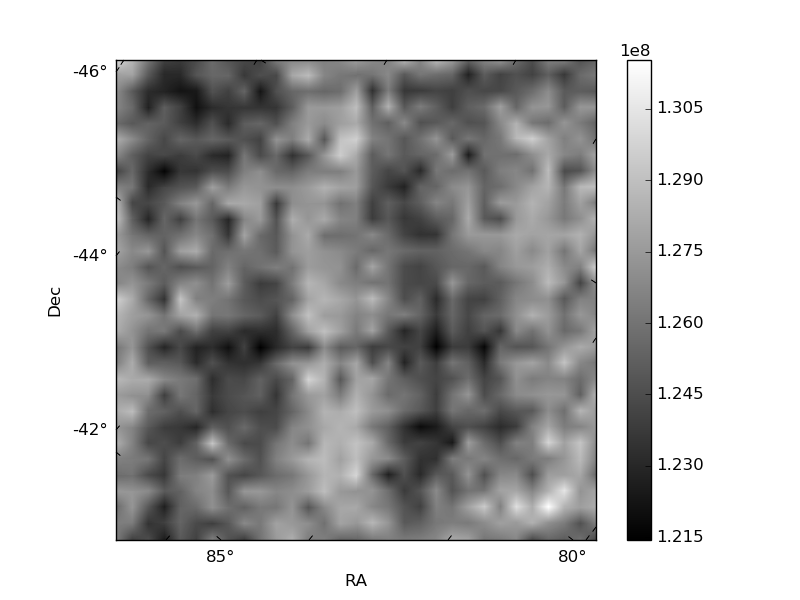
Histogram calculated using DETX and DETY for each event in the final _common_clean file
| Quadrant A | 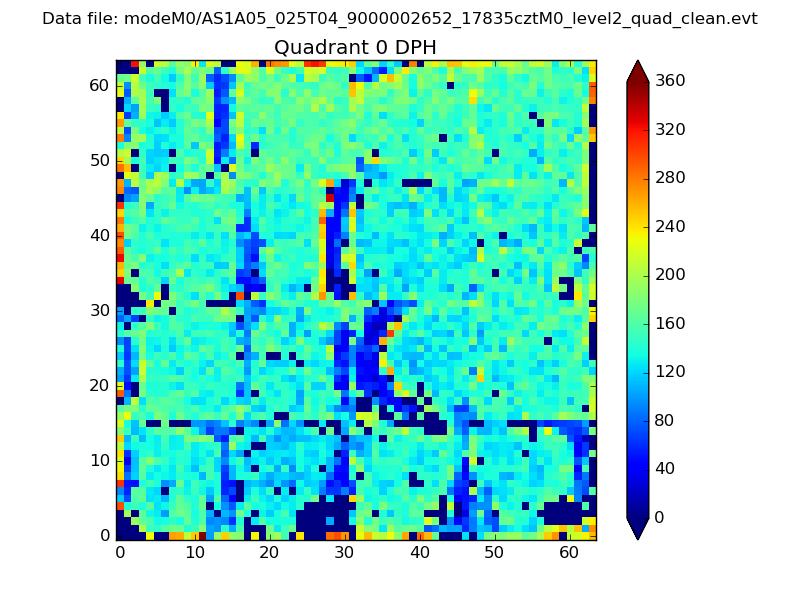 |
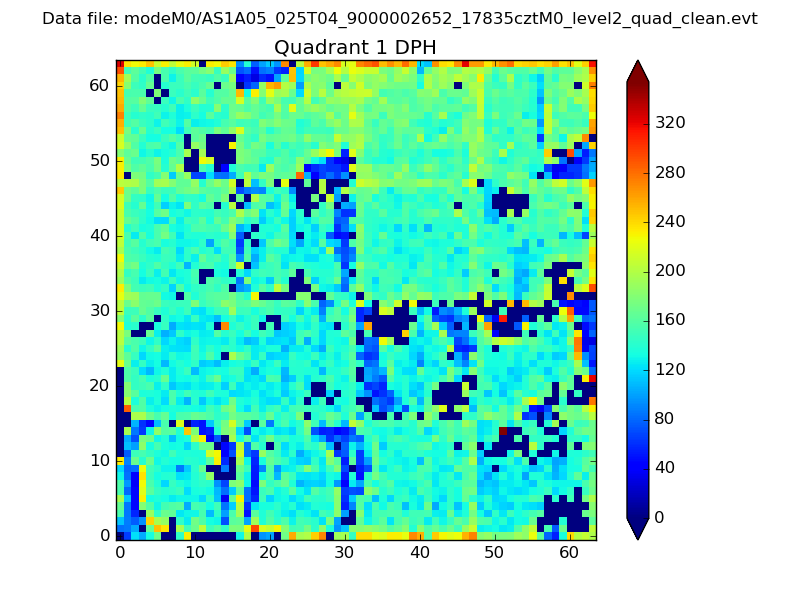 |
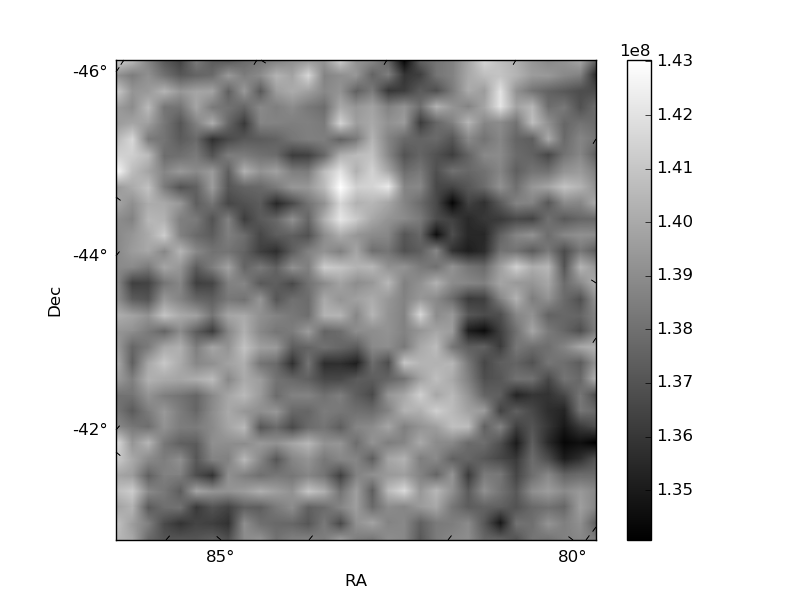
Quadrant B |
|---|---|---|---|
| Quadrant D |  |
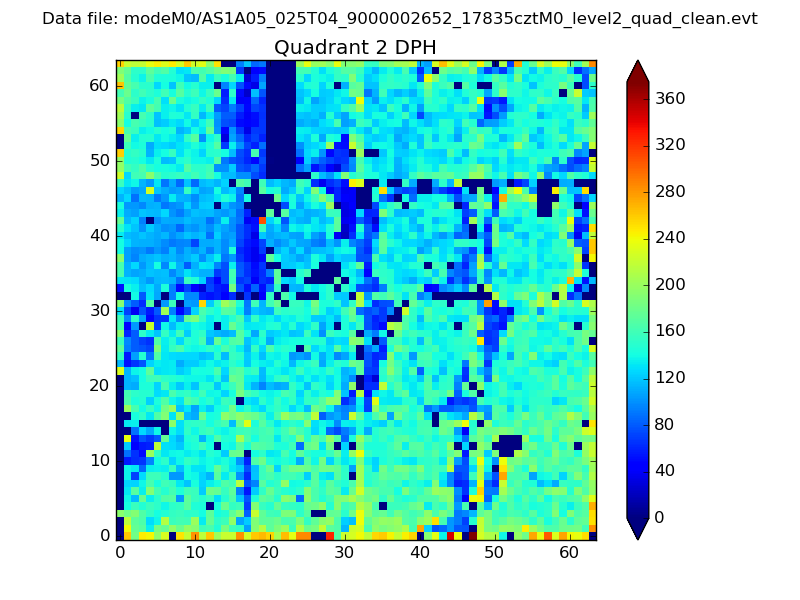 |
Quadrant C |
| Plot type | Count rate plots | Images |
|---|---|---|
| Comparison with Poisson distribution Blue bars denote a histogram of data divided into 1 sec bins. Red curve is a Poisson curve with rate = median count rate of data. |
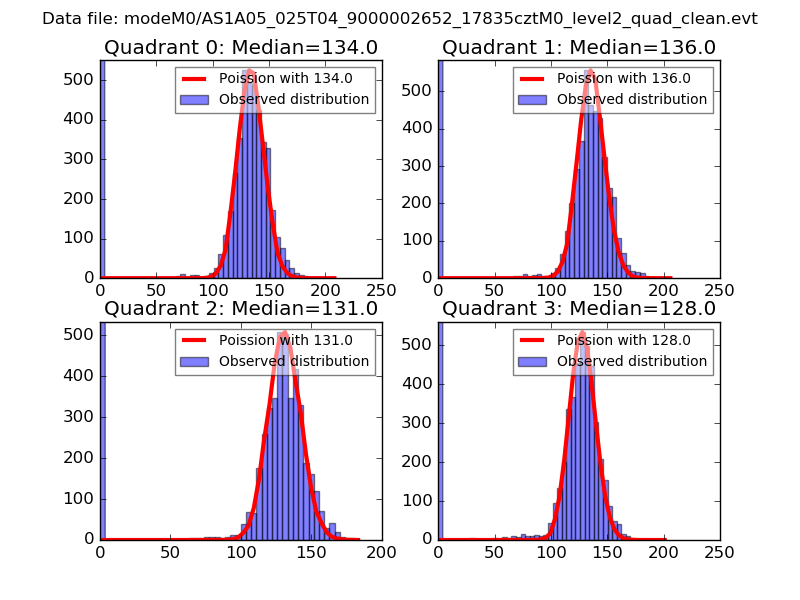 |
 |
| Quadrant-wise count rates Data is divided into 100 sec bins |
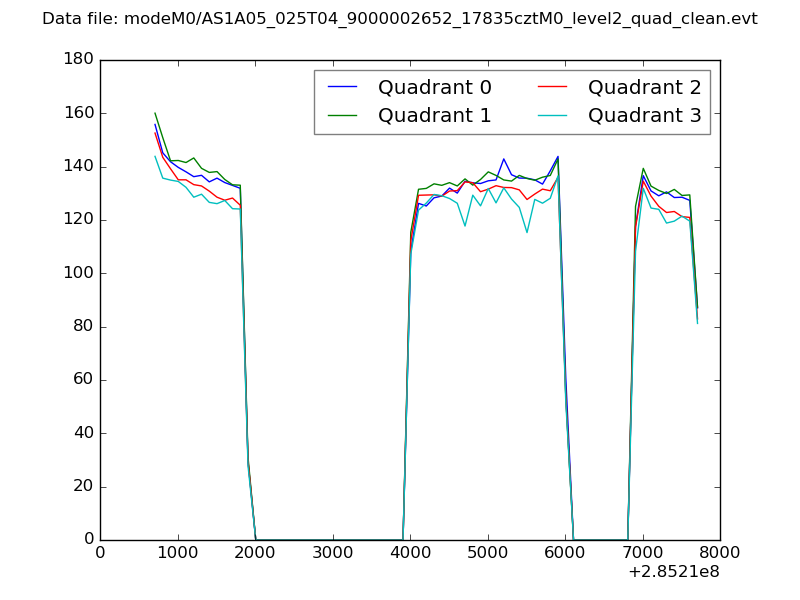 |
|
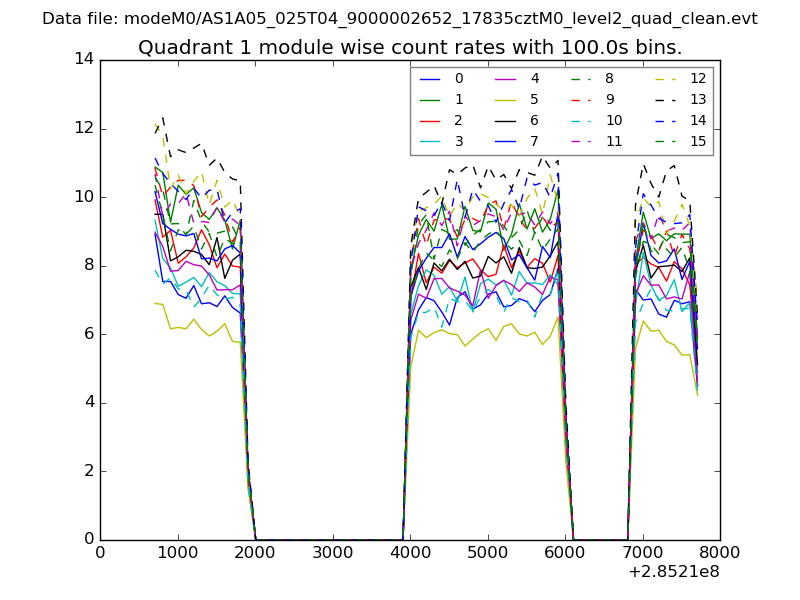
| Module-wise count rates for Quadrant A Data is divided into 100 sec bins |
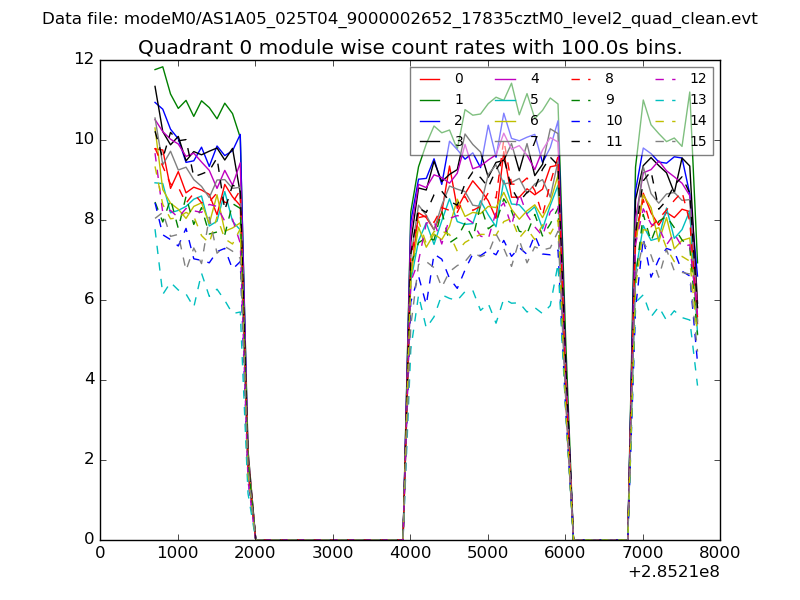 |
 |
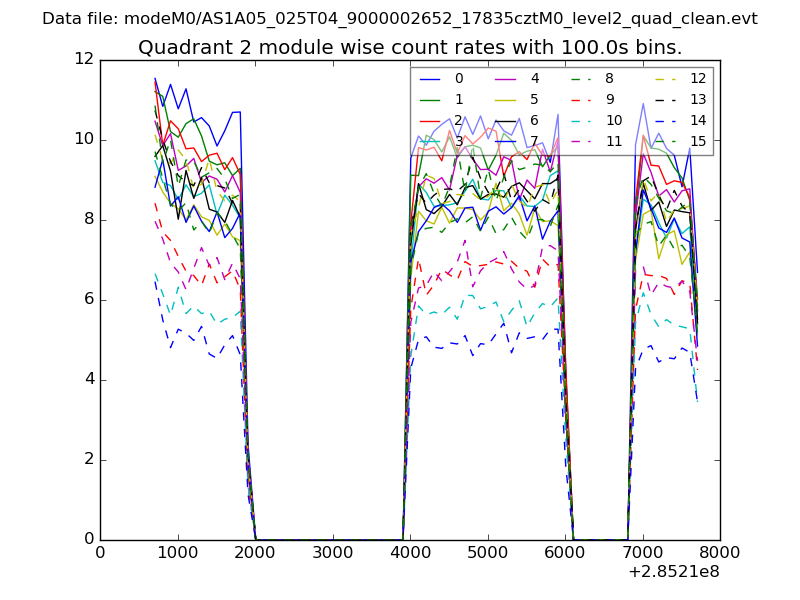
| Module-wise count rates for Quadrant B Data is divided into 100 sec bins |
 |
 |
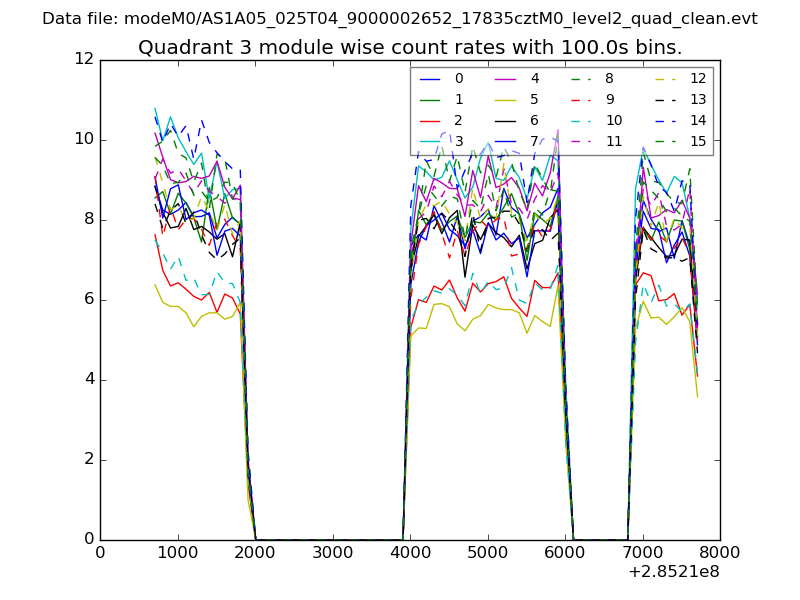
| Module-wise count rates for Quadrant C Data is divided into 100 sec bins |
 |
 |
| Module-wise count rates for Quadrant D Data is divided into 100 sec bins |
 |
 |
| Parameter | Plot |
|---|---|
| CZT HV Monitor | 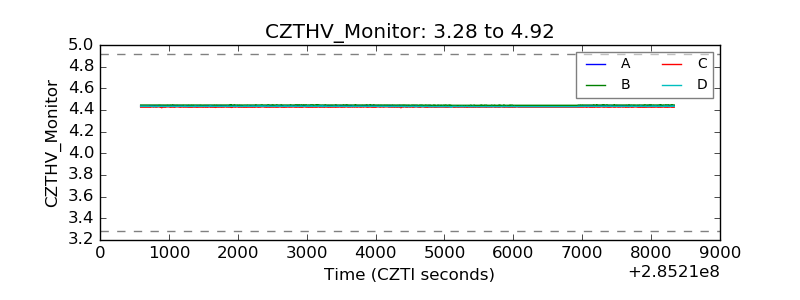 |
| D_VDD | 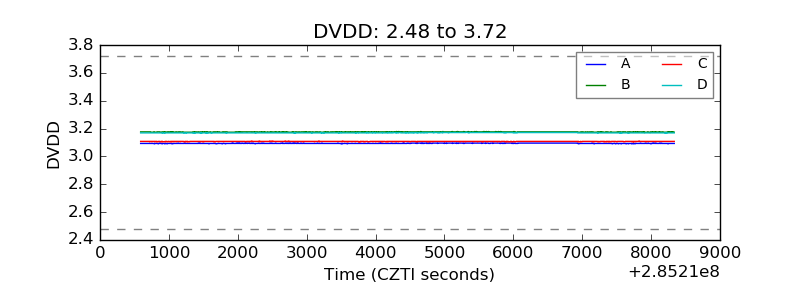 |
| Temperature 1 | 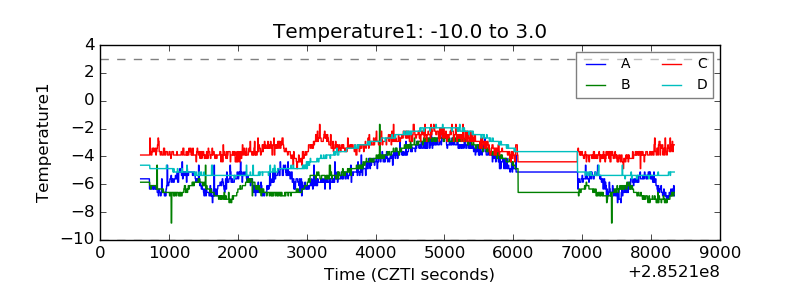 |
| Veto HV Monitor | 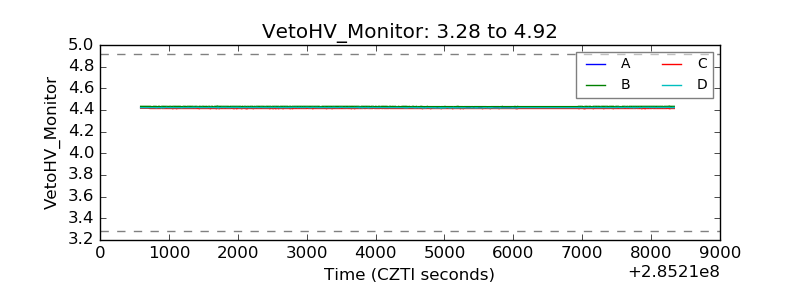 |
| Veto LLD |  |
| Alpha Counter | 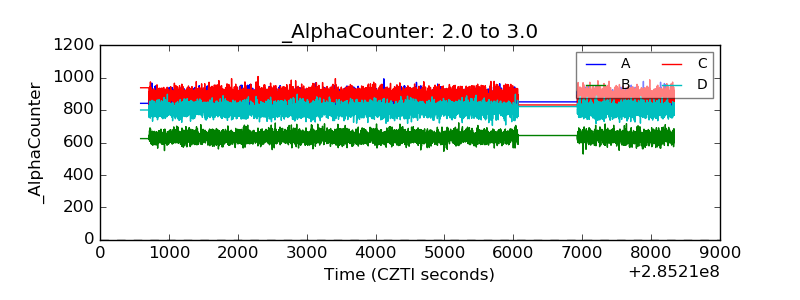 |
| _CPM_Rate | 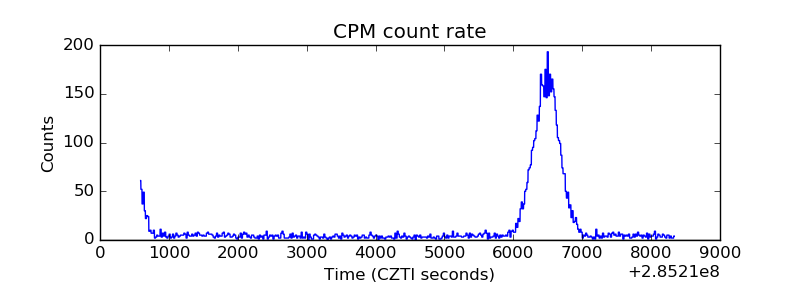 |
| CZT Counter | 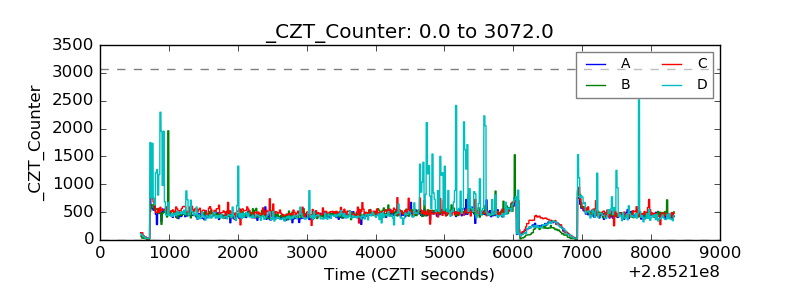 |
| +2.5 Volts monitor |  |
| +5 Volts monitor |  |
| _ROLL_ROT | 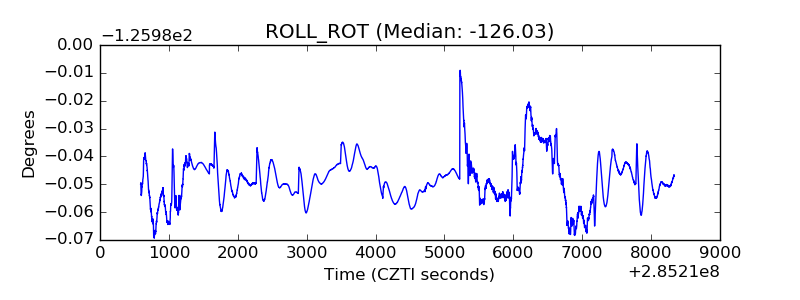 |
| _Roll_DEC | 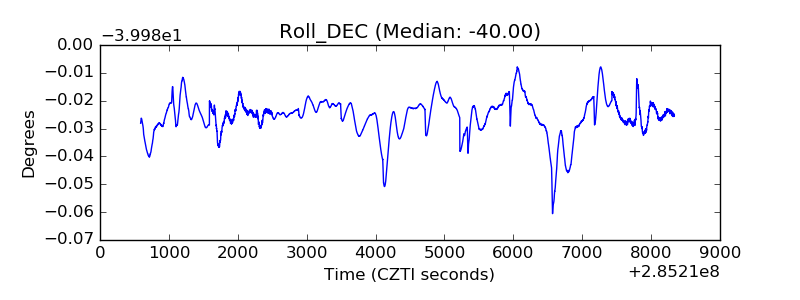 |
| _Roll_RA | 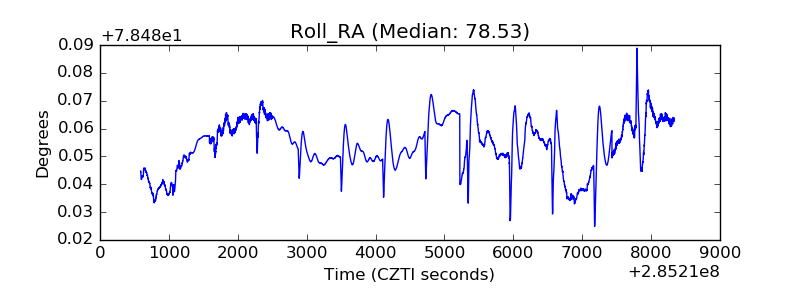 |
| Veto Counter | 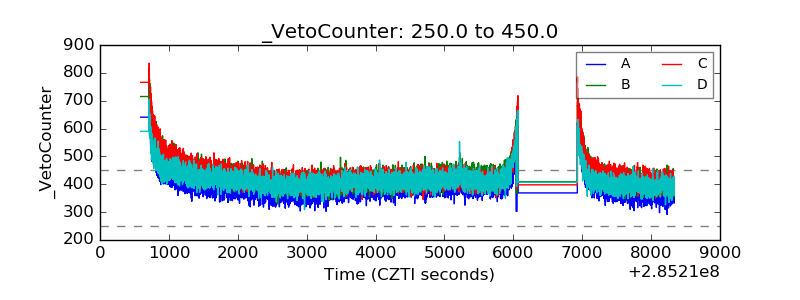 |