| Param | Original file | Final file |
|---|---|---|
| Filename | modeM0/AS1A05_025T04_9000002652_17836cztM0_level2.evt | modeM0/AS1A05_025T04_9000002652_17836cztM0_level2_quad_clean.evt |
| Size (bytes) | 386,930,880 | 70,102,080 |
| Size | 369.0 MB | 66.9 MB |
| Events in quadrant A | 2,554,859 | 444,713 |
| Events in quadrant B | 2,904,319 | 444,564 |
| Events in quadrant C | 2,610,474 | 431,968 |
| Events in quadrant D | 3,273,159 | 415,557 |
| Mode SS | |||
|---|---|---|---|
| Quadrant | BADHDUFLAG | Total packets | Discarded packets |
| A | 0 | 112 | 0 |
| B | 0 | 112 | 0 |
| C | 0 | 112 | 0 |
| D | 0 | 112 | 0 |
| Mode M0 | |||
|---|---|---|---|
| Quadrant | BADHDUFLAG | Total packets | Discarded packets |
| A | 0 | 11288 | 1 |
| B | 0 | 12206 | 1 |
| C | 0 | 11235 | 1 |
| D | 0 | 13607 | 1 |
| Mode M9 | |||
|---|---|---|---|
| Quadrant | BADHDUFLAG | Total packets | Discarded packets |
| A | 0 | 9 | 0 |
| B | 0 | 9 | 0 |
| C | 0 | 9 | 0 |
| D | 0 | 9 | 0 |
| Quadrant | Total seconds | Saturated seconds | Saturation percentage |
|---|---|---|---|
| A | 5514 | 30 | 0.544070% |
| B | 5515 | 139 | 2.520399% |
| C | 5515 | 58 | 1.051677% |
| D | 5515 | 204 | 3.699003% |
Noise dominated data is calculated using 1-second bins in cleaned event files. If a bin has >2000 counts, and if more than 50% of those come from <1% of pixels, then it is considered to be noise-dominated and hence unusable.
| Quadrant | # 1 sec bins | Bins with >0 counts | Bins with >2000 counts | High rate bins dominated by noise | Noise dominated (total time) | Noise dominated (detector-on time) | Marked lightcurve |
|---|---|---|---|---|---|---|---|
| A | 6389 | 5516 | 2 | 2 | 0.03% | 0.04% |  |
| B | 6390 | 5517 | 53 | 53 | 0.83% | 0.96% |  |
| C | 6390 | 5517 | 0 | 0 | 0.00% | 0.00% |  |
| D | 6390 | 5517 | 155 | 155 | 2.43% | 2.81% |  |
Top three noisy pixels from each quadrant. If the there are fewer than three noisy pixels in the level2.evt file, extra rows are filled as -1
| Pixel properties | Quadrant properties | ||||||
|---|---|---|---|---|---|---|---|
| Quadrant | DetID | PixID | Counts | Sigma | Mean | Median | Sigma |
| A | 15 | 174 | 49413 | 373.22 | 651 | 637 | 130.7 |
| A | 0 | 226 | 5679 | 38.58 | 651 | 637 | 130.7 |
| A | 3 | 137 | 4921 | 32.78 | 651 | 637 | 130.7 |
| B | 10 | 245 | 314076 | 2488.06 | 650 | 633 | 126.0 |
| B | 15 | 222 | 25738 | 199.28 | 650 | 633 | 126.0 |
| B | 12 | 111 | 14994 | 114.0 | 650 | 633 | 126.0 |
| C | 14 | 238 | 97513 | 662.76 | 626 | 630 | 146.2 |
| C | 13 | 62 | 43954 | 296.37 | 626 | 630 | 146.2 |
| C | 5 | 218 | 21551 | 143.12 | 626 | 630 | 146.2 |
| D | 7 | 238 | 843931 | 5538.87 | 625 | 607 | 152.3 |
| D | 10 | 70 | 36404 | 235.11 | 625 | 607 | 152.3 |
| D | 2 | 234 | 21142 | 134.87 | 625 | 607 | 152.3 |
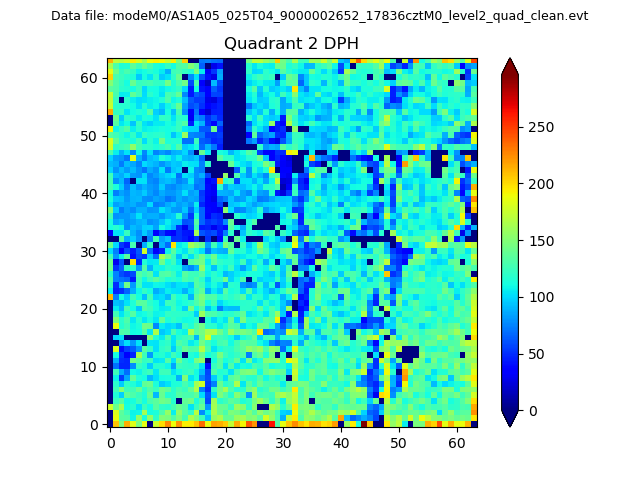
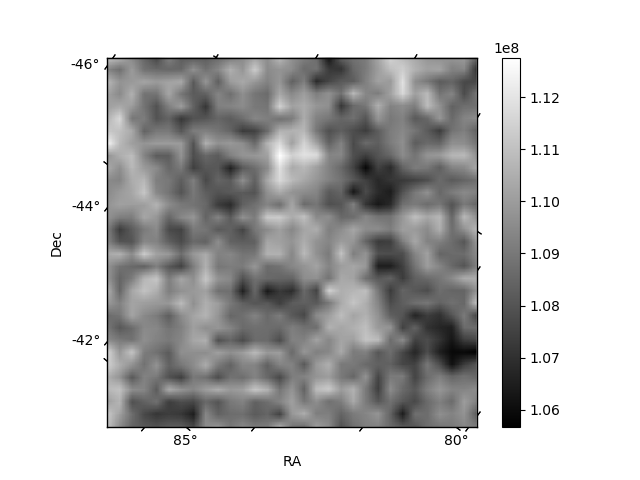
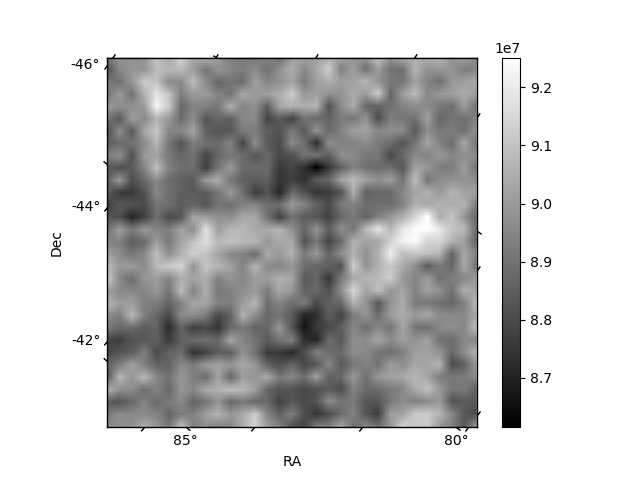
Histogram calculated using DETX and DETY for each event in the final _common_clean file
| Quadrant A | 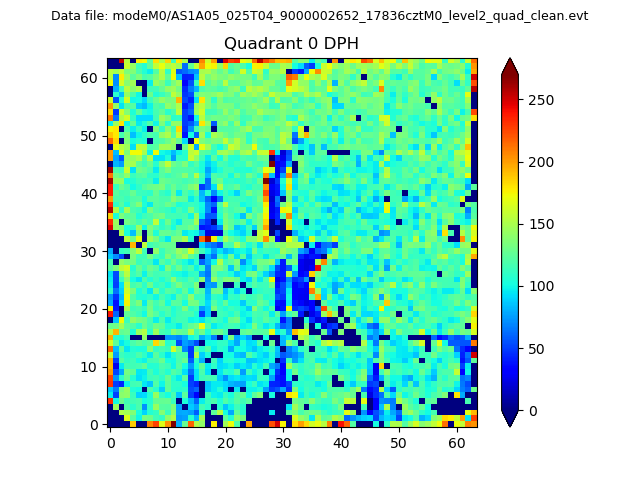 |
 |
Quadrant B |
|---|---|---|---|
| Quadrant D | 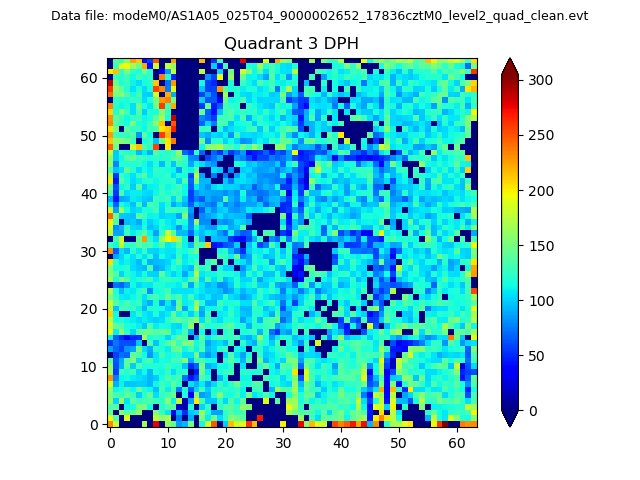 |
 |
Quadrant C |
| Plot type | Count rate plots | Images |
|---|---|---|
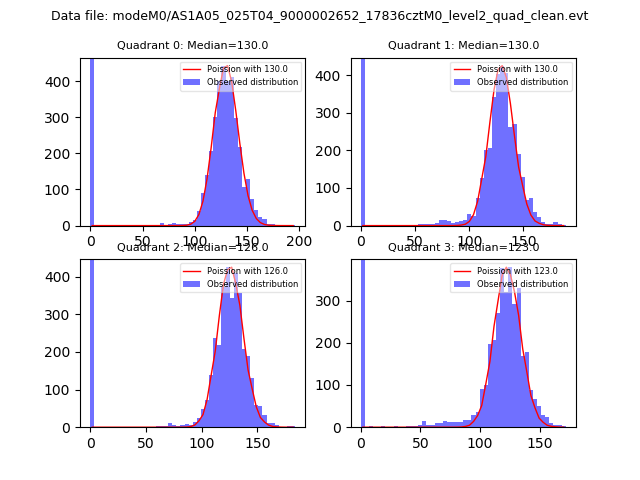
| Comparison with Poisson distribution Blue bars denote a histogram of data divided into 1 sec bins. Red curve is a Poisson curve with rate = median count rate of data. |
 |
 |
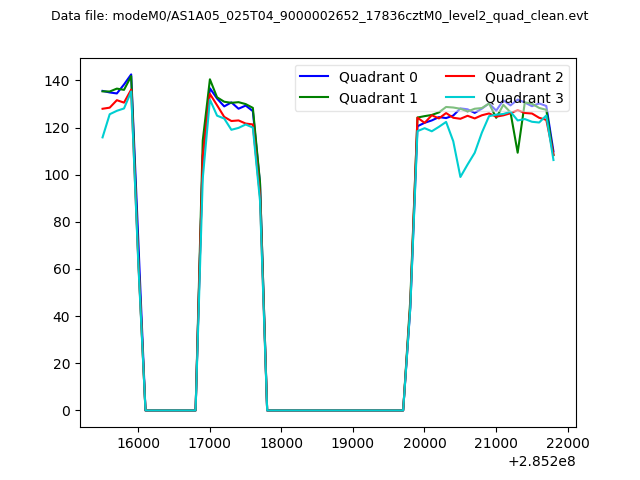
| Quadrant-wise count rates Data is divided into 100 sec bins |
 |
|
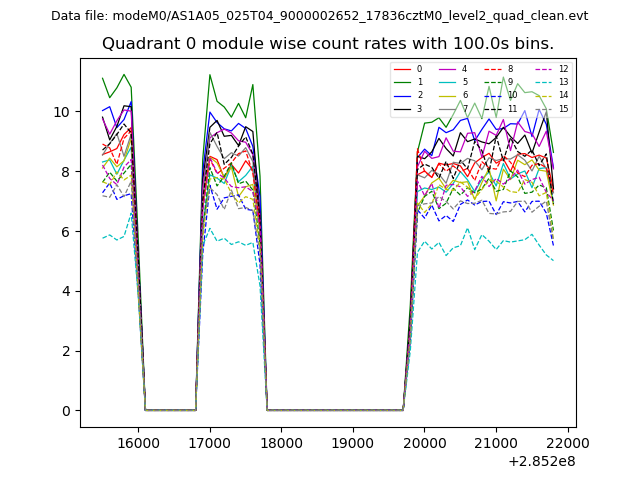
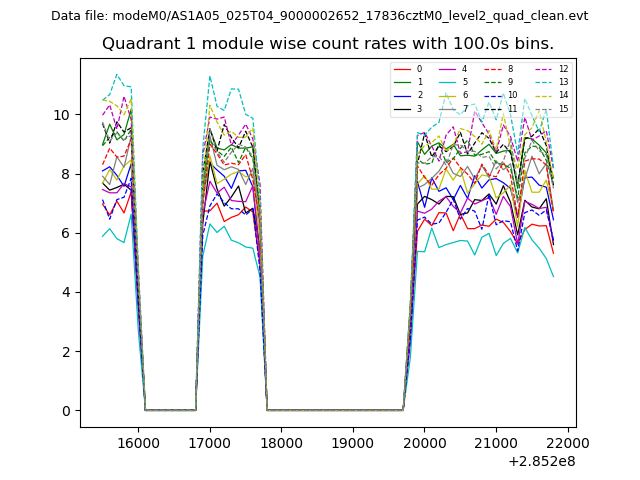
| Module-wise count rates for Quadrant A Data is divided into 100 sec bins |
 |
 |
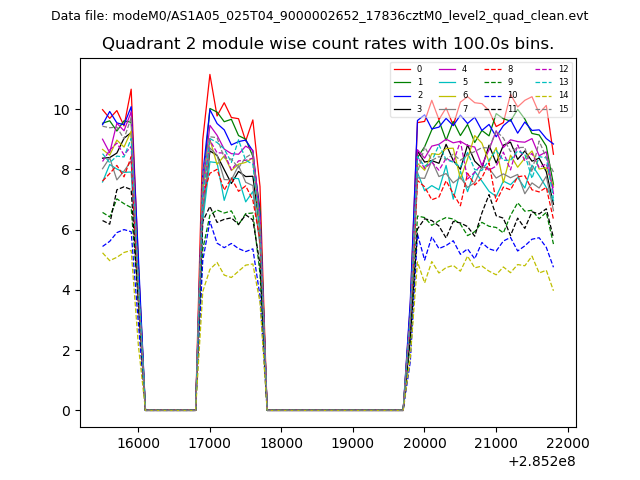
| Module-wise count rates for Quadrant B Data is divided into 100 sec bins |
 |
 |
| Module-wise count rates for Quadrant C Data is divided into 100 sec bins |
 |
 |
| Module-wise count rates for Quadrant D Data is divided into 100 sec bins |
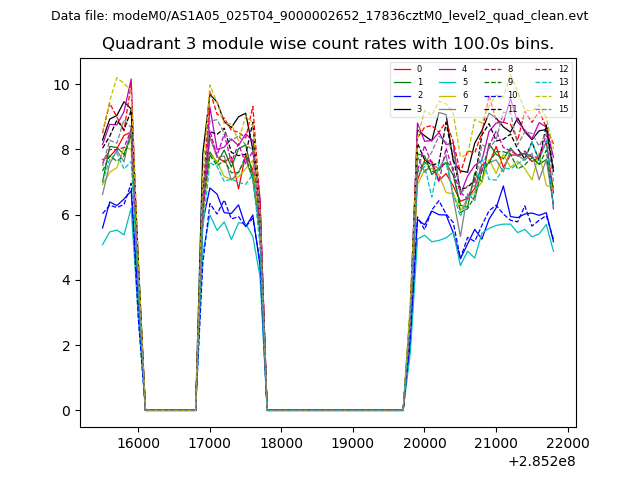 |
 |
| Parameter | Plot |
|---|---|
| CZT HV Monitor |  |
| D_VDD | 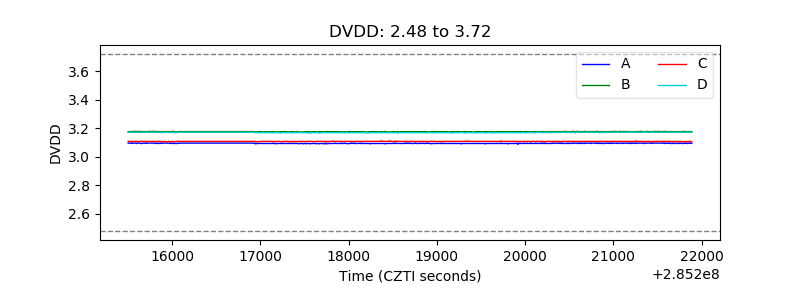 |
| Temperature 1 | 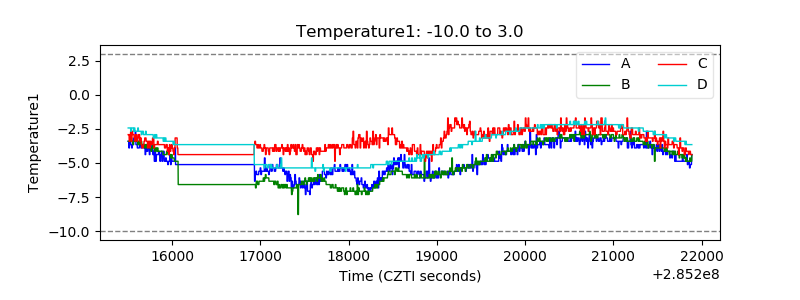 |
| Veto HV Monitor | 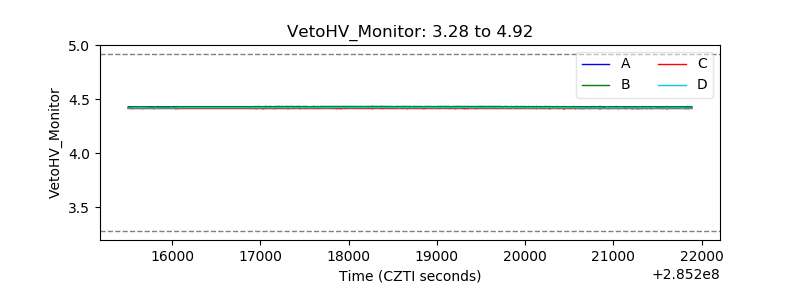 |
| Veto LLD |  |
| Alpha Counter | 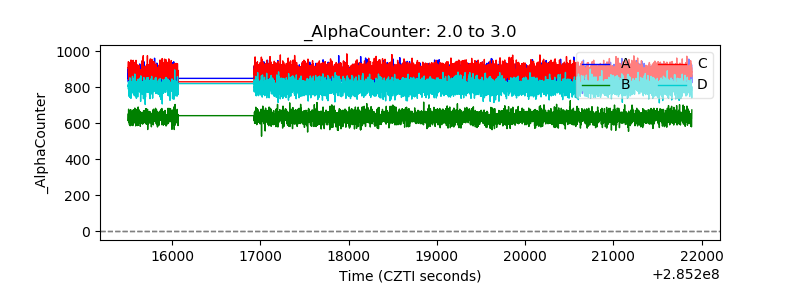 |
| _CPM_Rate | 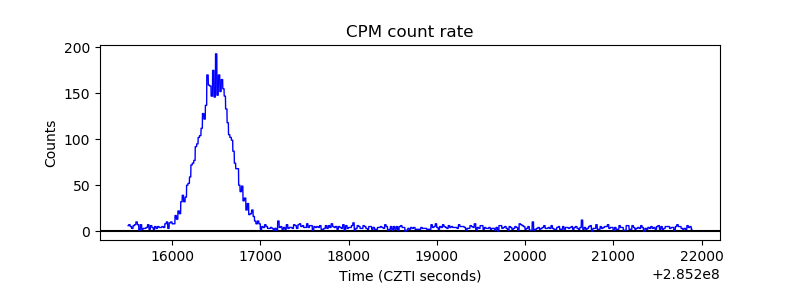 |
| CZT Counter | 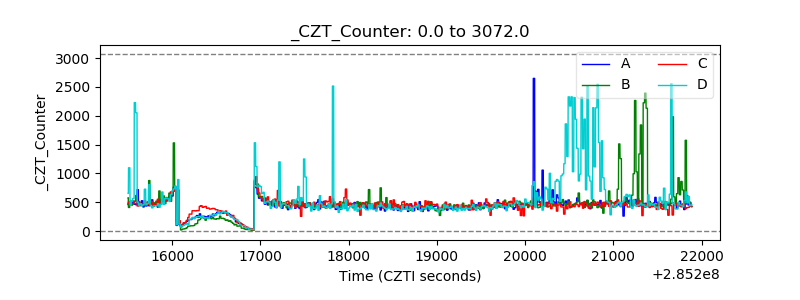 |
| +2.5 Volts monitor |  |
| +5 Volts monitor |  |
| _ROLL_ROT | 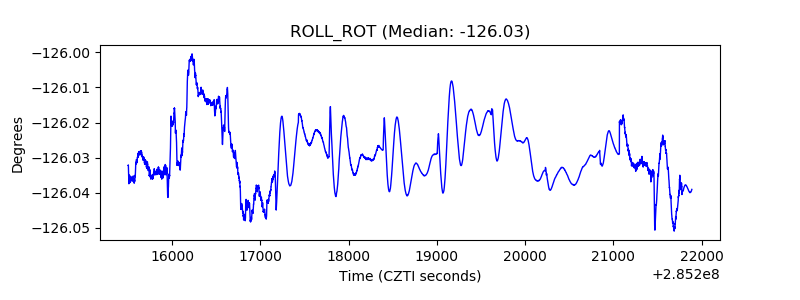 |
| _Roll_DEC | 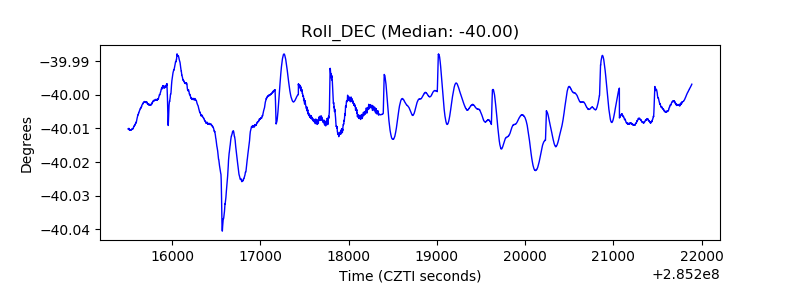 |
| _Roll_RA | 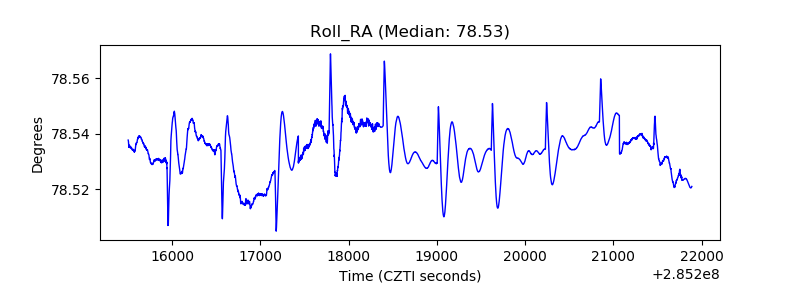 |
| Veto Counter | 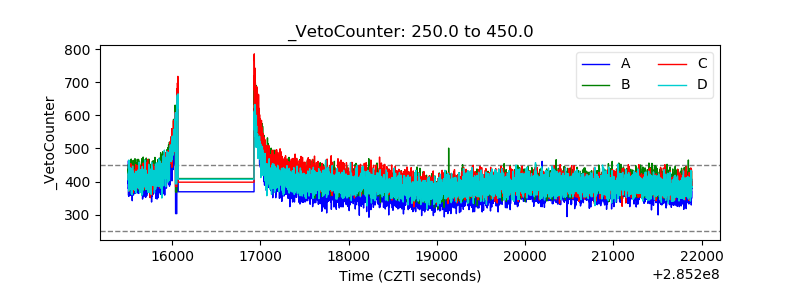 |