| Param | Original file | Final file |
|---|---|---|
| Filename | modeM0/AS1A05_085T01_9000002658_17846cztM0_level2.evt | modeM0/AS1A05_085T01_9000002658_17846cztM0_level2_quad_clean.evt |
| Size (bytes) | 330,851,520 | 57,637,440 |
| Size | 315.5 MB | 55.0 MB |
| Events in quadrant A | 2,212,323 | 369,910 |
| Events in quadrant B | 2,307,205 | 377,886 |
| Events in quadrant C | 2,246,092 | 355,435 |
| Events in quadrant D | 2,947,488 | 325,522 |
| Mode SS | |||
|---|---|---|---|
| Quadrant | BADHDUFLAG | Total packets | Discarded packets |
| A | 0 | 92 | 0 |
| B | 0 | 92 | 0 |
| C | 0 | 92 | 0 |
| D | 0 | 92 | 0 |
| Mode M9 | |||
|---|---|---|---|
| Quadrant | BADHDUFLAG | Total packets | Discarded packets |
| A | 0 | 13 | 0 |
| B | 0 | 13 | 0 |
| C | 0 | 13 | 0 |
| D | 0 | 13 | 0 |
| Mode M0 | |||
|---|---|---|---|
| Quadrant | BADHDUFLAG | Total packets | Discarded packets |
| A | 0 | 9522 | 1 |
| B | 0 | 9672 | 1 |
| C | 0 | 9493 | 2 |
| D | 0 | 11878 | 1 |
| Quadrant | Total seconds | Saturated seconds | Saturation percentage |
|---|---|---|---|
| A | 4498 | 61 | 1.356158% |
| B | 4498 | 73 | 1.622944% |
| C | 4497 | 74 | 1.645541% |
| D | 4497 | 274 | 6.092951% |
Noise dominated data is calculated using 1-second bins in cleaned event files. If a bin has >2000 counts, and if more than 50% of those come from <1% of pixels, then it is considered to be noise-dominated and hence unusable.
| Quadrant | # 1 sec bins | Bins with >0 counts | Bins with >2000 counts | High rate bins dominated by noise | Noise dominated (total time) | Noise dominated (detector-on time) | Marked lightcurve |
|---|---|---|---|---|---|---|---|
| A | 5813 | 4499 | 0 | 0 | 0.00% | 0.00% | 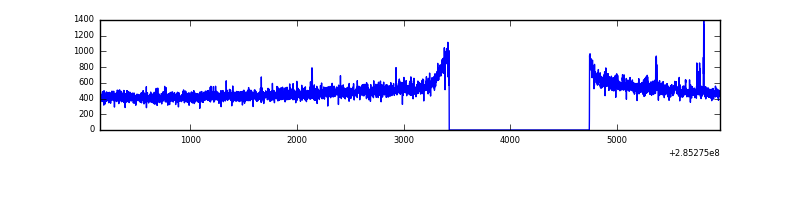 |
| B | 5813 | 4499 | 2 | 2 | 0.03% | 0.04% | 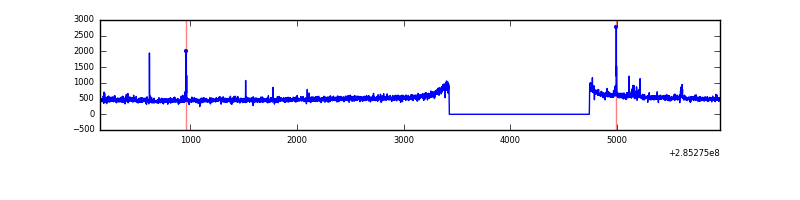 |
| C | 5812 | 4498 | 0 | 0 | 0.00% | 0.00% | 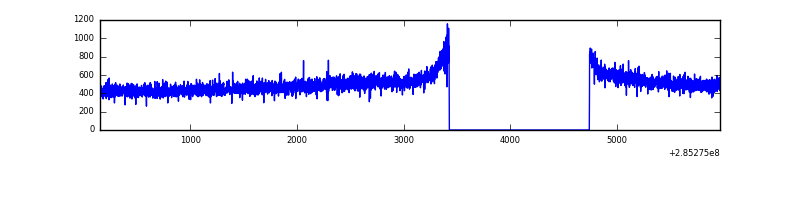 |
| D | 5811 | 4497 | 225 | 225 | 3.87% | 5.00% | 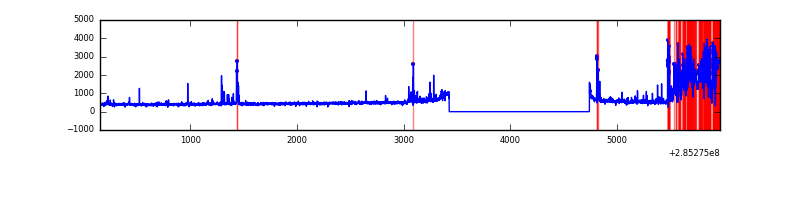 |
Top three noisy pixels from each quadrant. If the there are fewer than three noisy pixels in the level2.evt file, extra rows are filled as -1
| Pixel properties | Quadrant properties | ||||||
|---|---|---|---|---|---|---|---|
| Quadrant | DetID | PixID | Counts | Sigma | Mean | Median | Sigma |
| A | 15 | 174 | 15338 | 128.6 | 569 | 559 | 114.9 |
| A | 5 | 98 | 7284 | 58.52 | 569 | 559 | 114.9 |
| A | 0 | 226 | 4928 | 38.02 | 569 | 559 | 114.9 |
| B | 0 | 219 | 21506 | 190.15 | 576 | 563 | 110.1 |
| B | 0 | 197 | 17909 | 157.49 | 576 | 563 | 110.1 |
| B | 12 | 111 | 12622 | 109.49 | 576 | 563 | 110.1 |
| C | 14 | 238 | 86735 | 672.78 | 550 | 555 | 128.1 |
| C | 5 | 218 | 8007 | 58.18 | 550 | 555 | 128.1 |
| C | 8 | 208 | 4479 | 30.63 | 550 | 555 | 128.1 |
| D | 7 | 238 | 830593 | 6089.13 | 533 | 519 | 136.3 |
| D | 1 | 52 | 44094 | 319.65 | 533 | 519 | 136.3 |
| D | 10 | 70 | 28160 | 202.76 | 533 | 519 | 136.3 |
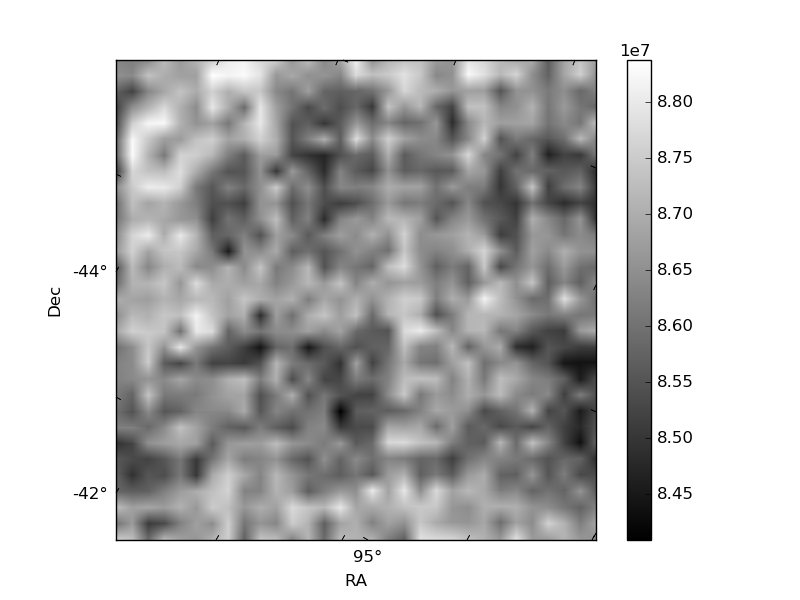
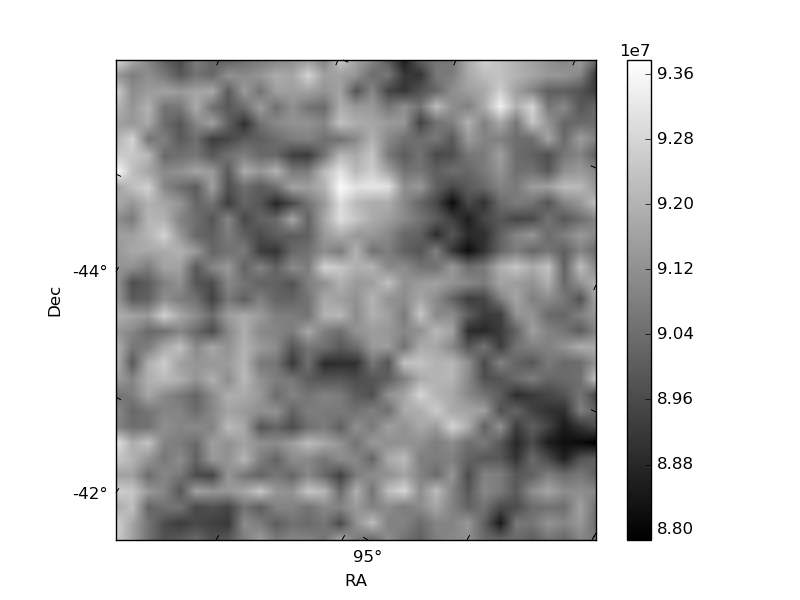
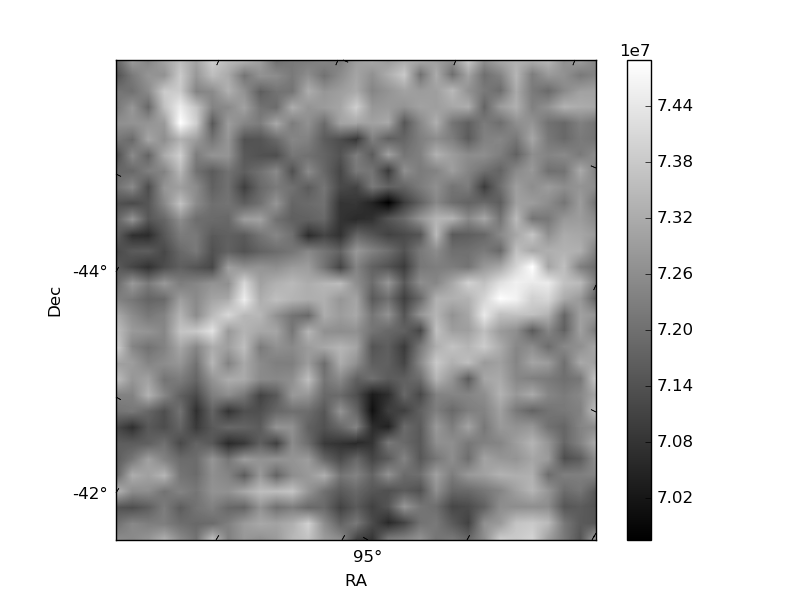
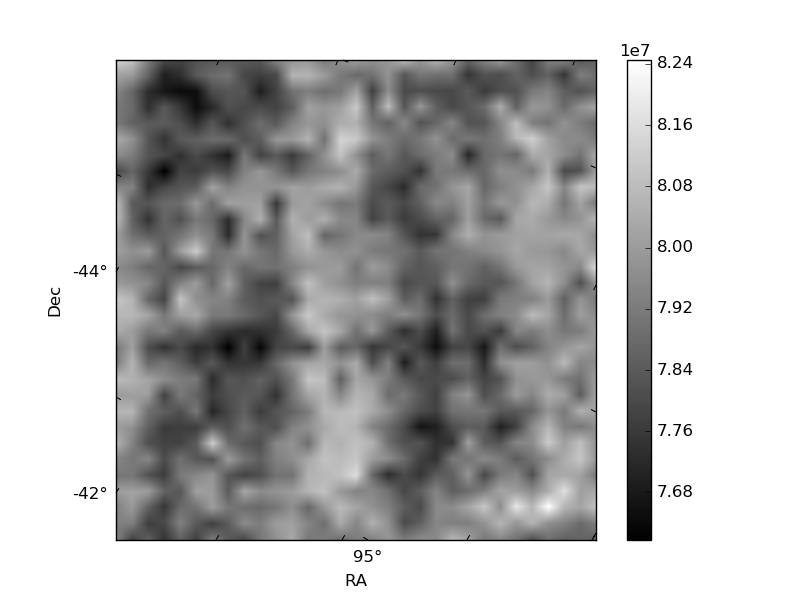
Histogram calculated using DETX and DETY for each event in the final _common_clean file
| Quadrant A | 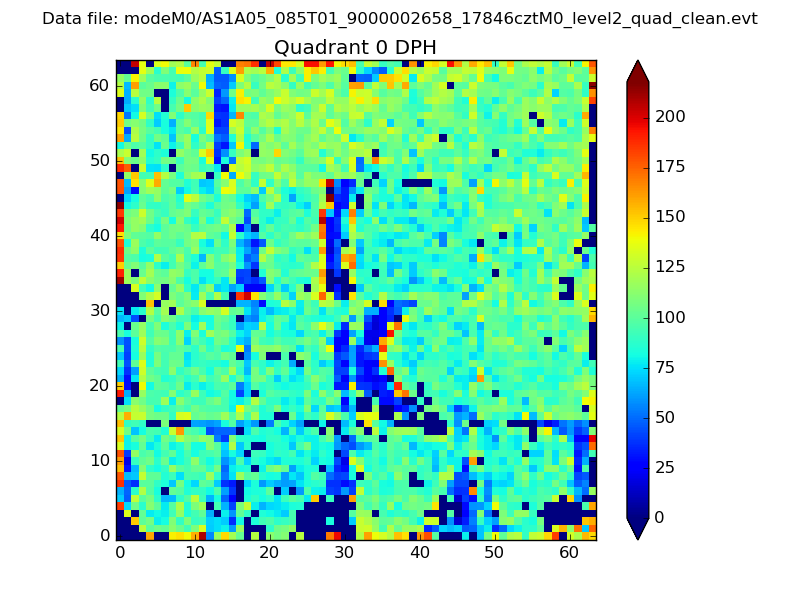 |
 |
Quadrant B |
|---|---|---|---|
| Quadrant D | 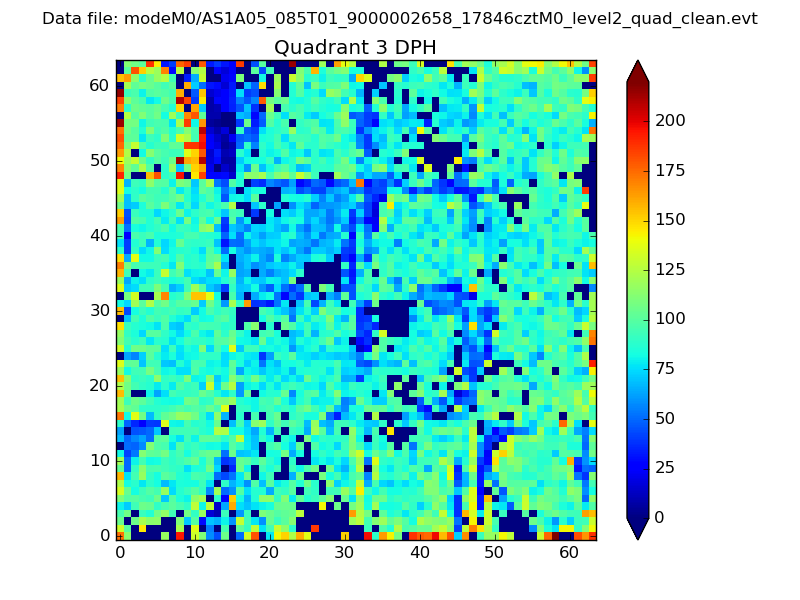 |
 |
Quadrant C |
| Plot type | Count rate plots | Images |
|---|---|---|
| Comparison with Poisson distribution Blue bars denote a histogram of data divided into 1 sec bins. Red curve is a Poisson curve with rate = median count rate of data. |
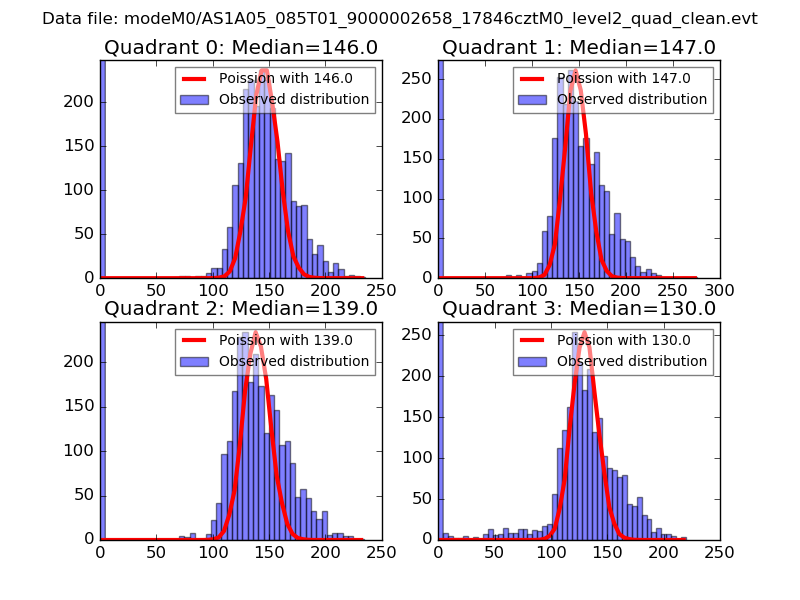 |
 |
| Quadrant-wise count rates Data is divided into 100 sec bins |
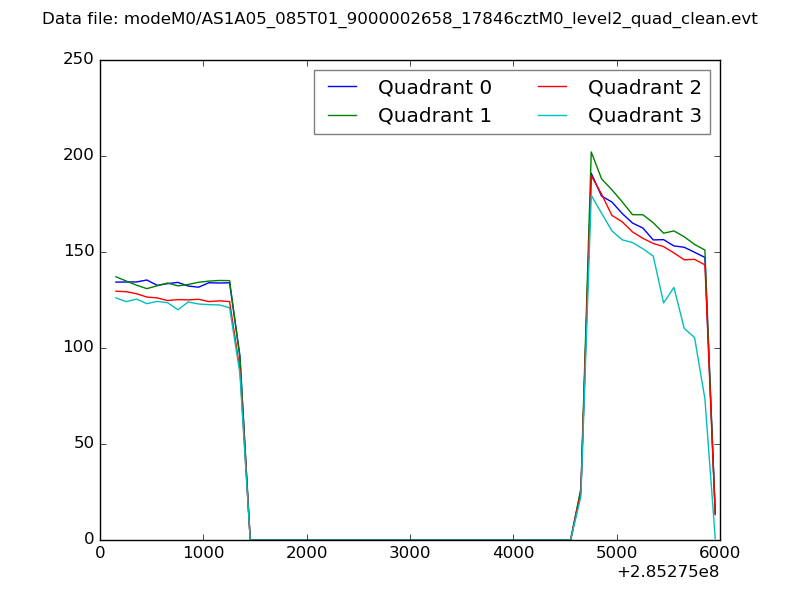 |
|
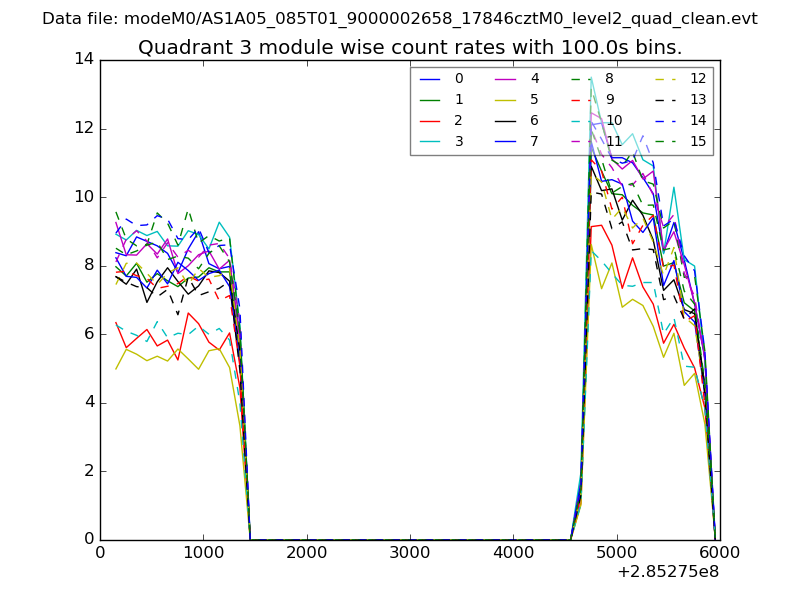
| Module-wise count rates for Quadrant A Data is divided into 100 sec bins |
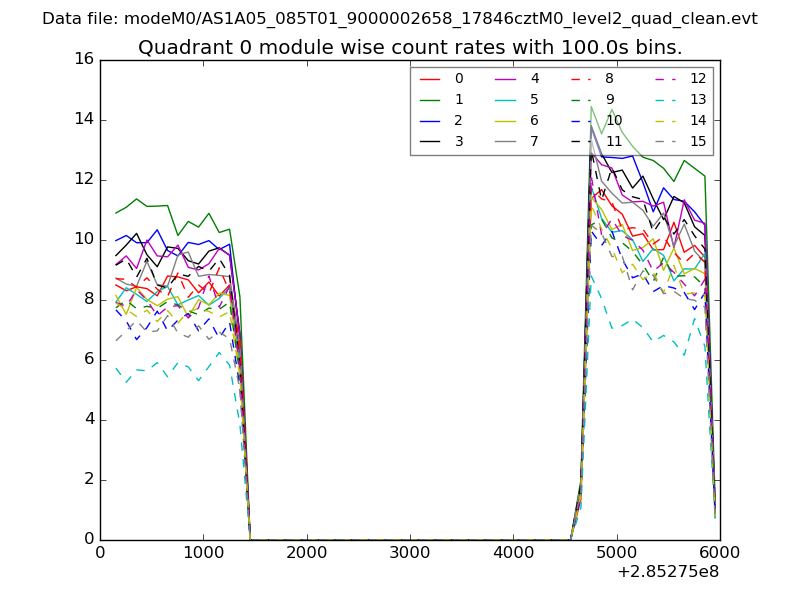 |
 |
| Module-wise count rates for Quadrant B Data is divided into 100 sec bins |
 |
 |
| Module-wise count rates for Quadrant C Data is divided into 100 sec bins |
 |
 |
| Module-wise count rates for Quadrant D Data is divided into 100 sec bins |
 |
 |
| Parameter | Plot |
|---|---|
| CZT HV Monitor |  |
| D_VDD | 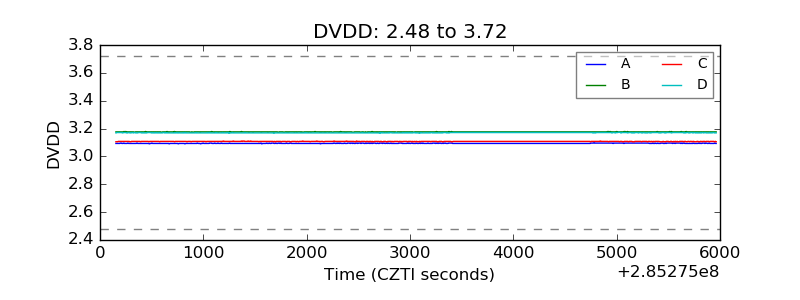 |
| Temperature 1 | 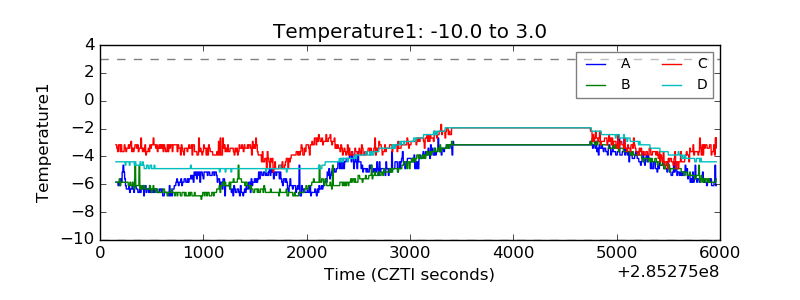 |
| Veto HV Monitor | 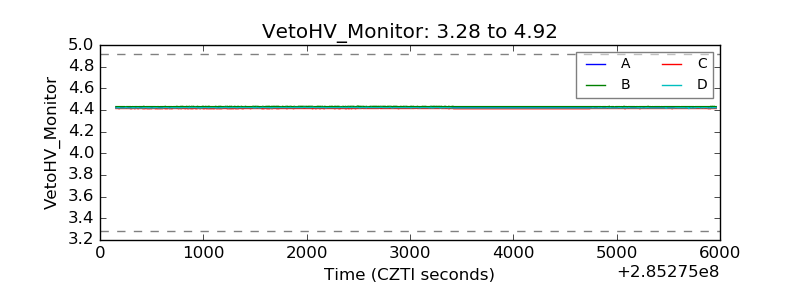 |
| Veto LLD | 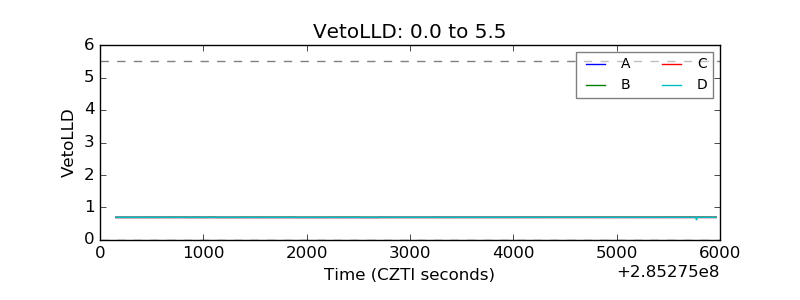 |
| Alpha Counter |  |
| _CPM_Rate | 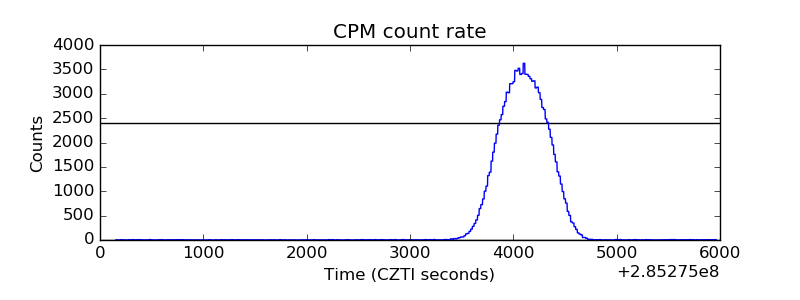 |
| CZT Counter |  |
| +2.5 Volts monitor |  |
| +5 Volts monitor |  |
| _ROLL_ROT | 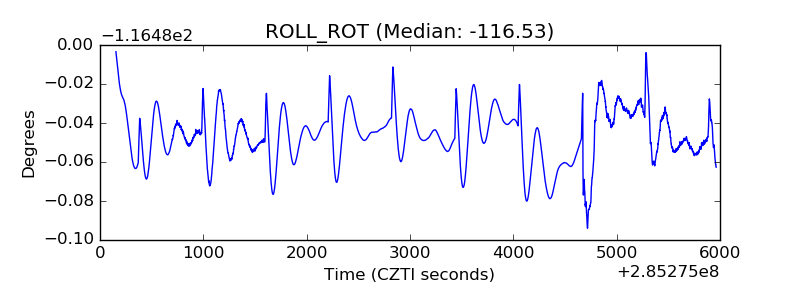 |
| _Roll_DEC | 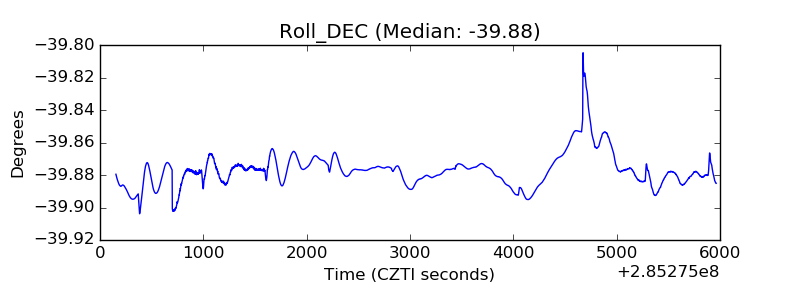 |
| _Roll_RA | 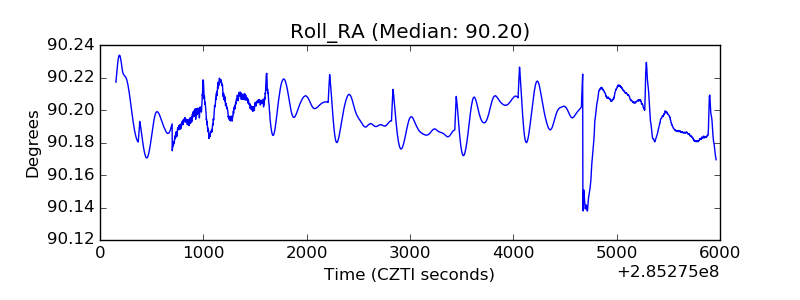 |
| Veto Counter | 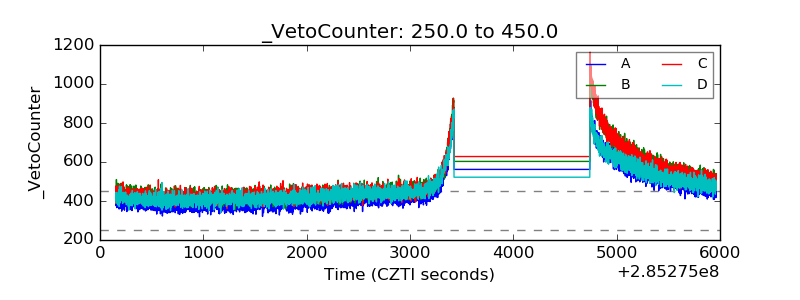 |