| Param | Original file | Final file |
|---|---|---|
| Filename | modeM0/AS1A05_085T01_9000002658_17847cztM0_level2.evt | modeM0/AS1A05_085T01_9000002658_17847cztM0_level2_quad_clean.evt |
| Size (bytes) | 604,647,360 | 95,898,240 |
| Size | 576.6 MB | 91.5 MB |
| Events in quadrant A | 3,124,649 | 649,682 |
| Events in quadrant B | 3,280,478 | 670,920 |
| Events in quadrant C | 3,227,788 | 632,733 |
| Events in quadrant D | 8,247,434 | 506,071 |
| Mode SS | |||
|---|---|---|---|
| Quadrant | BADHDUFLAG | Total packets | Discarded packets |
| A | 0 | 128 | 0 |
| B | 0 | 128 | 0 |
| C | 0 | 128 | 0 |
| D | 0 | 128 | 0 |
| Mode M9 | |||
|---|---|---|---|
| Quadrant | BADHDUFLAG | Total packets | Discarded packets |
| A | 0 | 26 | 0 |
| B | 0 | 27 | 0 |
| C | 0 | 27 | 0 |
| D | 0 | 27 | 0 |
| Mode M0 | |||
|---|---|---|---|
| Quadrant | BADHDUFLAG | Total packets | Discarded packets |
| A | 0 | 13389 | 2 |
| B | 0 | 13731 | 2 |
| C | 0 | 13387 | 2 |
| D | 0 | 28683 | 2 |
| Quadrant | Total seconds | Saturated seconds | Saturation percentage |
|---|---|---|---|
| A | 6371 | 19 | 0.298226% |
| B | 6371 | 33 | 0.517972% |
| C | 6370 | 37 | 0.580848% |
| D | 6370 | 1815 | 28.492936% |
Noise dominated data is calculated using 1-second bins in cleaned event files. If a bin has >2000 counts, and if more than 50% of those come from <1% of pixels, then it is considered to be noise-dominated and hence unusable.
| Quadrant | # 1 sec bins | Bins with >0 counts | Bins with >2000 counts | High rate bins dominated by noise | Noise dominated (total time) | Noise dominated (detector-on time) | Marked lightcurve |
|---|---|---|---|---|---|---|---|
| A | 7806 | 6372 | 0 | 0 | 0.00% | 0.00% | 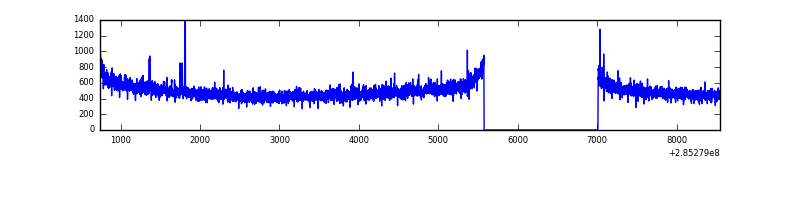 |
| B | 7806 | 6372 | 2 | 2 | 0.03% | 0.03% | 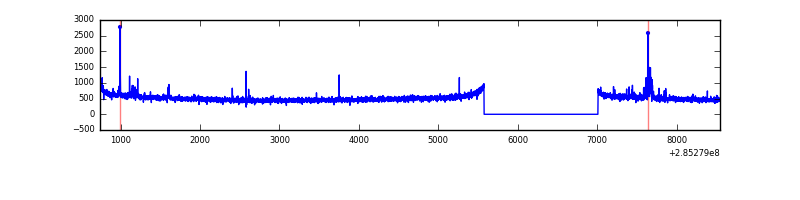 |
| C | 7805 | 6371 | 0 | 0 | 0.00% | 0.00% | 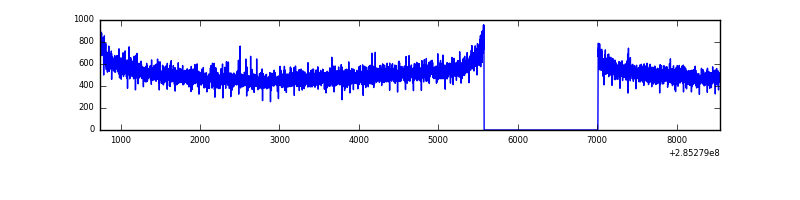 |
| D | 7805 | 6371 | 1667 | 1667 | 21.36% | 26.17% | 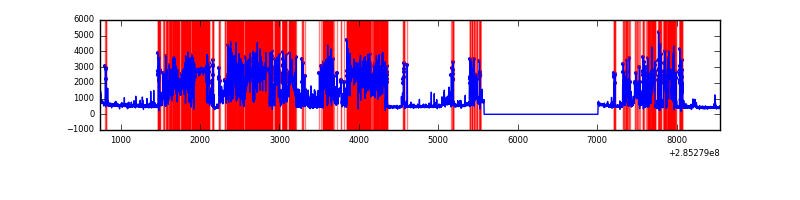 |
Top three noisy pixels from each quadrant. If the there are fewer than three noisy pixels in the level2.evt file, extra rows are filled as -1
| Pixel properties | Quadrant properties | ||||||
|---|---|---|---|---|---|---|---|
| Quadrant | DetID | PixID | Counts | Sigma | Mean | Median | Sigma |
| A | 15 | 174 | 16373 | 96.62 | 806 | 793 | 161.3 |
| A | 5 | 98 | 7533 | 41.8 | 806 | 793 | 161.3 |
| A | 0 | 226 | 7283 | 40.25 | 806 | 793 | 161.3 |
| B | 0 | 183 | 47292 | 307.33 | 818 | 800 | 151.3 |
| B | 0 | 197 | 18101 | 114.37 | 818 | 800 | 151.3 |
| B | 12 | 111 | 17595 | 111.02 | 818 | 800 | 151.3 |
| C | 14 | 238 | 123114 | 677.01 | 779 | 786 | 180.7 |
| C | 5 | 218 | 45722 | 248.69 | 779 | 786 | 180.7 |
| C | 5 | 219 | 9865 | 50.25 | 779 | 786 | 180.7 |
| D | 7 | 238 | 5634790 | 35116.54 | 665 | 649 | 160.4 |
| D | 1 | 52 | 58867 | 362.86 | 665 | 649 | 160.4 |
| D | 2 | 234 | 23044 | 139.58 | 665 | 649 | 160.4 |
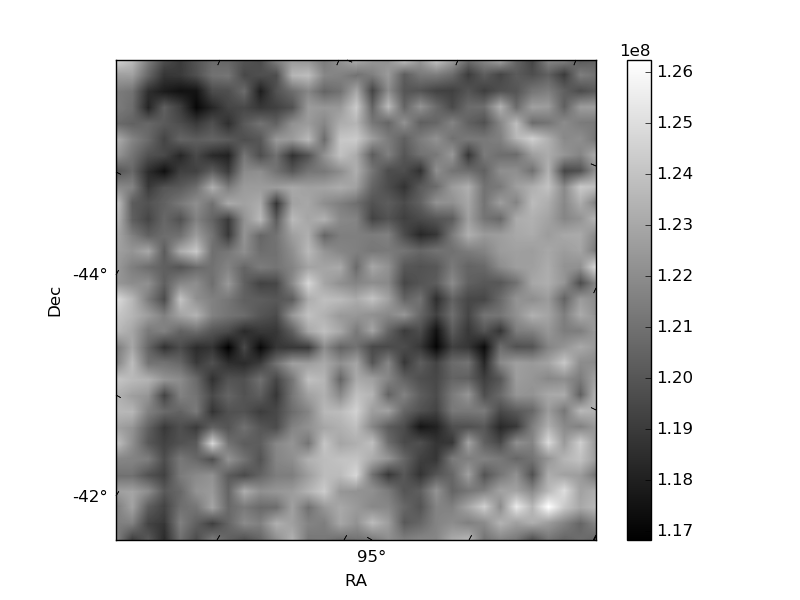
Histogram calculated using DETX and DETY for each event in the final _common_clean file
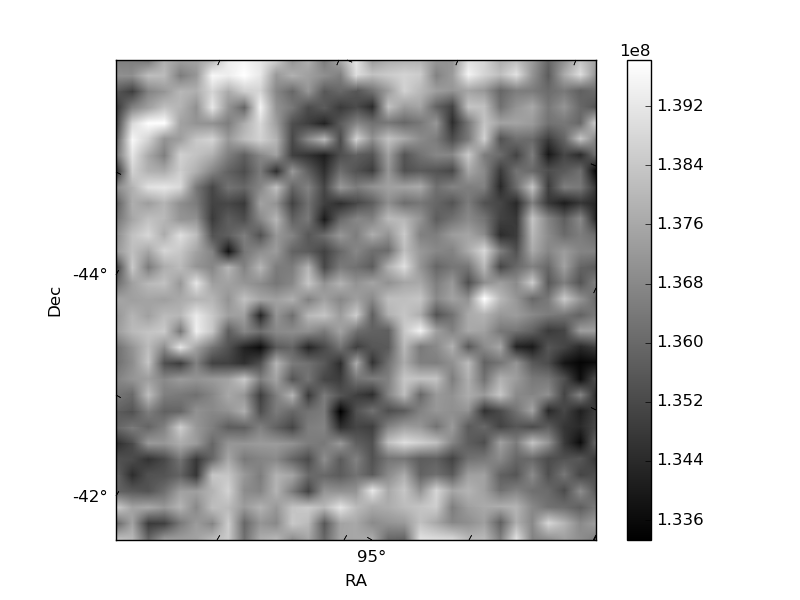
| Quadrant A | 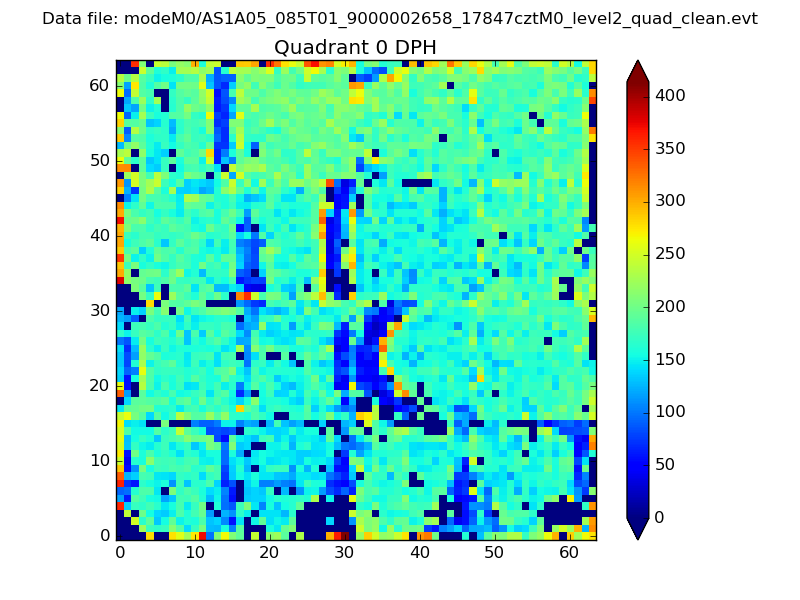 |
 |
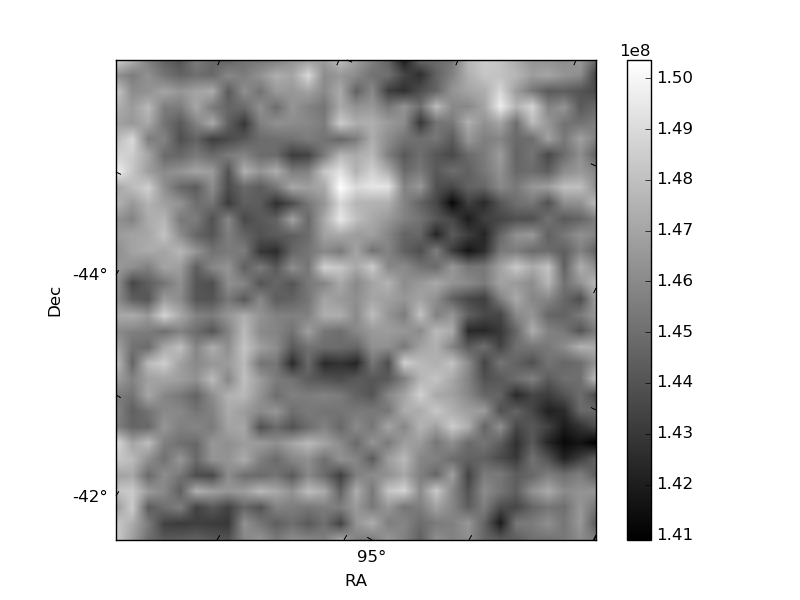
Quadrant B |
|---|---|---|---|
| Quadrant D | 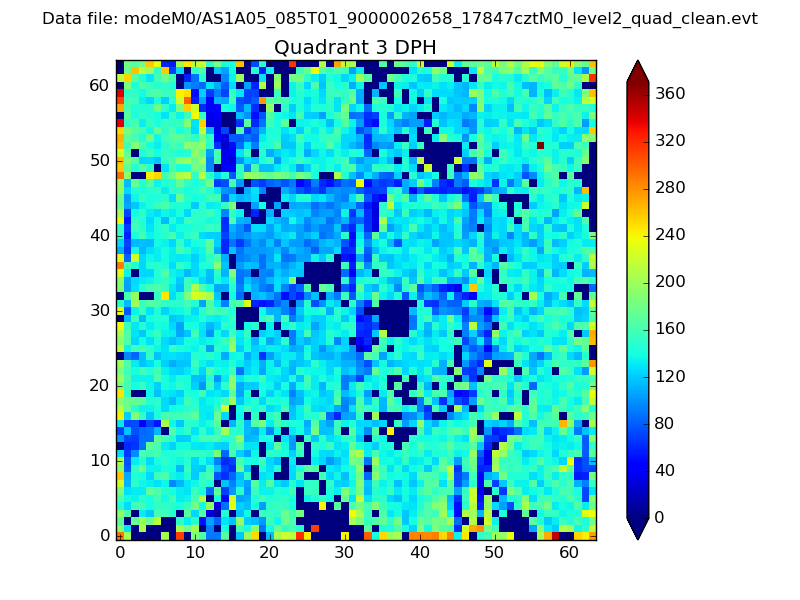 |
 |
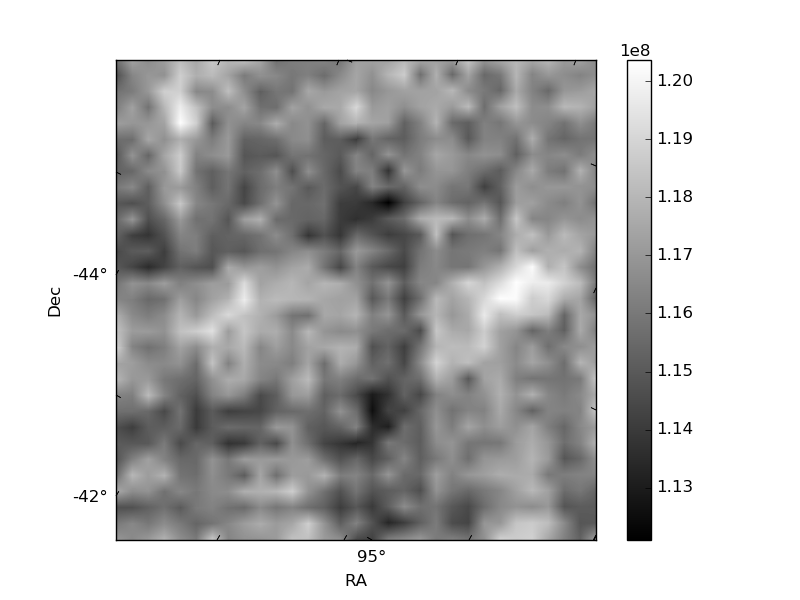
Quadrant C |
| Plot type | Count rate plots | Images |
|---|---|---|
| Comparison with Poisson distribution Blue bars denote a histogram of data divided into 1 sec bins. Red curve is a Poisson curve with rate = median count rate of data. |
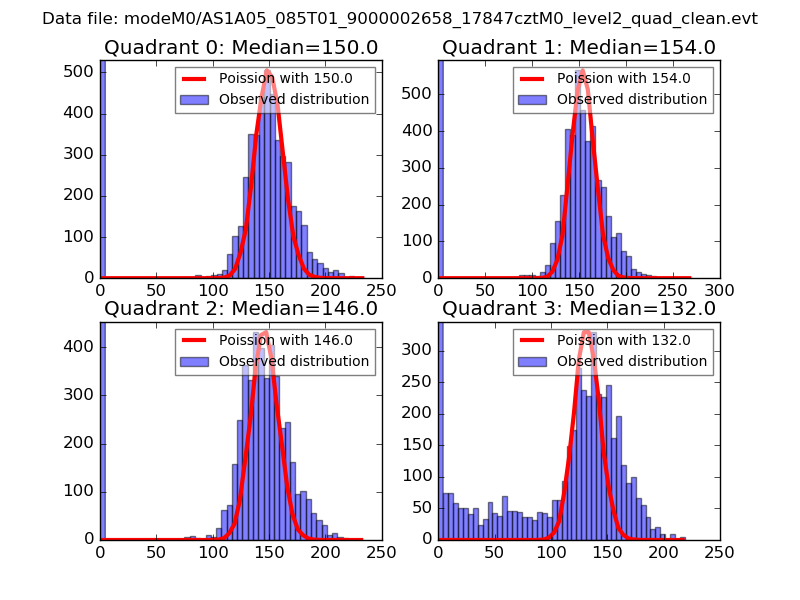 |
 |
| Quadrant-wise count rates Data is divided into 100 sec bins |
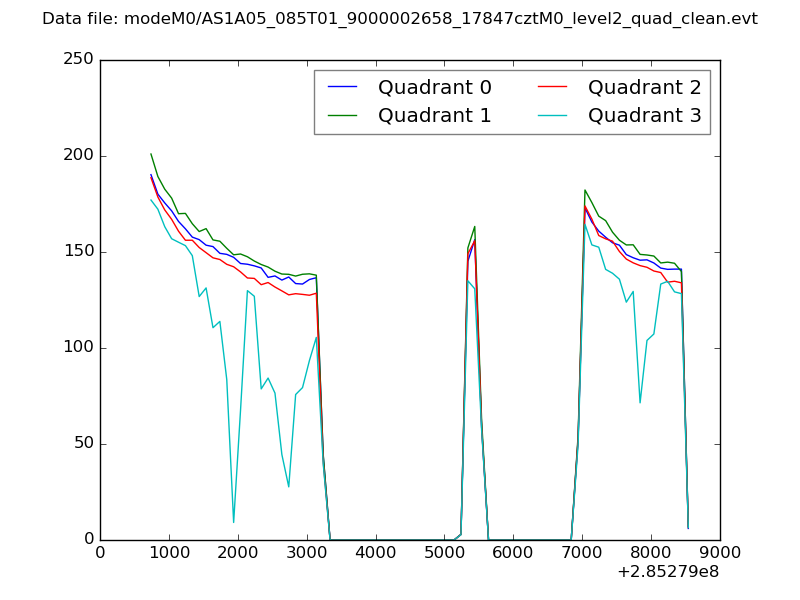 |
|
| Module-wise count rates for Quadrant A Data is divided into 100 sec bins |
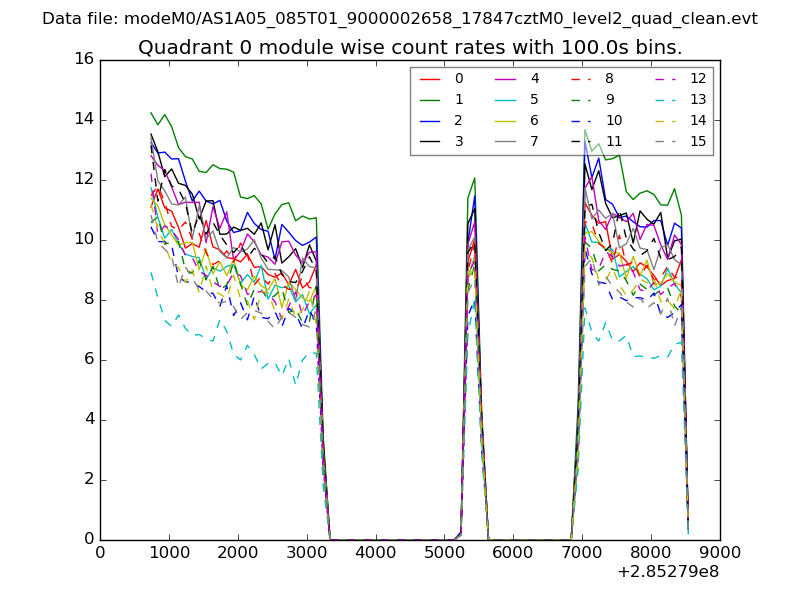 |
 |
| Module-wise count rates for Quadrant B Data is divided into 100 sec bins |
 |
 |
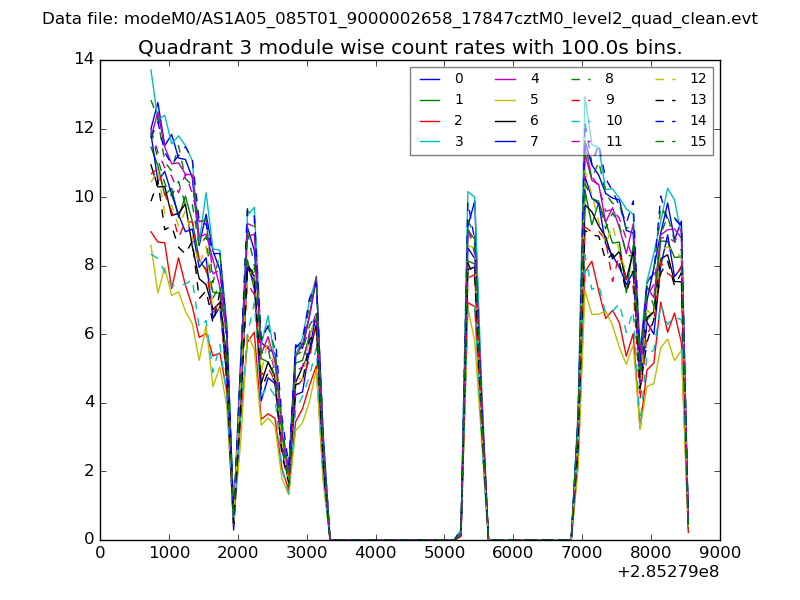
| Module-wise count rates for Quadrant C Data is divided into 100 sec bins |
 |
 |
| Module-wise count rates for Quadrant D Data is divided into 100 sec bins |
 |
 |
| Parameter | Plot |
|---|---|
| CZT HV Monitor | 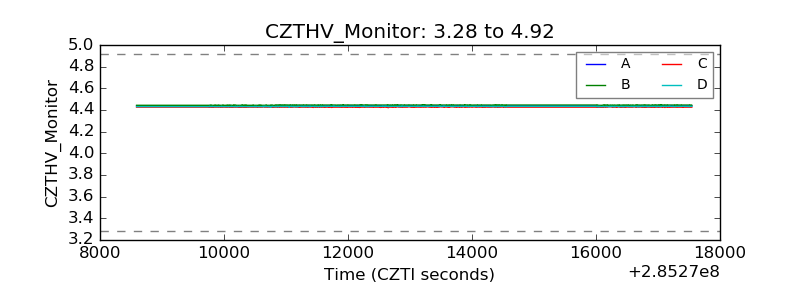 |
| D_VDD | 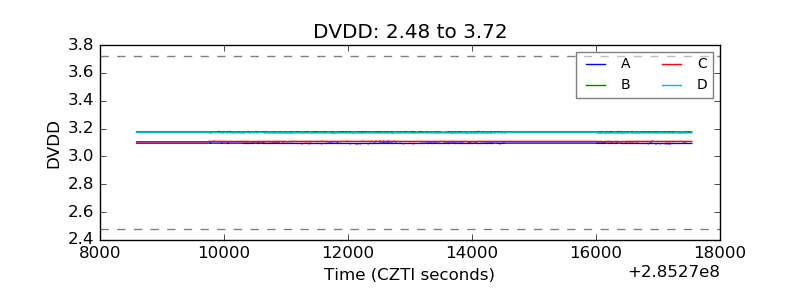 |
| Temperature 1 | 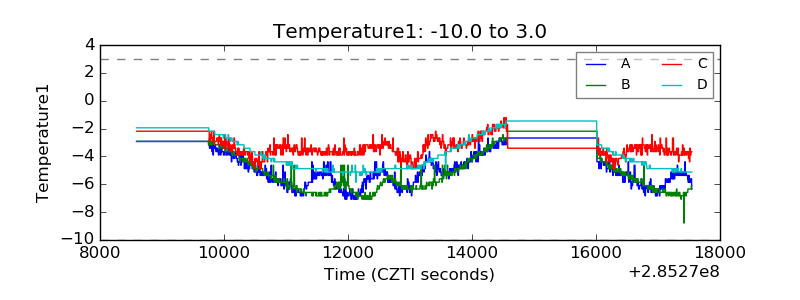 |
| Veto HV Monitor | 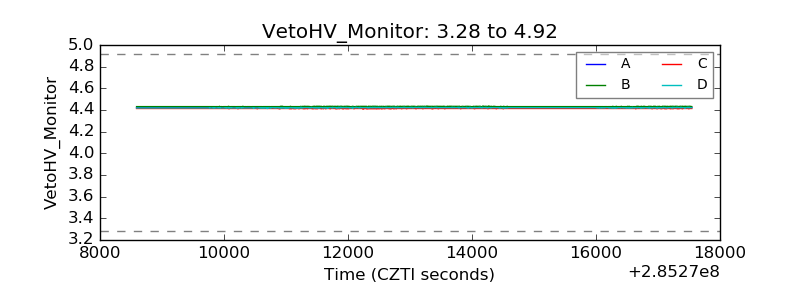 |
| Veto LLD | 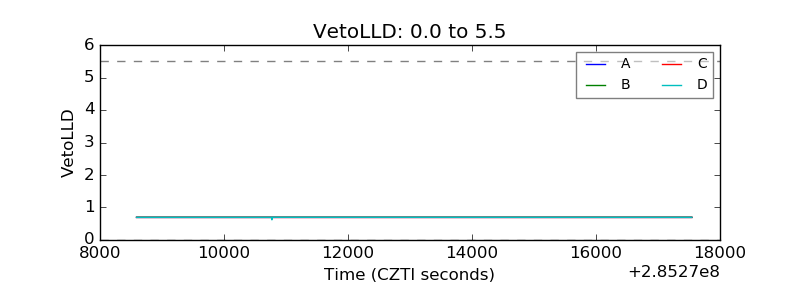 |
| Alpha Counter |  |
| _CPM_Rate | 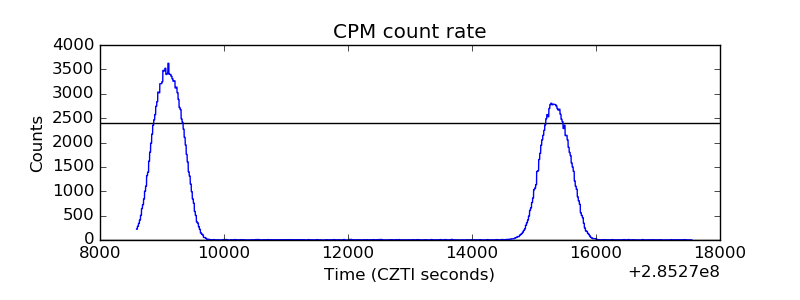 |
| CZT Counter |  |
| +2.5 Volts monitor | 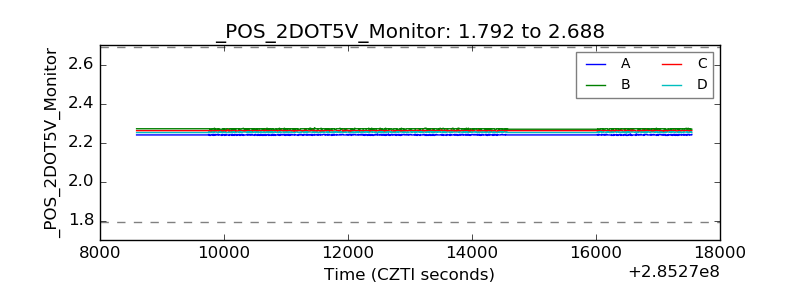 |
| +5 Volts monitor |  |
| _ROLL_ROT | 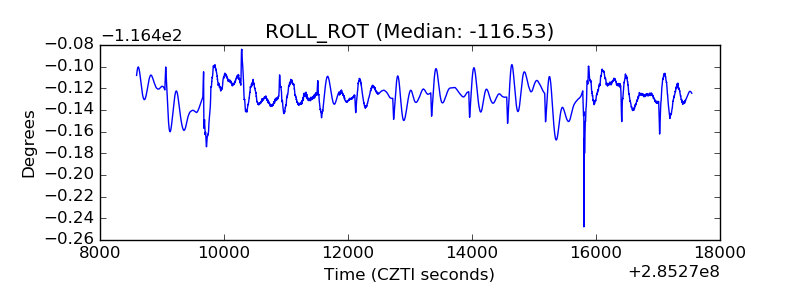 |
| _Roll_DEC | 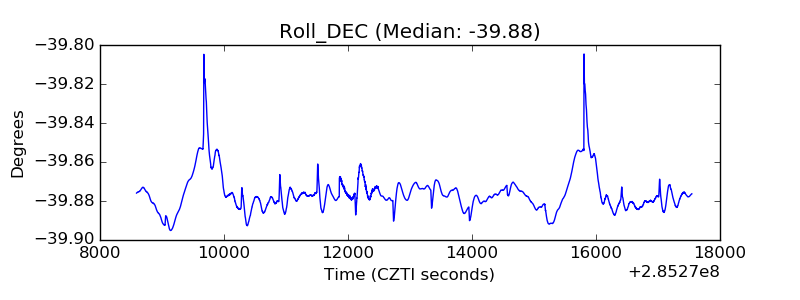 |
| _Roll_RA | 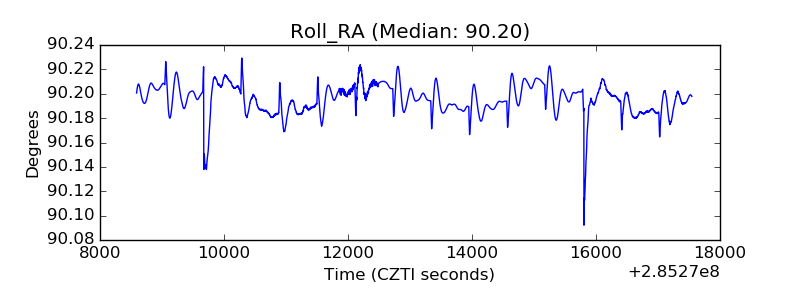 |
| Veto Counter | 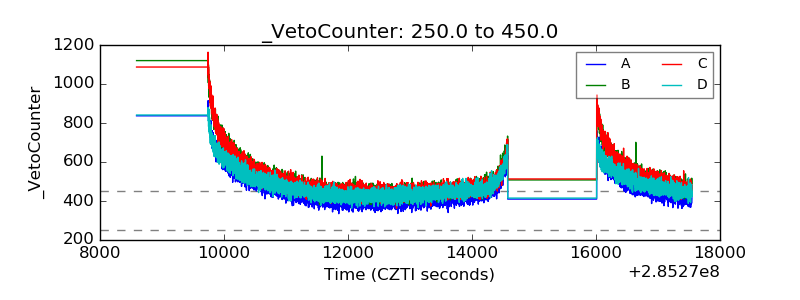 |