| Param | Original file | Final file |
|---|---|---|
| Filename | modeM0/AS1A05_085T01_9000002658_17848cztM0_level2.evt | modeM0/AS1A05_085T01_9000002658_17848cztM0_level2_quad_clean.evt |
| Size (bytes) | 458,717,760 | 96,359,040 |
| Size | 437.5 MB | 91.9 MB |
| Events in quadrant A | 3,062,490 | 629,322 |
| Events in quadrant B | 3,237,679 | 646,738 |
| Events in quadrant C | 3,219,047 | 615,872 |
| Events in quadrant D | 3,936,995 | 578,603 |
| Mode SS | |||
|---|---|---|---|
| Quadrant | BADHDUFLAG | Total packets | Discarded packets |
| A | 0 | 130 | 0 |
| B | 0 | 130 | 0 |
| C | 0 | 130 | 0 |
| D | 0 | 130 | 0 |
| Mode M9 | |||
|---|---|---|---|
| Quadrant | BADHDUFLAG | Total packets | Discarded packets |
| A | 0 | 24 | 0 |
| B | 0 | 25 | 0 |
| C | 0 | 25 | 0 |
| D | 0 | 25 | 0 |
| Mode M0 | |||
|---|---|---|---|
| Quadrant | BADHDUFLAG | Total packets | Discarded packets |
| A | 0 | 13283 | 2 |
| B | 0 | 13658 | 3 |
| C | 0 | 13359 | 2 |
| D | 0 | 16152 | 2 |
| Quadrant | Total seconds | Saturated seconds | Saturation percentage |
|---|---|---|---|
| A | 6419 | 25 | 0.389469% |
| B | 6418 | 41 | 0.638828% |
| C | 6418 | 35 | 0.545341% |
| D | 6418 | 251 | 3.910876% |
Noise dominated data is calculated using 1-second bins in cleaned event files. If a bin has >2000 counts, and if more than 50% of those come from <1% of pixels, then it is considered to be noise-dominated and hence unusable.
| Quadrant | # 1 sec bins | Bins with >0 counts | Bins with >2000 counts | High rate bins dominated by noise | Noise dominated (total time) | Noise dominated (detector-on time) | Marked lightcurve |
|---|---|---|---|---|---|---|---|
| A | 7754 | 6420 | 0 | 0 | 0.00% | 0.00% | 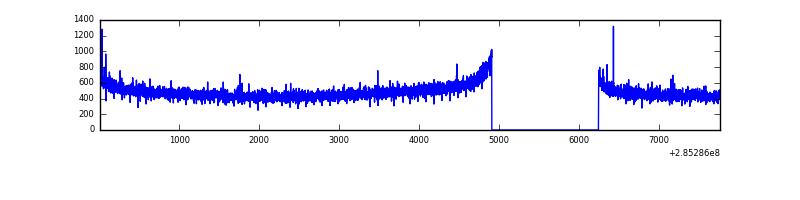 |
| B | 7753 | 6419 | 1 | 1 | 0.01% | 0.02% | 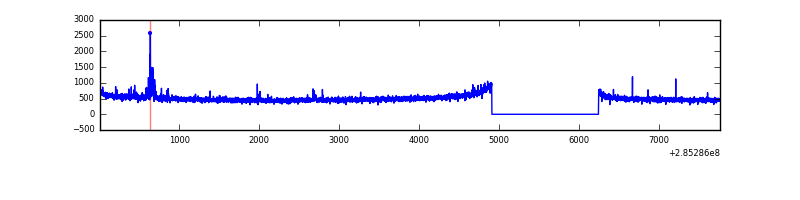 |
| C | 7753 | 6419 | 0 | 0 | 0.00% | 0.00% | 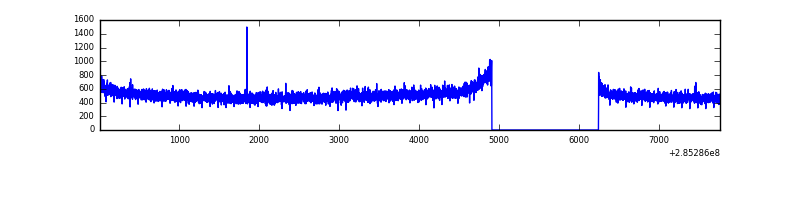 |
| D | 7753 | 6419 | 230 | 230 | 2.97% | 3.58% | 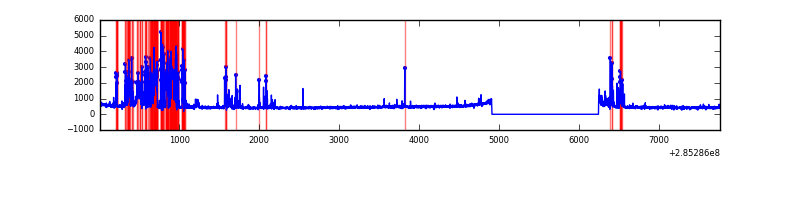 |
Top three noisy pixels from each quadrant. If the there are fewer than three noisy pixels in the level2.evt file, extra rows are filled as -1
| Pixel properties | Quadrant properties | ||||||
|---|---|---|---|---|---|---|---|
| Quadrant | DetID | PixID | Counts | Sigma | Mean | Median | Sigma |
| A | 0 | 226 | 6984 | 38.5 | 796 | 779 | 161.2 |
| A | 3 | 137 | 5852 | 31.48 | 796 | 779 | 161.2 |
| A | 12 | 194 | 5774 | 30.99 | 796 | 779 | 161.2 |
| B | 0 | 183 | 53719 | 349.4 | 807 | 787 | 151.5 |
| B | 12 | 111 | 17822 | 112.45 | 807 | 787 | 151.5 |
| B | 11 | 111 | 15228 | 95.32 | 807 | 787 | 151.5 |
| C | 14 | 238 | 120690 | 662.73 | 776 | 783 | 180.9 |
| C | 5 | 218 | 52094 | 283.6 | 776 | 783 | 180.9 |
| C | 5 | 219 | 11763 | 60.69 | 776 | 783 | 180.9 |
| D | 7 | 238 | 1047723 | 5811.22 | 754 | 736 | 180.2 |
| D | 2 | 234 | 25196 | 135.76 | 754 | 736 | 180.2 |
| D | 10 | 70 | 11729 | 61.01 | 754 | 736 | 180.2 |
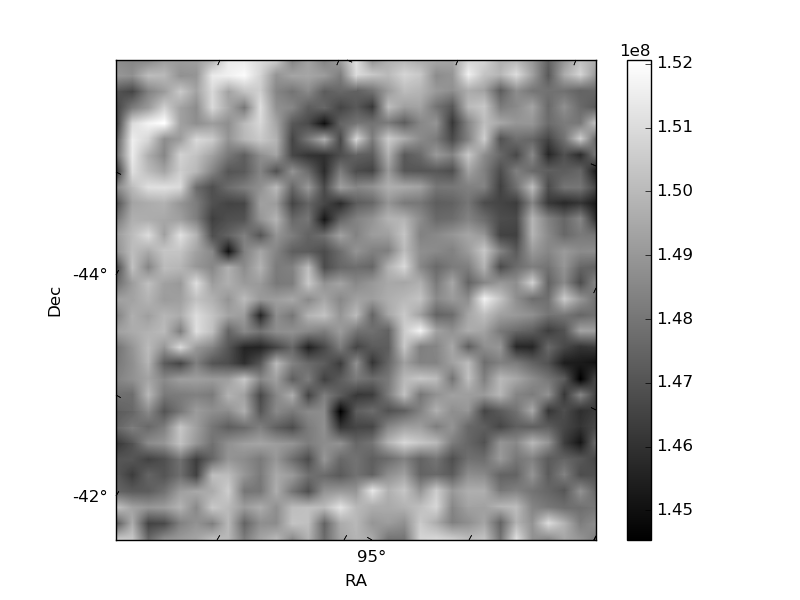
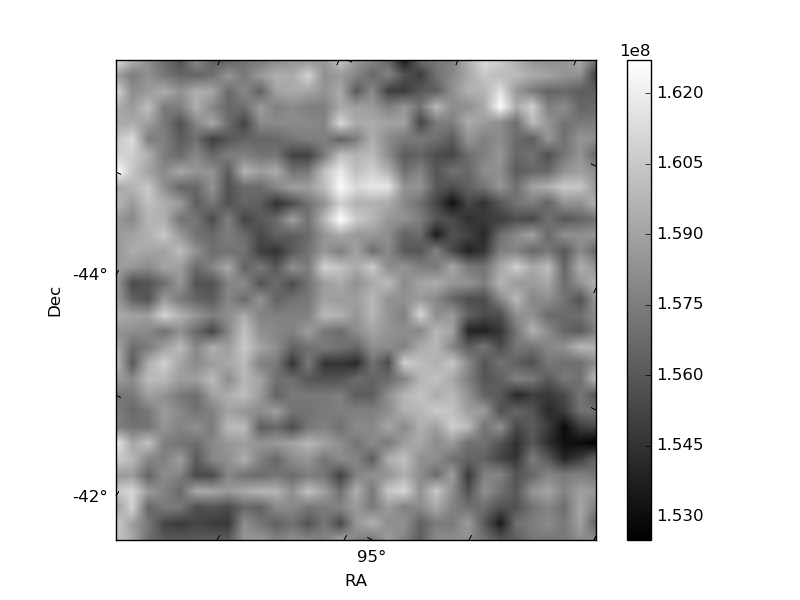
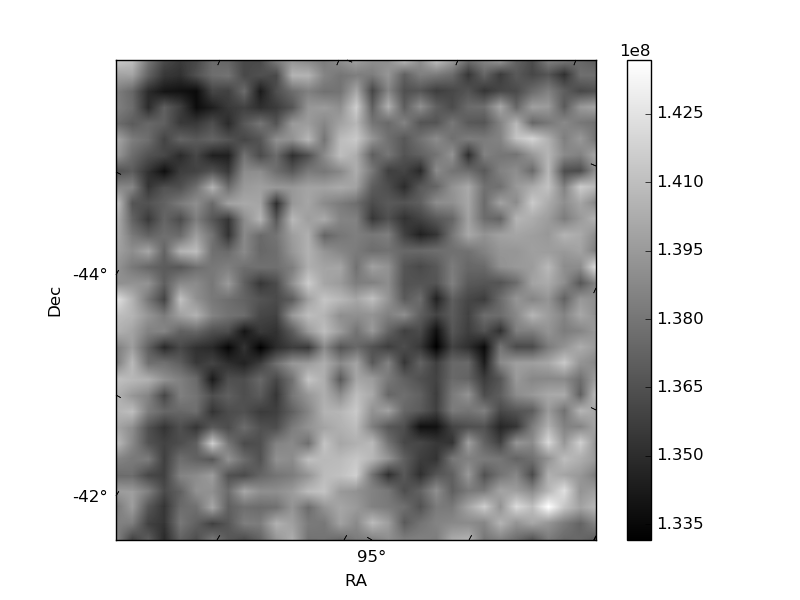
Histogram calculated using DETX and DETY for each event in the final _common_clean file
| Quadrant A | 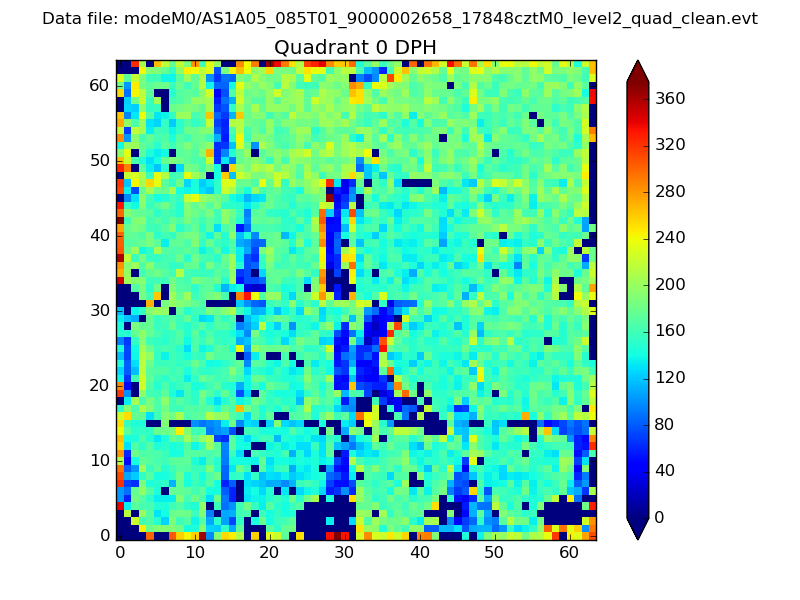 |
 |
Quadrant B |
|---|---|---|---|
| Quadrant D | 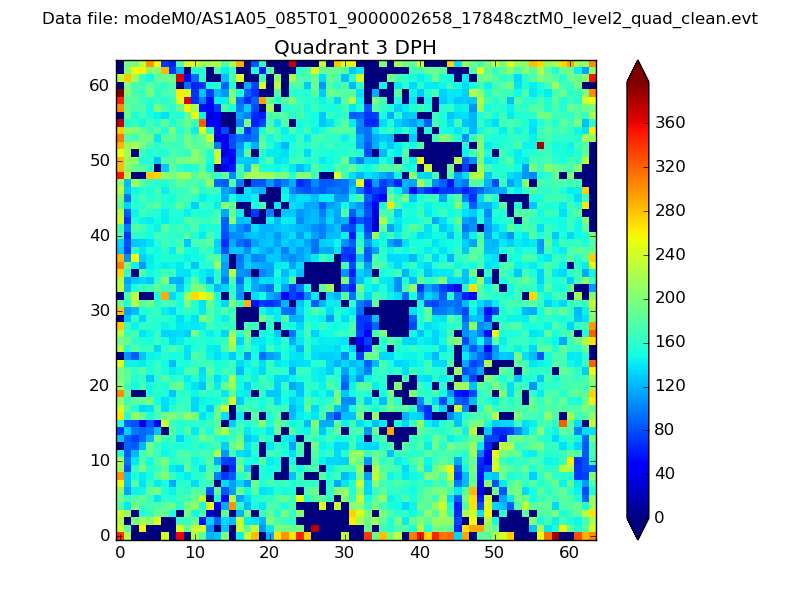 |
 |
Quadrant C |
| Plot type | Count rate plots | Images |
|---|---|---|
| Comparison with Poisson distribution Blue bars denote a histogram of data divided into 1 sec bins. Red curve is a Poisson curve with rate = median count rate of data. |
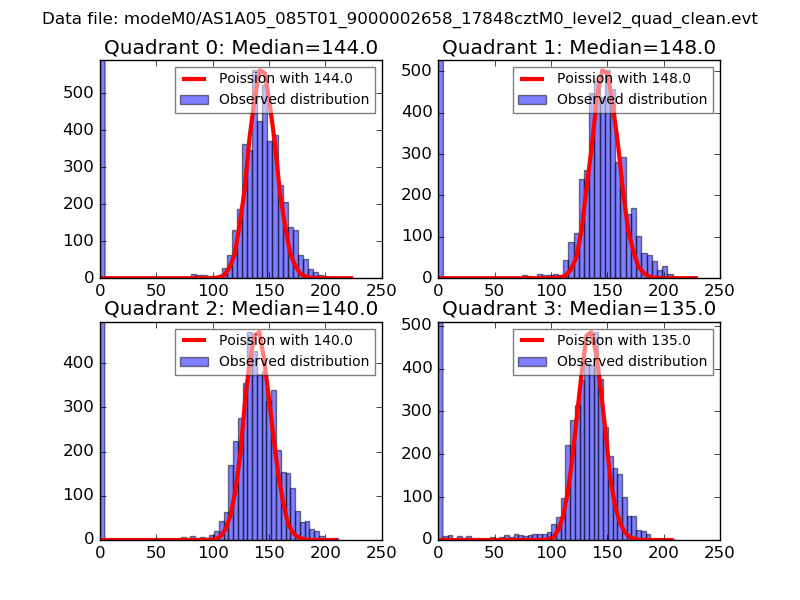 |
 |
| Quadrant-wise count rates Data is divided into 100 sec bins |
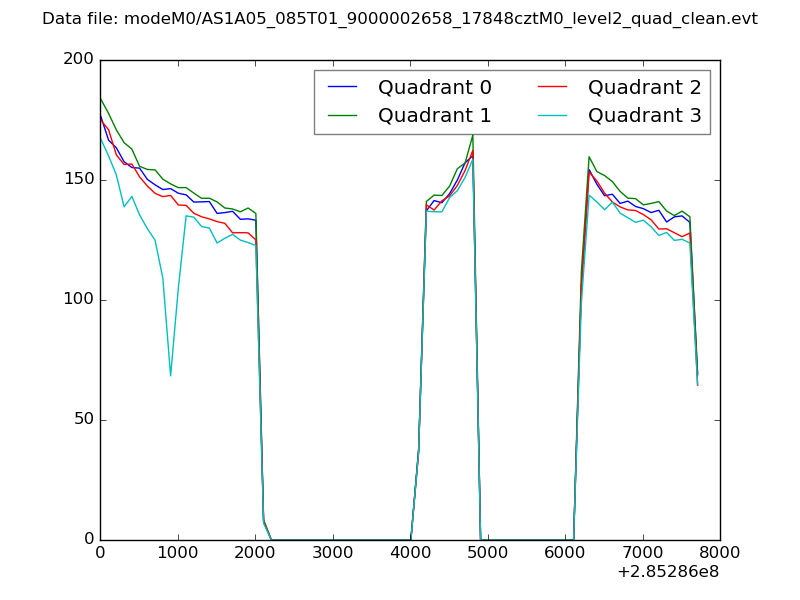 |
|
| Module-wise count rates for Quadrant A Data is divided into 100 sec bins |
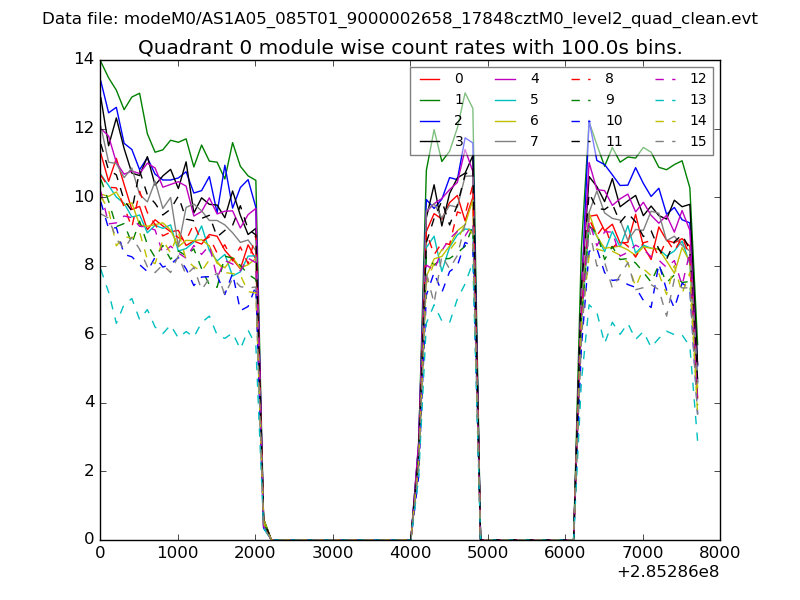 |
 |
| Module-wise count rates for Quadrant B Data is divided into 100 sec bins |
 |
 |
| Module-wise count rates for Quadrant C Data is divided into 100 sec bins |
 |
 |
| Module-wise count rates for Quadrant D Data is divided into 100 sec bins |
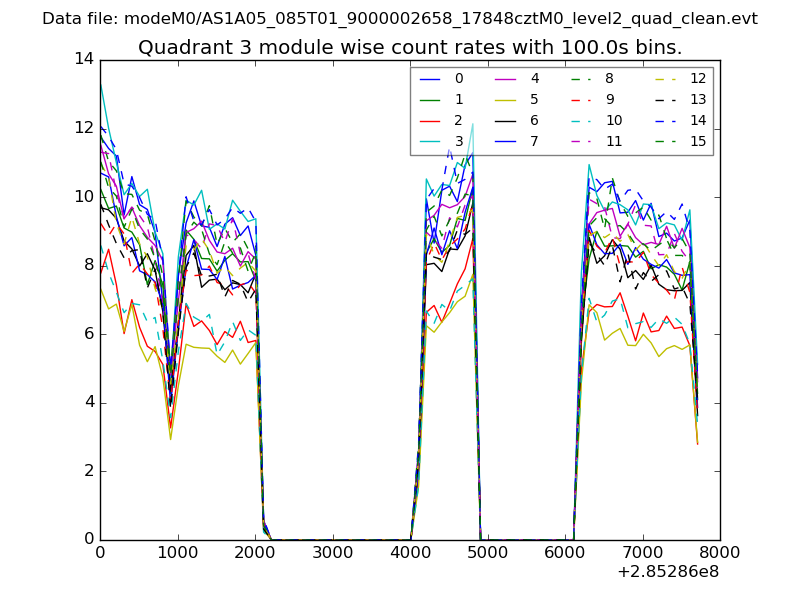 |
 |
| Parameter | Plot |
|---|---|
| CZT HV Monitor | 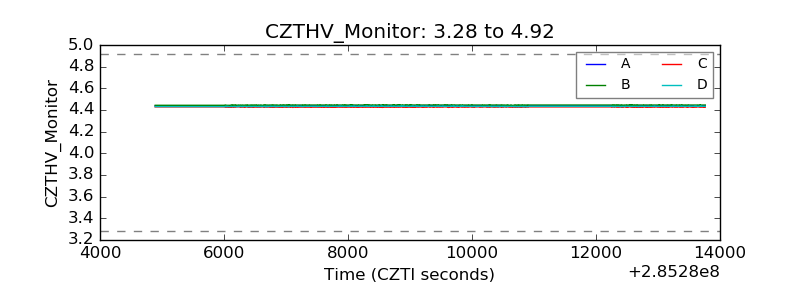 |
| D_VDD | 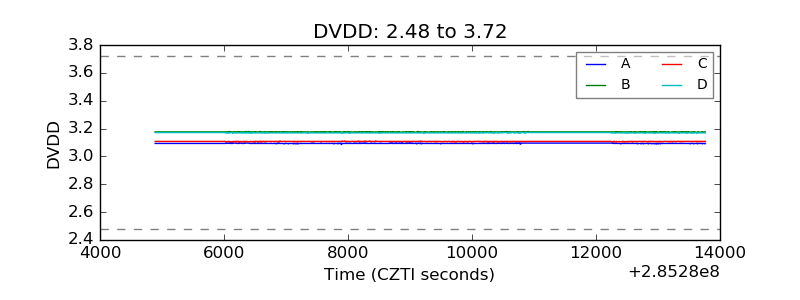 |
| Temperature 1 | 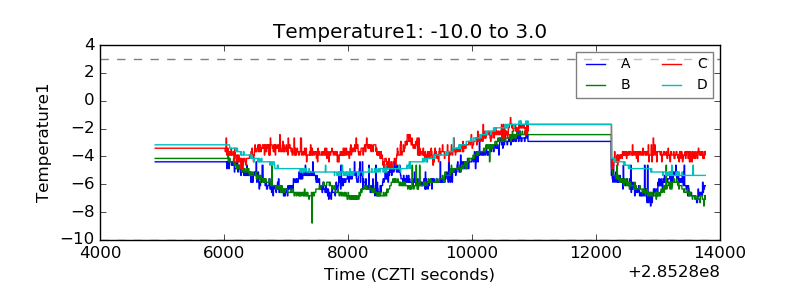 |
| Veto HV Monitor | 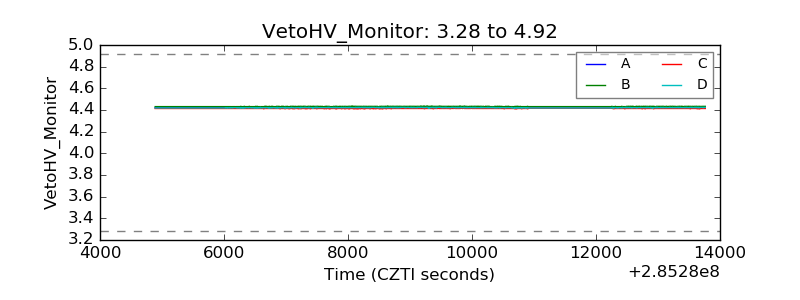 |
| Veto LLD |  |
| Alpha Counter |  |
| _CPM_Rate | 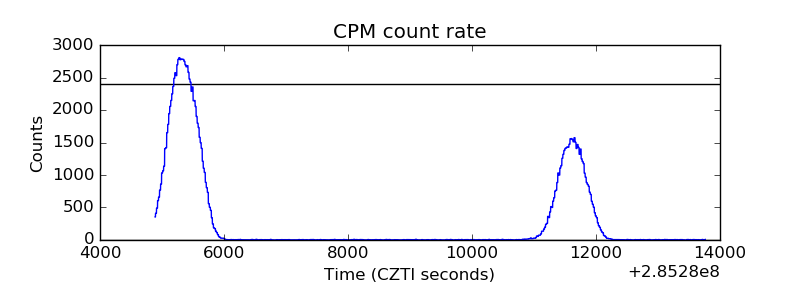 |
| CZT Counter |  |
| +2.5 Volts monitor |  |
| +5 Volts monitor | 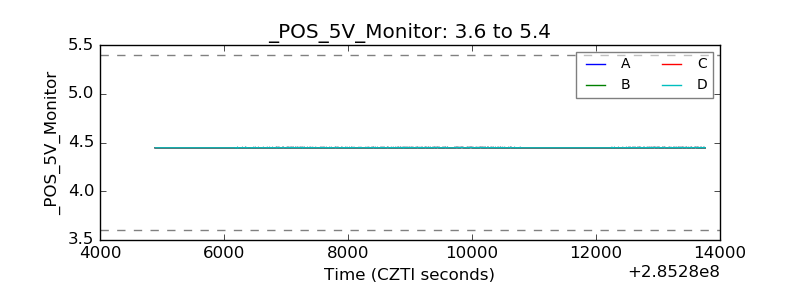 |
| _ROLL_ROT | 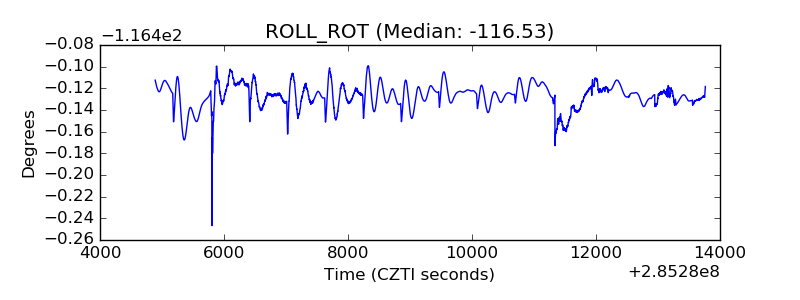 |
| _Roll_DEC | 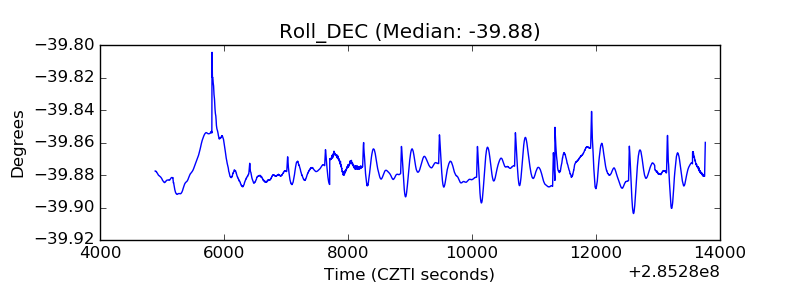 |
| _Roll_RA | 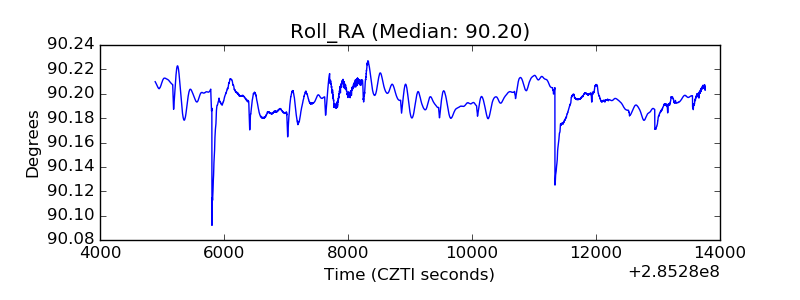 |
| Veto Counter | 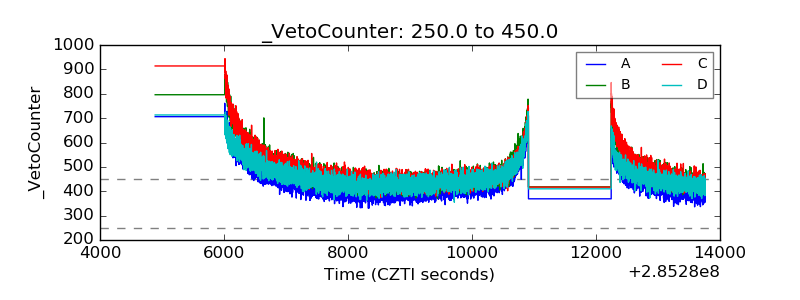 |