| Param | Original file | Final file |
|---|---|---|
| Filename | modeM0/AS1A05_085T01_9000002658_17850cztM0_level2.evt | modeM0/AS1A05_085T01_9000002658_17850cztM0_level2_quad_clean.evt |
| Size (bytes) | 491,780,160 | 101,741,760 |
| Size | 469.0 MB | 97.0 MB |
| Events in quadrant A | 3,455,069 | 651,571 |
| Events in quadrant B | 3,553,757 | 657,539 |
| Events in quadrant C | 3,609,927 | 631,339 |
| Events in quadrant D | 3,766,030 | 619,664 |
| Mode SS | |||
|---|---|---|---|
| Quadrant | BADHDUFLAG | Total packets | Discarded packets |
| A | 0 | 154 | 0 |
| B | 0 | 154 | 0 |
| C | 0 | 154 | 0 |
| D | 0 | 154 | 0 |
| Mode M9 | |||
|---|---|---|---|
| Quadrant | BADHDUFLAG | Total packets | Discarded packets |
| A | 0 | 17 | 0 |
| B | 0 | 17 | 0 |
| C | 0 | 17 | 0 |
| D | 0 | 17 | 0 |
| Mode M0 | |||
|---|---|---|---|
| Quadrant | BADHDUFLAG | Total packets | Discarded packets |
| A | 0 | 15339 | 2 |
| B | 0 | 15440 | 2 |
| C | 0 | 15408 | 2 |
| D | 0 | 16397 | 2 |
| Quadrant | Total seconds | Saturated seconds | Saturation percentage |
|---|---|---|---|
| A | 7487 | 44 | 0.587685% |
| B | 7487 | 77 | 1.028449% |
| C | 7488 | 99 | 1.322115% |
| D | 7488 | 62 | 0.827991% |
Noise dominated data is calculated using 1-second bins in cleaned event files. If a bin has >2000 counts, and if more than 50% of those come from <1% of pixels, then it is considered to be noise-dominated and hence unusable.
| Quadrant | # 1 sec bins | Bins with >0 counts | Bins with >2000 counts | High rate bins dominated by noise | Noise dominated (total time) | Noise dominated (detector-on time) | Marked lightcurve |
|---|---|---|---|---|---|---|---|
| A | 9227 | 7489 | 0 | 0 | 0.00% | 0.00% | 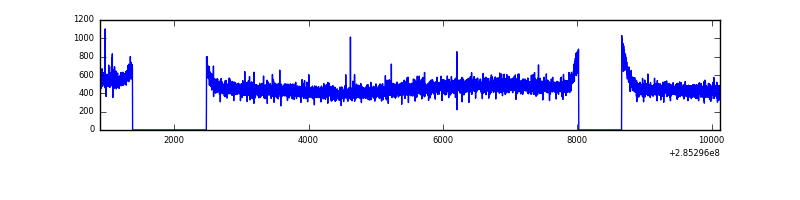 |
| B | 9227 | 7489 | 0 | 0 | 0.00% | 0.00% | 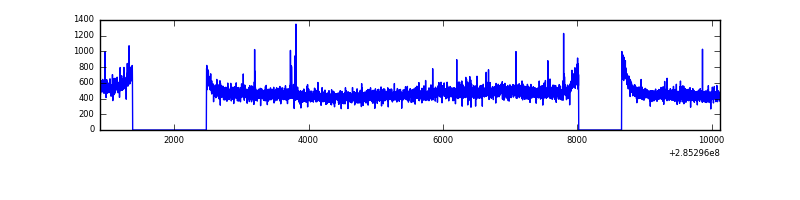 |
| C | 9228 | 7490 | 0 | 0 | 0.00% | 0.00% | 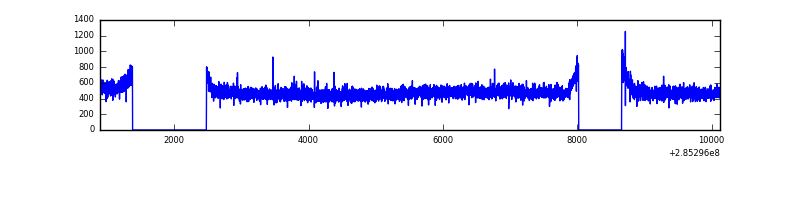 |
| D | 9228 | 7490 | 25 | 25 | 0.27% | 0.33% | 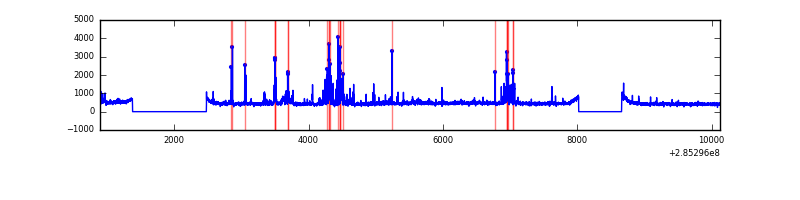 |
Top three noisy pixels from each quadrant. If the there are fewer than three noisy pixels in the level2.evt file, extra rows are filled as -1
| Pixel properties | Quadrant properties | ||||||
|---|---|---|---|---|---|---|---|
| Quadrant | DetID | PixID | Counts | Sigma | Mean | Median | Sigma |
| A | 0 | 226 | 7698 | 37.59 | 898 | 880 | 181.4 |
| A | 3 | 137 | 6865 | 33.0 | 898 | 880 | 181.4 |
| A | 12 | 194 | 6357 | 30.2 | 898 | 880 | 181.4 |
| B | 12 | 111 | 21042 | 115.91 | 903 | 880 | 173.9 |
| B | 11 | 111 | 17989 | 98.36 | 903 | 880 | 173.9 |
| B | 14 | 111 | 15527 | 84.21 | 903 | 880 | 173.9 |
| C | 14 | 238 | 132410 | 645.69 | 870 | 875 | 203.7 |
| C | 3 | 233 | 34651 | 165.8 | 870 | 875 | 203.7 |
| C | 5 | 218 | 32650 | 155.98 | 870 | 875 | 203.7 |
| D | 7 | 238 | 409086 | 1919.84 | 873 | 847 | 212.6 |
| D | 10 | 70 | 30513 | 139.51 | 873 | 847 | 212.6 |
| D | 2 | 234 | 28882 | 131.84 | 873 | 847 | 212.6 |
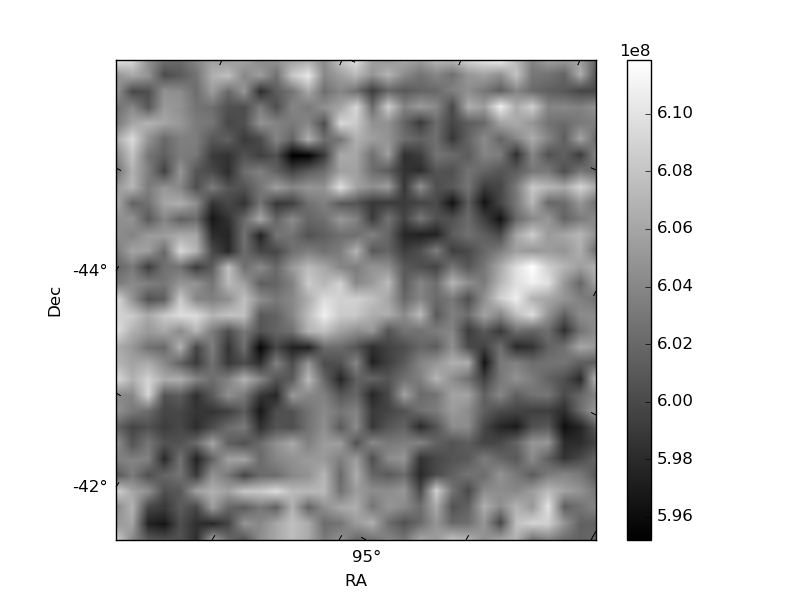
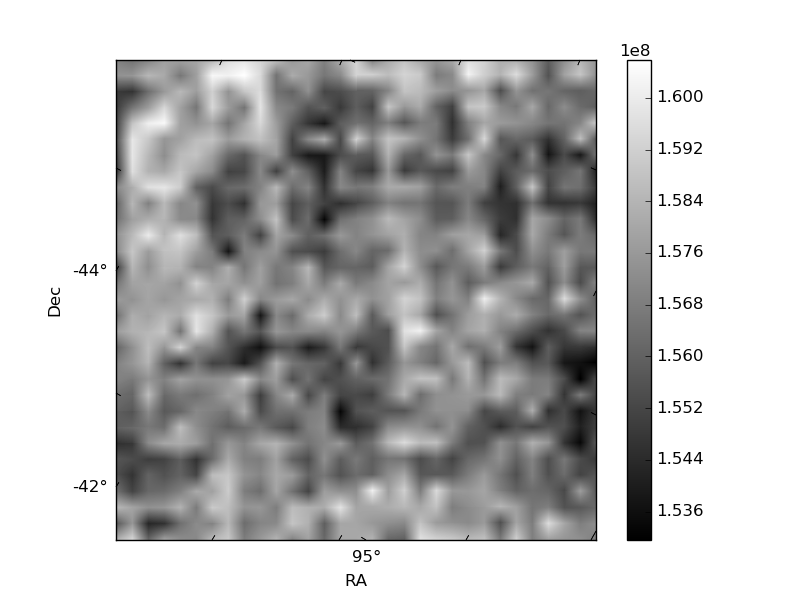
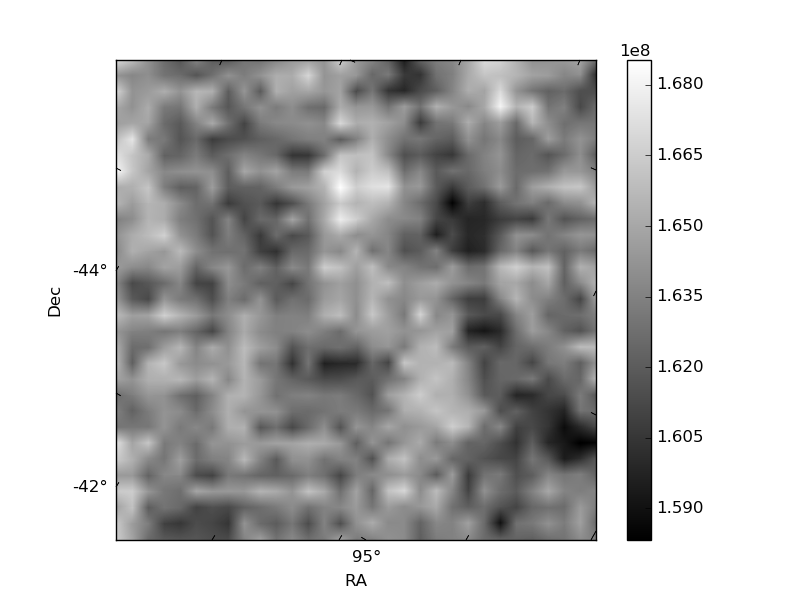
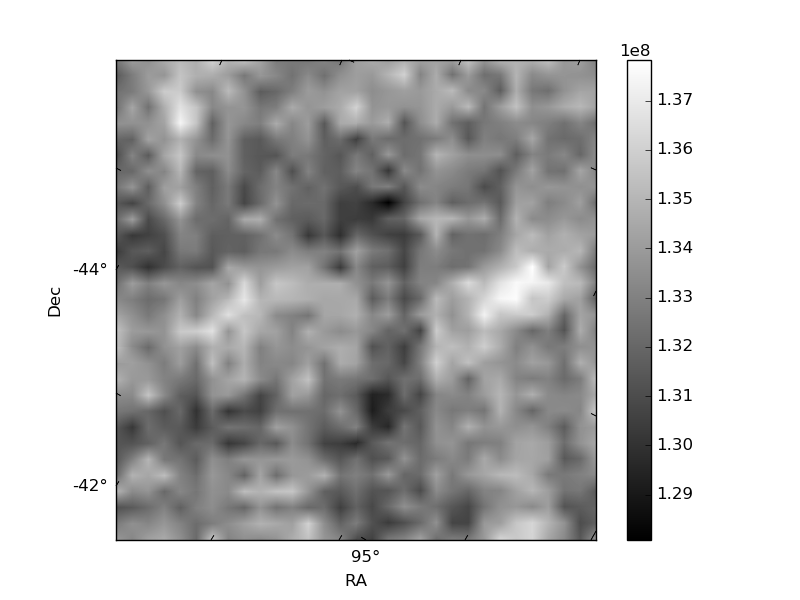
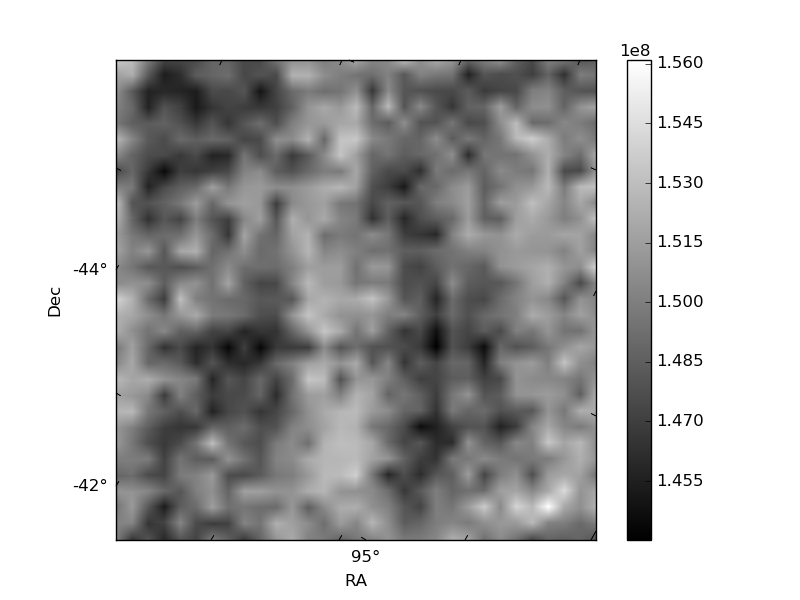
Histogram calculated using DETX and DETY for each event in the final _common_clean file
| Quadrant A | 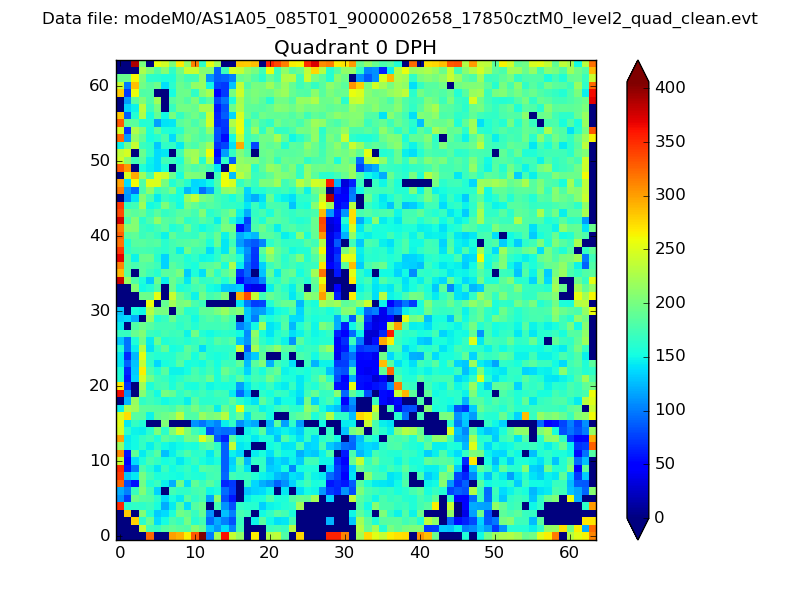 |
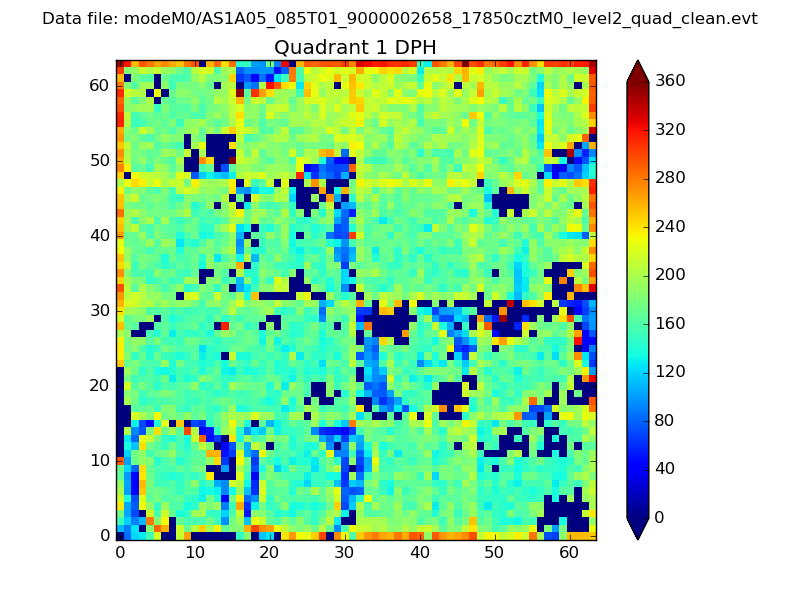 |
Quadrant B |
|---|---|---|---|
| Quadrant D | 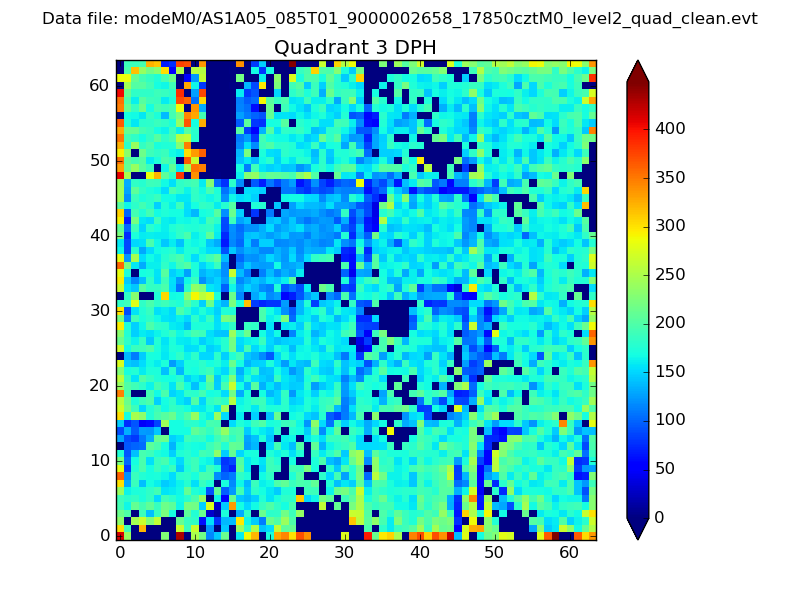 |
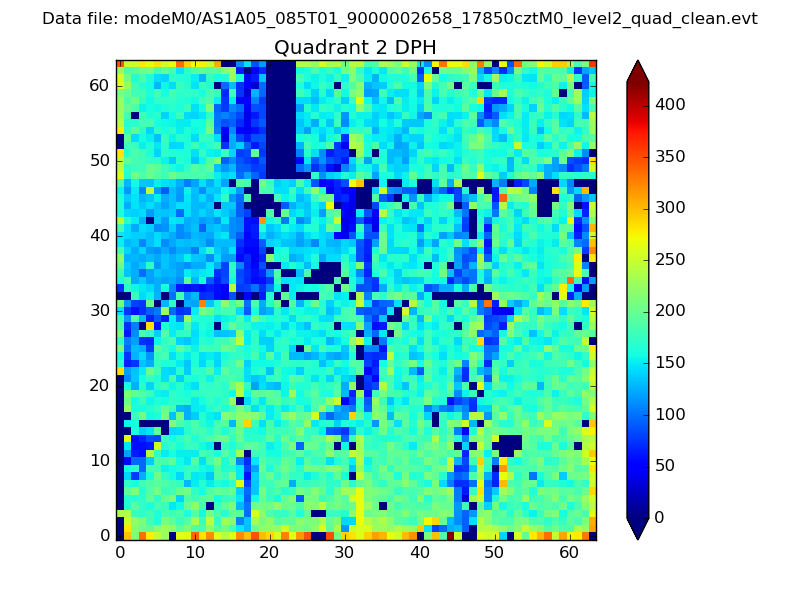 |
Quadrant C |
| Plot type | Count rate plots | Images |
|---|---|---|
| Comparison with Poisson distribution Blue bars denote a histogram of data divided into 1 sec bins. Red curve is a Poisson curve with rate = median count rate of data. |
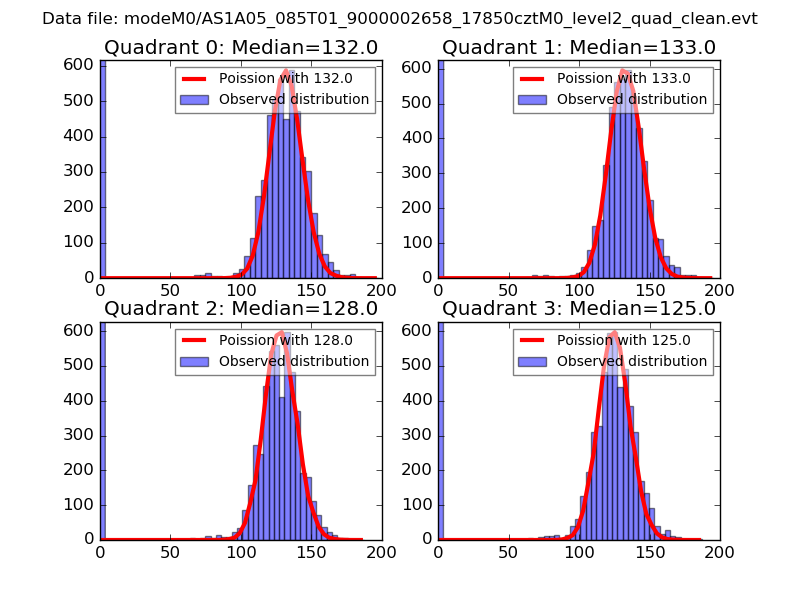 |
 |
| Quadrant-wise count rates Data is divided into 100 sec bins |
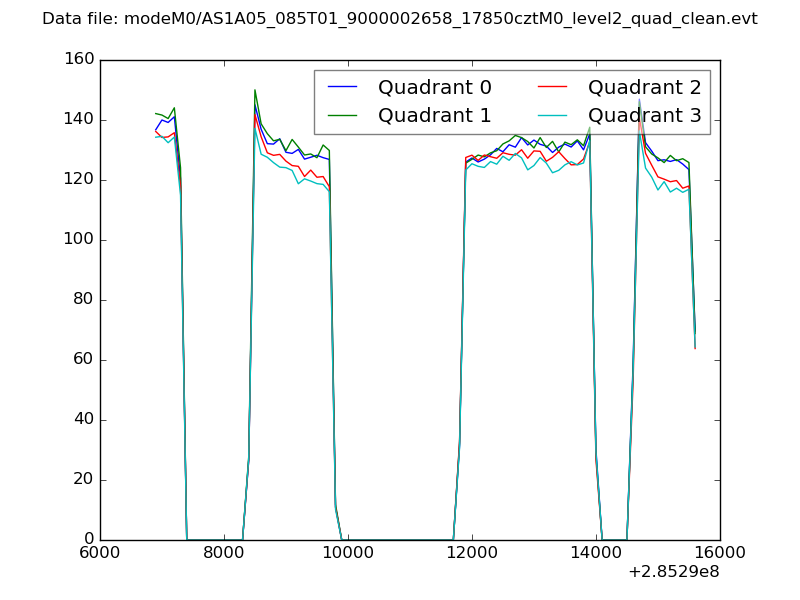 |
|
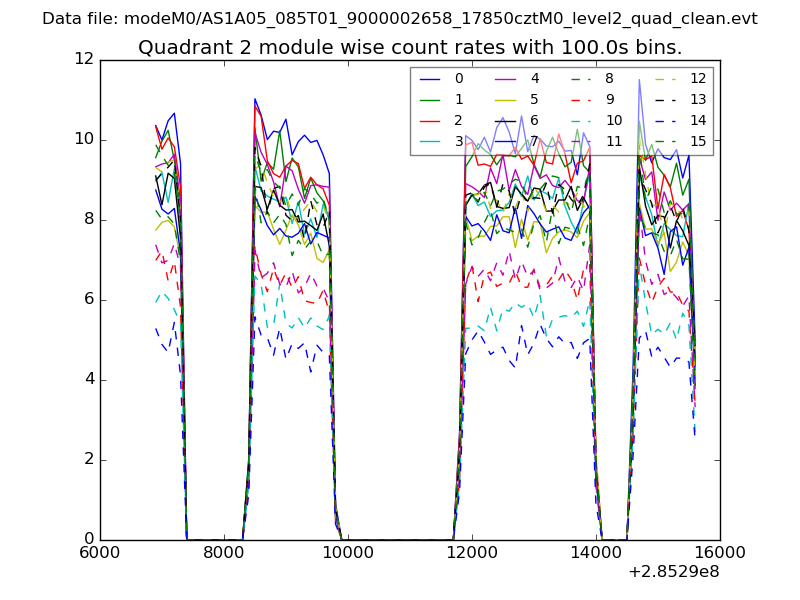
| Module-wise count rates for Quadrant A Data is divided into 100 sec bins |
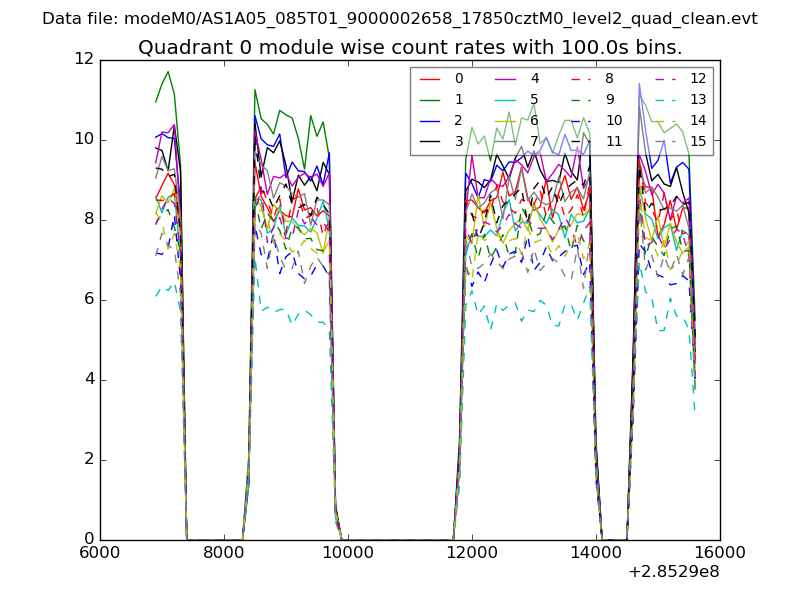 |
 |
| Module-wise count rates for Quadrant B Data is divided into 100 sec bins |
 |
 |
| Module-wise count rates for Quadrant C Data is divided into 100 sec bins |
 |
 |
| Module-wise count rates for Quadrant D Data is divided into 100 sec bins |
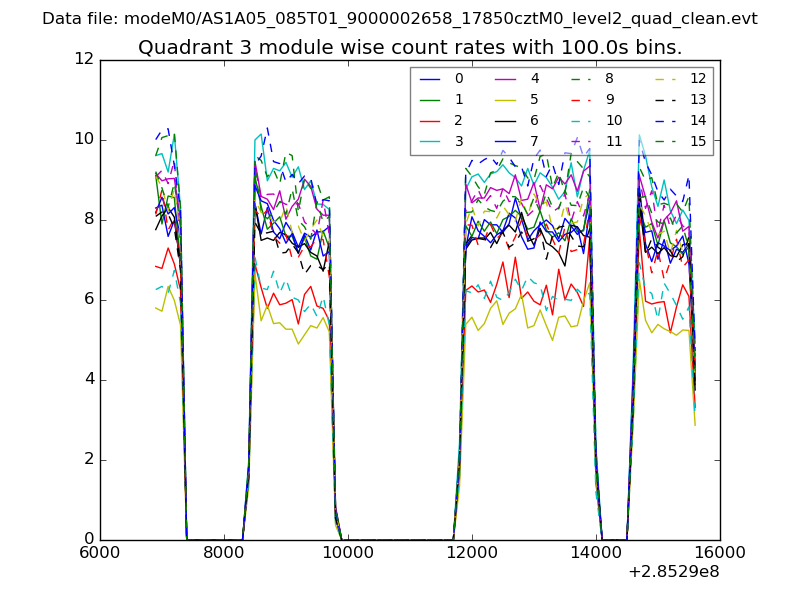 |
 |
| Parameter | Plot |
|---|---|
| CZT HV Monitor | 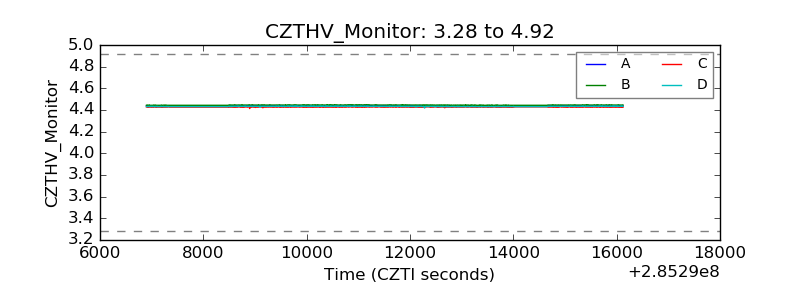 |
| D_VDD | 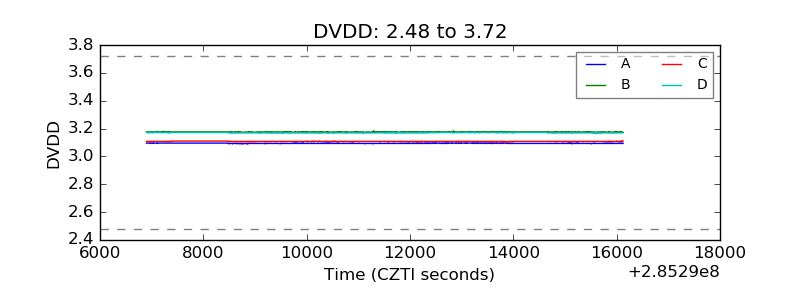 |
| Temperature 1 | 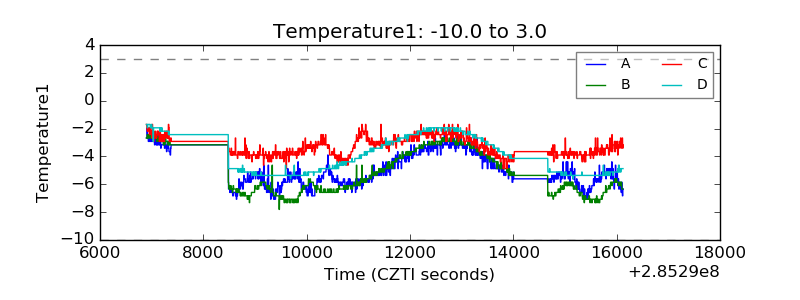 |
| Veto HV Monitor | 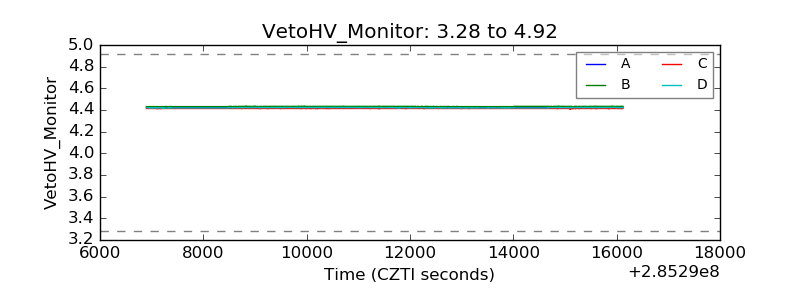 |
| Veto LLD | 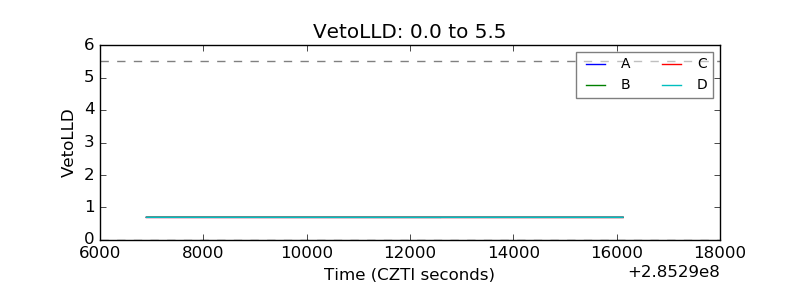 |
| Alpha Counter |  |
| _CPM_Rate | 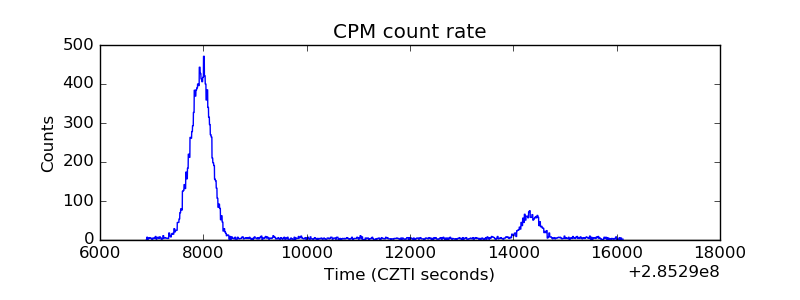 |
| CZT Counter |  |
| +2.5 Volts monitor | 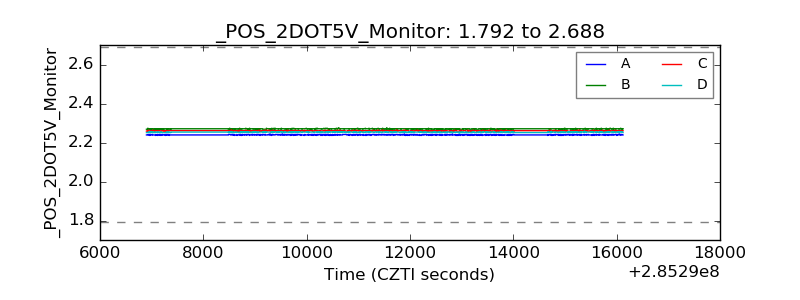 |
| +5 Volts monitor |  |
| _ROLL_ROT | 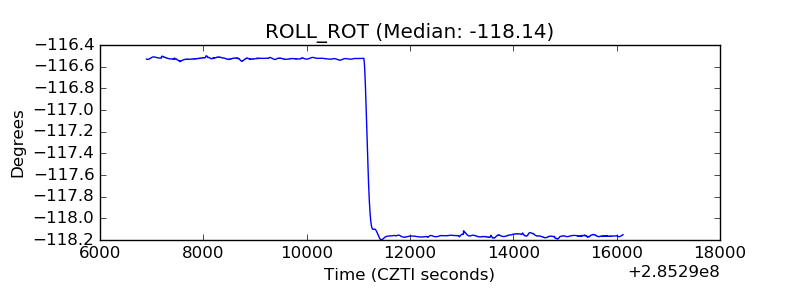 |
| _Roll_DEC | 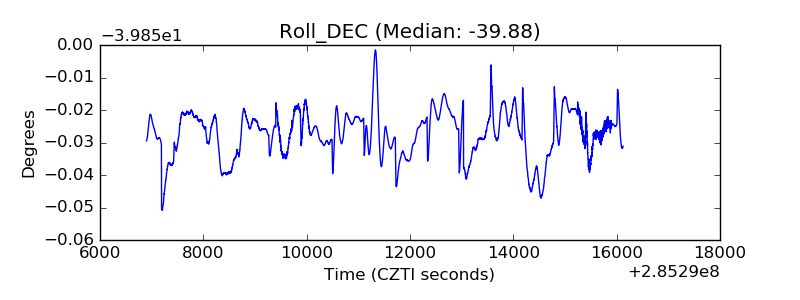 |
| _Roll_RA | 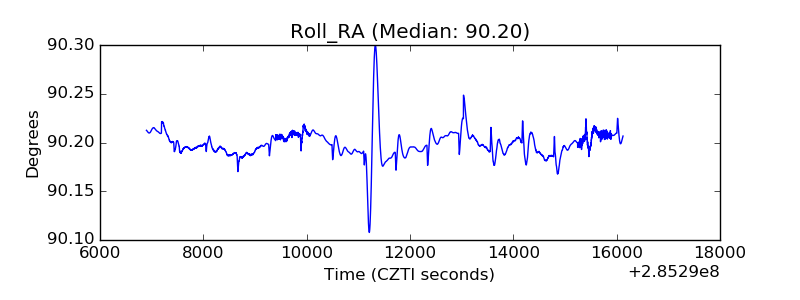 |
| Veto Counter |  |