| Param | Original file | Final file |
|---|---|---|
| Filename | modeM0/AS1A05_085T01_9000002658_17851cztM0_level2.evt | modeM0/AS1A05_085T01_9000002658_17851cztM0_level2_quad_clean.evt |
| Size (bytes) | 502,361,280 | 94,556,160 |
| Size | 479.1 MB | 90.2 MB |
| Events in quadrant A | 3,562,277 | 594,033 |
| Events in quadrant B | 3,651,983 | 598,921 |
| Events in quadrant C | 3,714,706 | 573,191 |
| Events in quadrant D | 3,763,009 | 562,887 |
| Mode SS | |||
|---|---|---|---|
| Quadrant | BADHDUFLAG | Total packets | Discarded packets |
| A | 0 | 160 | 0 |
| B | 0 | 160 | 0 |
| C | 0 | 160 | 0 |
| D | 0 | 160 | 0 |
| Mode M9 | |||
|---|---|---|---|
| Quadrant | BADHDUFLAG | Total packets | Discarded packets |
| A | 0 | 7 | 0 |
| B | 0 | 7 | 0 |
| C | 0 | 7 | 0 |
| D | 0 | 7 | 0 |
| Mode M0 | |||
|---|---|---|---|
| Quadrant | BADHDUFLAG | Total packets | Discarded packets |
| A | 0 | 15972 | 2 |
| B | 0 | 15985 | 2 |
| C | 0 | 16008 | 2 |
| D | 0 | 16823 | 2 |
| Quadrant | Total seconds | Saturated seconds | Saturation percentage |
|---|---|---|---|
| A | 7671 | 180 | 2.346500% |
| B | 7672 | 246 | 3.206465% |
| C | 7672 | 283 | 3.688738% |
| D | 7672 | 248 | 3.232534% |
Noise dominated data is calculated using 1-second bins in cleaned event files. If a bin has >2000 counts, and if more than 50% of those come from <1% of pixels, then it is considered to be noise-dominated and hence unusable.
| Quadrant | # 1 sec bins | Bins with >0 counts | Bins with >2000 counts | High rate bins dominated by noise | Noise dominated (total time) | Noise dominated (detector-on time) | Marked lightcurve |
|---|---|---|---|---|---|---|---|
| A | 8491 | 7674 | 0 | 0 | 0.00% | 0.00% | 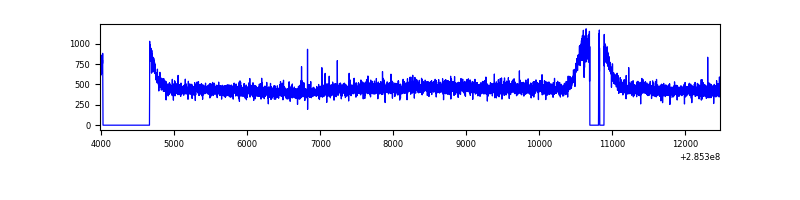 |
| B | 8492 | 7675 | 0 | 0 | 0.00% | 0.00% | 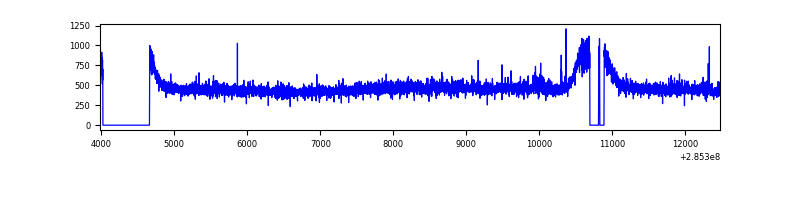 |
| C | 8492 | 7675 | 0 | 0 | 0.00% | 0.00% | 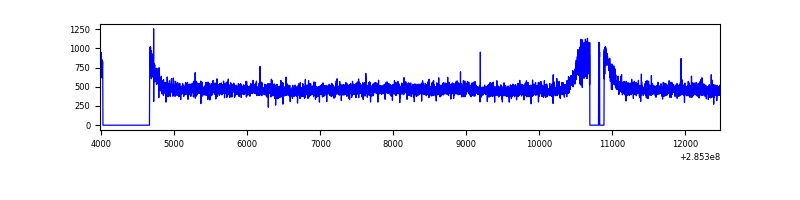 |
| D | 8492 | 7675 | 70 | 70 | 0.82% | 0.91% | 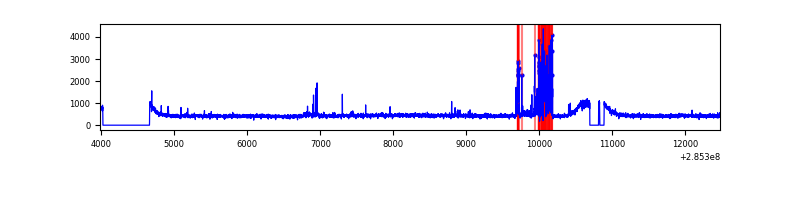 |
Top three noisy pixels from each quadrant. If the there are fewer than three noisy pixels in the level2.evt file, extra rows are filled as -1
| Pixel properties | Quadrant properties | ||||||
|---|---|---|---|---|---|---|---|
| Quadrant | DetID | PixID | Counts | Sigma | Mean | Median | Sigma |
| A | 0 | 226 | 7853 | 36.63 | 927 | 904 | 189.7 |
| A | 3 | 137 | 7411 | 34.3 | 927 | 904 | 189.7 |
| A | 12 | 194 | 6636 | 30.21 | 927 | 904 | 189.7 |
| B | 12 | 111 | 22616 | 119.86 | 929 | 901 | 181.2 |
| B | 11 | 111 | 19450 | 102.38 | 929 | 901 | 181.2 |
| B | 14 | 111 | 16632 | 86.83 | 929 | 901 | 181.2 |
| C | 14 | 238 | 135599 | 634.39 | 896 | 902 | 212.3 |
| C | 3 | 233 | 52106 | 241.16 | 896 | 902 | 212.3 |
| C | 5 | 218 | 31965 | 146.3 | 896 | 902 | 212.3 |
| D | 7 | 238 | 309329 | 1402.46 | 902 | 874 | 219.9 |
| D | 2 | 234 | 34577 | 153.24 | 902 | 874 | 219.9 |
| D | 7 | 96 | 24103 | 105.62 | 902 | 874 | 219.9 |
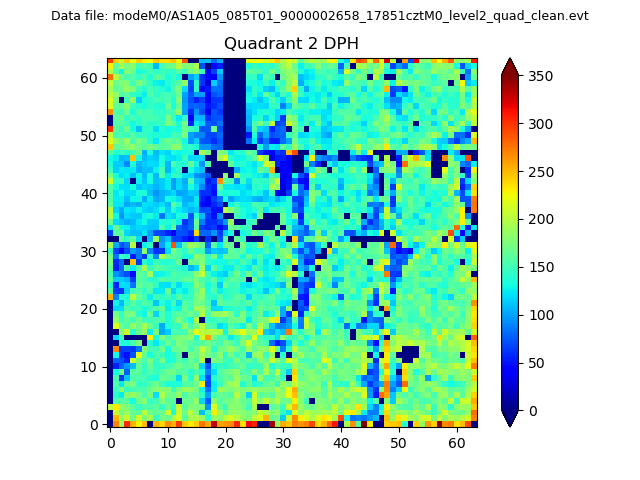
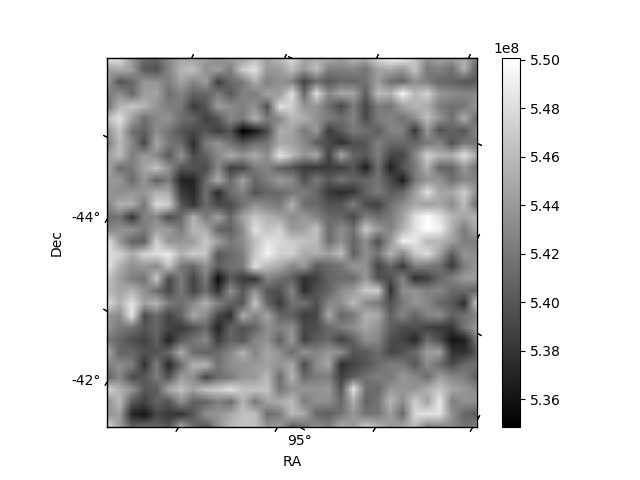
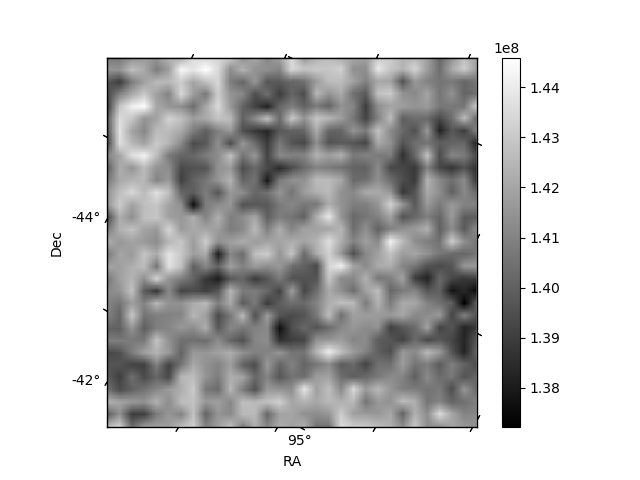
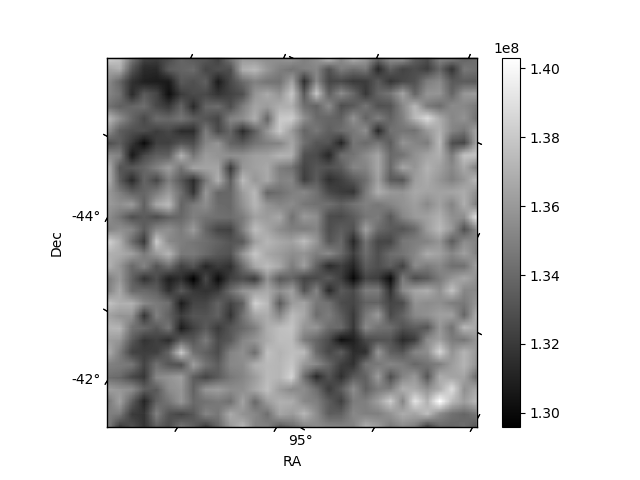
Histogram calculated using DETX and DETY for each event in the final _common_clean file
| Quadrant A | 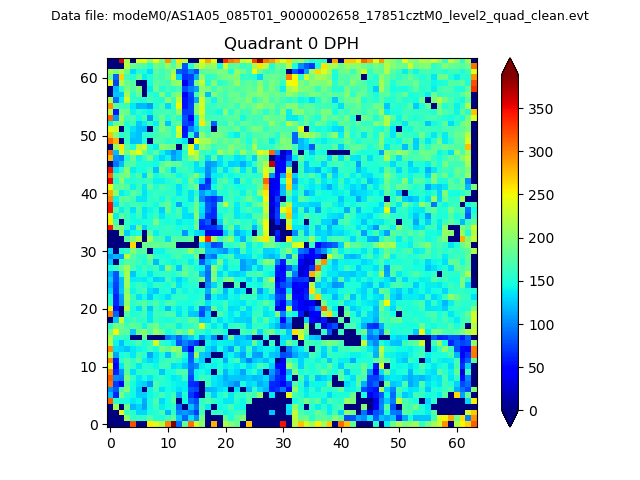 |
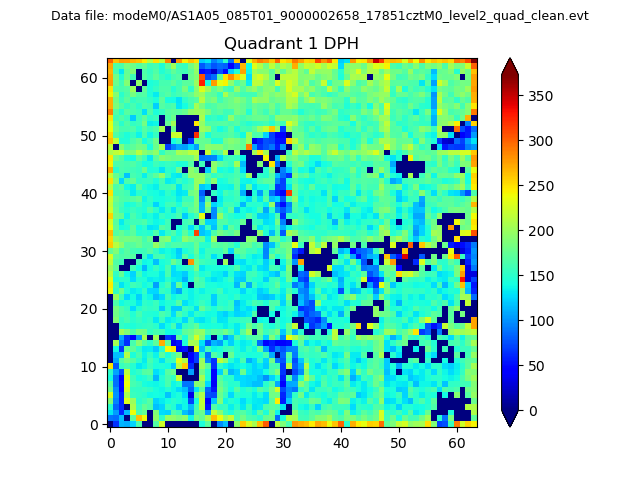 |
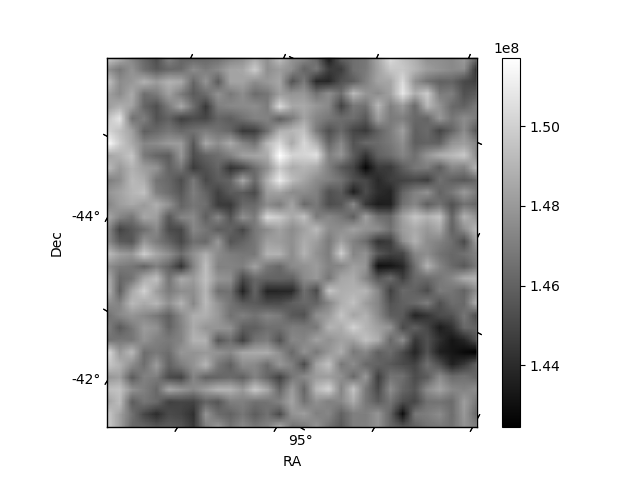
Quadrant B |
|---|---|---|---|
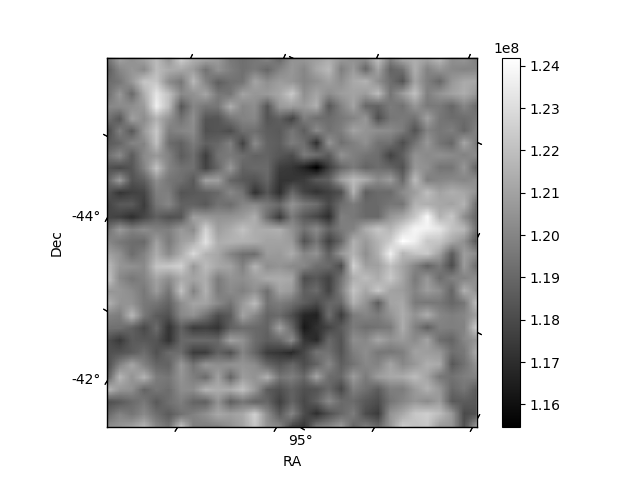
| Quadrant D | 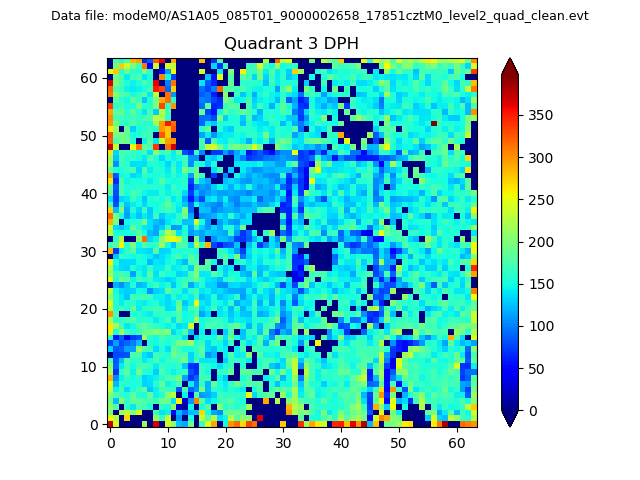 |
 |
Quadrant C |
| Plot type | Count rate plots | Images |
|---|---|---|
| Comparison with Poisson distribution Blue bars denote a histogram of data divided into 1 sec bins. Red curve is a Poisson curve with rate = median count rate of data. |
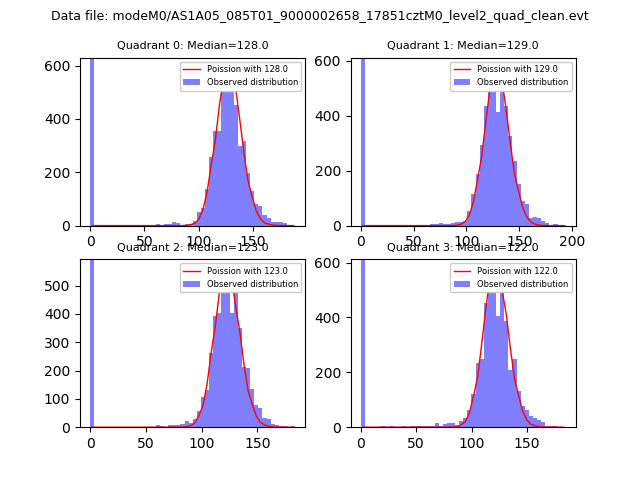 |
 |
| Quadrant-wise count rates Data is divided into 100 sec bins |
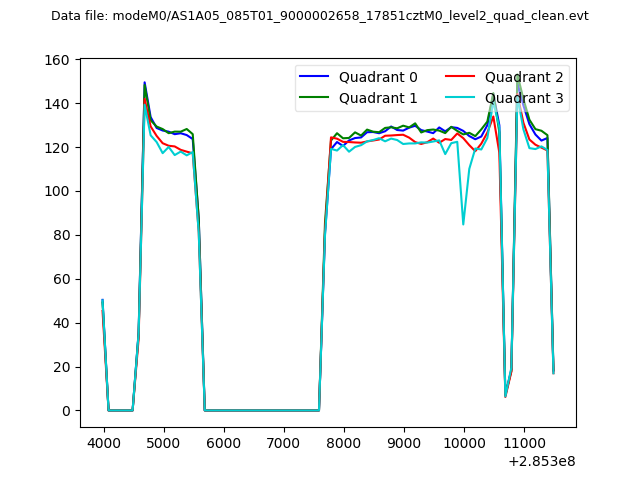 |
|
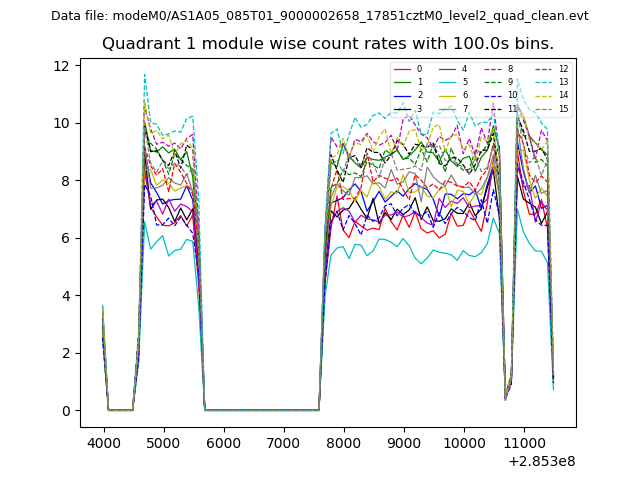
| Module-wise count rates for Quadrant A Data is divided into 100 sec bins |
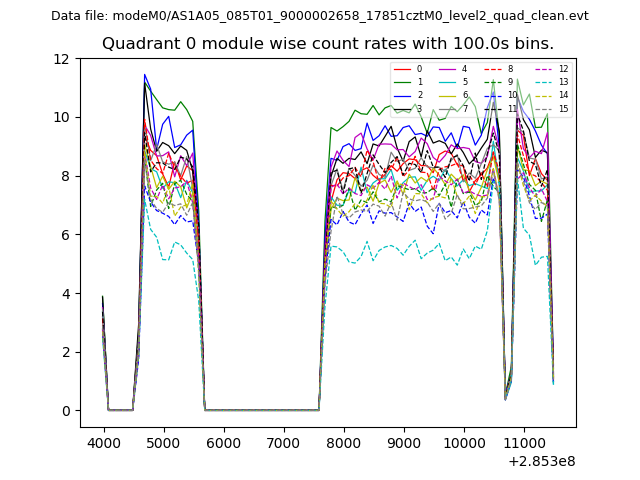 |
 |
| Module-wise count rates for Quadrant B Data is divided into 100 sec bins |
 |
 |
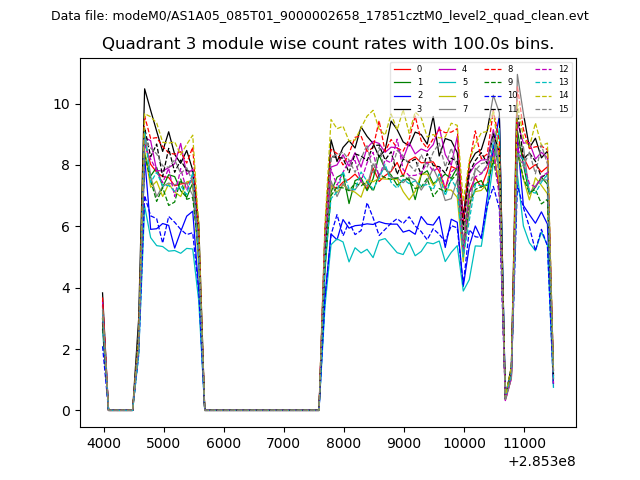
| Module-wise count rates for Quadrant C Data is divided into 100 sec bins |
 |
 |
| Module-wise count rates for Quadrant D Data is divided into 100 sec bins |
 |
 |
| Parameter | Plot |
|---|---|
| CZT HV Monitor | 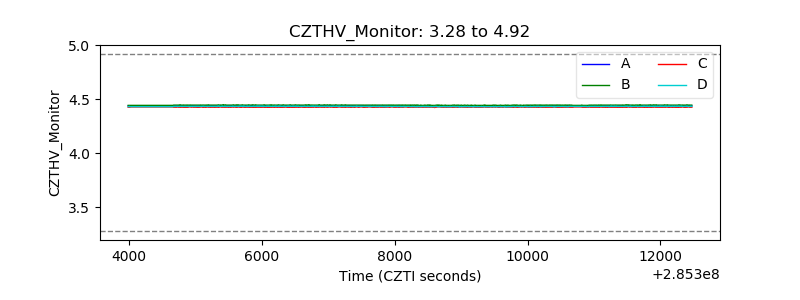 |
| D_VDD |  |
| Temperature 1 | 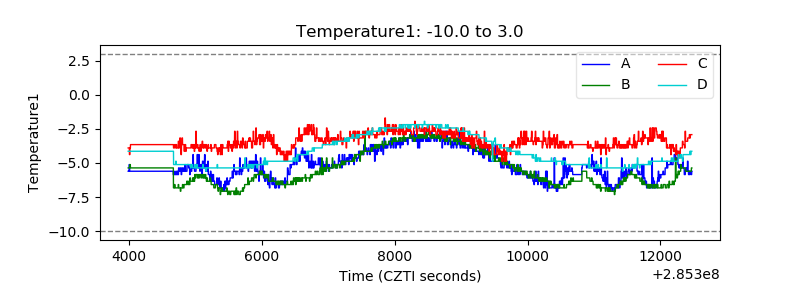 |
| Veto HV Monitor | 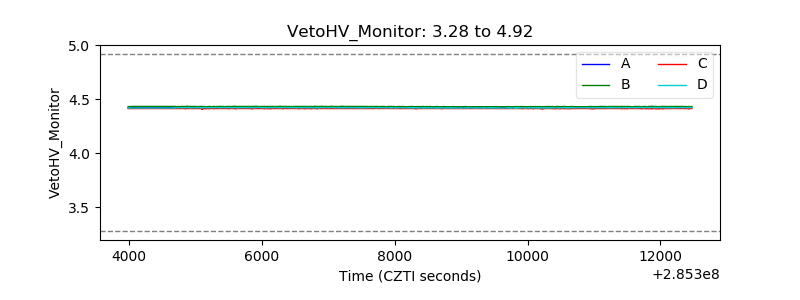 |
| Veto LLD | 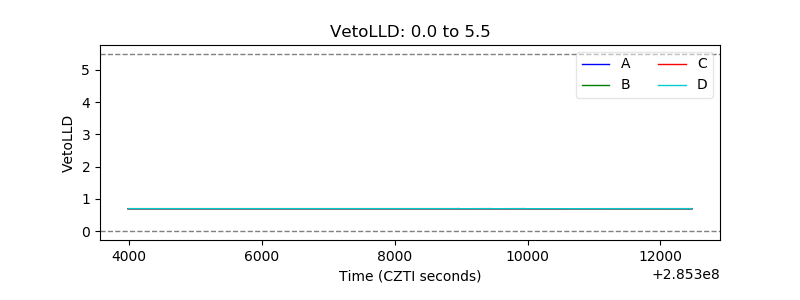 |
| Alpha Counter | 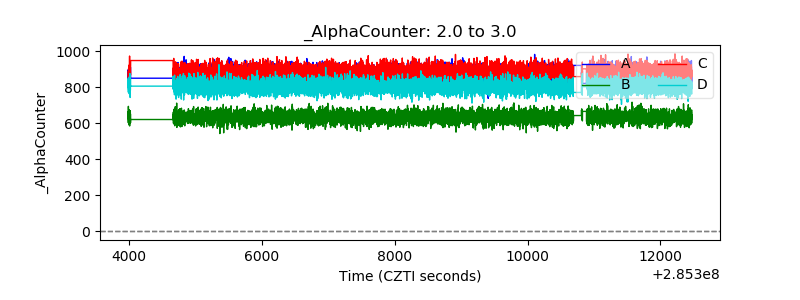 |
| _CPM_Rate | 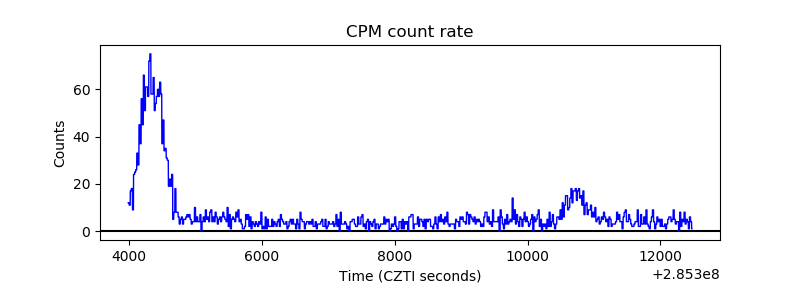 |
| CZT Counter | 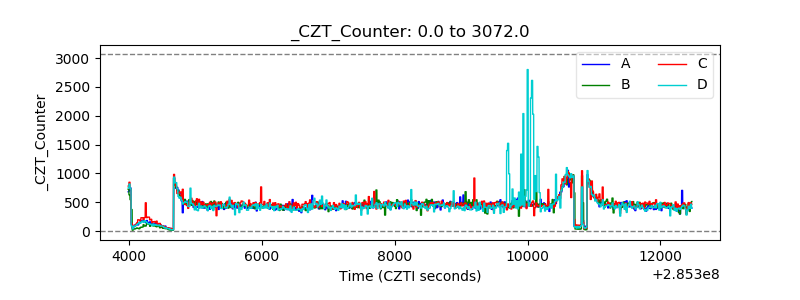 |
| +2.5 Volts monitor |  |
| +5 Volts monitor |  |
| _ROLL_ROT | 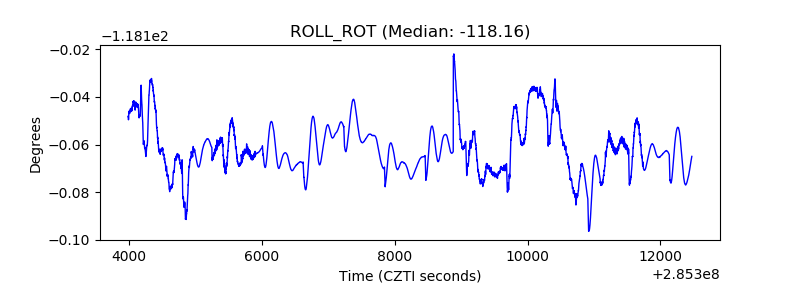 |
| _Roll_DEC | 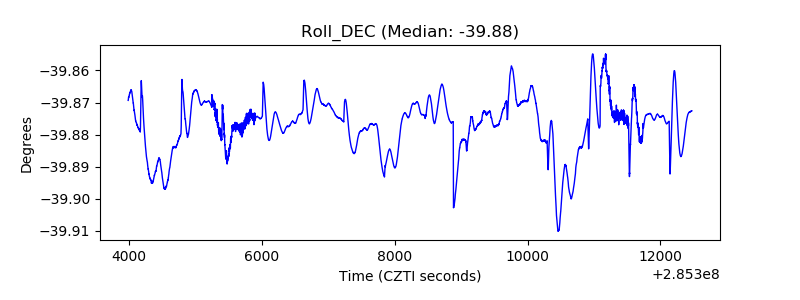 |
| _Roll_RA | 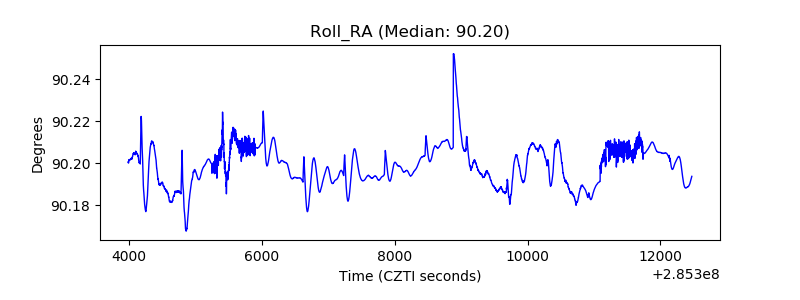 |
| Veto Counter | 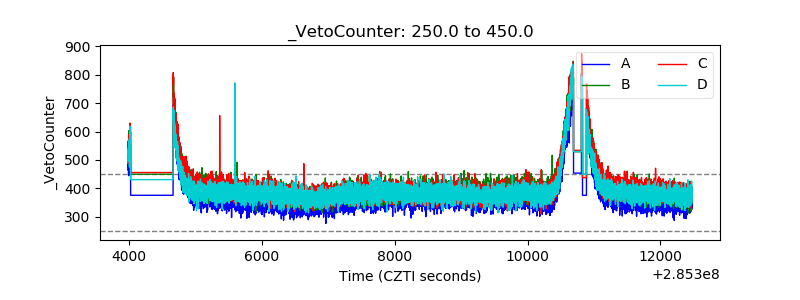 |