| Param | Original file | Final file |
|---|---|---|
| Filename | modeM0/AS1A05_085T01_9000002658_17855cztM0_level2.evt | modeM0/AS1A05_085T01_9000002658_17855cztM0_level2_quad_clean.evt |
| Size (bytes) | 446,757,120 | 88,493,760 |
| Size | 426.1 MB | 84.4 MB |
| Events in quadrant A | 3,128,043 | 564,062 |
| Events in quadrant B | 3,182,519 | 567,420 |
| Events in quadrant C | 3,226,577 | 548,254 |
| Events in quadrant D | 3,544,163 | 540,045 |
| Mode SS | |||
|---|---|---|---|
| Quadrant | BADHDUFLAG | Total packets | Discarded packets |
| A | 0 | 134 | 0 |
| B | 0 | 134 | 0 |
| C | 0 | 134 | 0 |
| D | 0 | 134 | 0 |
| Mode M9 | |||
|---|---|---|---|
| Quadrant | BADHDUFLAG | Total packets | Discarded packets |
| A | 0 | 1 | 0 |
| B | 0 | 1 | 0 |
| C | 0 | 1 | 0 |
| D | 0 | 1 | 0 |
| Mode M0 | |||
|---|---|---|---|
| Quadrant | BADHDUFLAG | Total packets | Discarded packets |
| A | 0 | 13931 | 1 |
| B | 0 | 13910 | 1 |
| C | 0 | 13922 | 1 |
| D | 0 | 15279 | 1 |
| Quadrant | Total seconds | Saturated seconds | Saturation percentage |
|---|---|---|---|
| A | 6589 | 273 | 4.143269% |
| B | 6590 | 304 | 4.613050% |
| C | 6590 | 319 | 4.840668% |
| D | 6590 | 347 | 5.265554% |
Noise dominated data is calculated using 1-second bins in cleaned event files. If a bin has >2000 counts, and if more than 50% of those come from <1% of pixels, then it is considered to be noise-dominated and hence unusable.
| Quadrant | # 1 sec bins | Bins with >0 counts | Bins with >2000 counts | High rate bins dominated by noise | Noise dominated (total time) | Noise dominated (detector-on time) | Marked lightcurve |
|---|---|---|---|---|---|---|---|
| A | 6684 | 6590 | 0 | 0 | 0.00% | 0.00% | 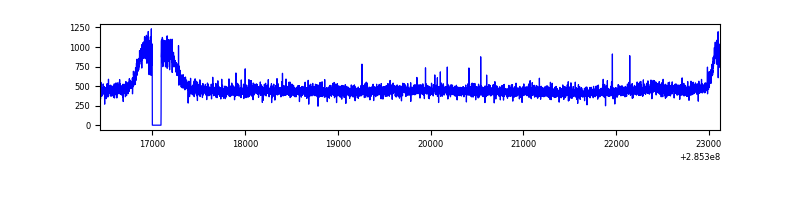 |
| B | 6685 | 6591 | 1 | 1 | 0.01% | 0.02% | 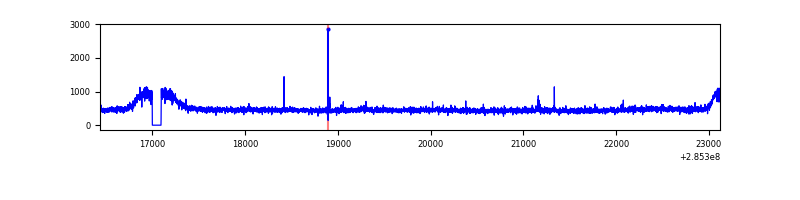 |
| C | 6685 | 6591 | 0 | 0 | 0.00% | 0.00% | 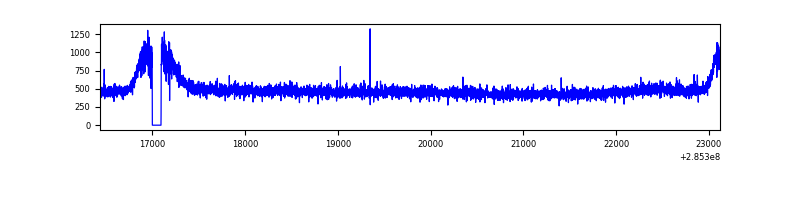 |
| D | 6685 | 6591 | 105 | 105 | 1.57% | 1.59% | 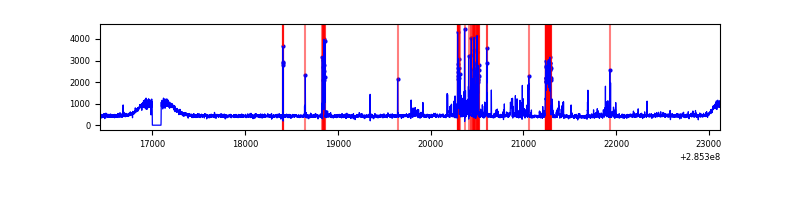 |
Top three noisy pixels from each quadrant. If the there are fewer than three noisy pixels in the level2.evt file, extra rows are filled as -1
| Pixel properties | Quadrant properties | ||||||
|---|---|---|---|---|---|---|---|
| Quadrant | DetID | PixID | Counts | Sigma | Mean | Median | Sigma |
| A | 0 | 226 | 6914 | 36.92 | 812 | 794 | 165.8 |
| A | 3 | 137 | 6712 | 35.7 | 812 | 794 | 165.8 |
| A | 12 | 194 | 5874 | 30.64 | 812 | 794 | 165.8 |
| B | 12 | 111 | 20085 | 120.14 | 807 | 784 | 160.7 |
| B | 11 | 111 | 17126 | 101.72 | 807 | 784 | 160.7 |
| B | 14 | 111 | 14940 | 88.11 | 807 | 784 | 160.7 |
| C | 14 | 238 | 117932 | 626.27 | 780 | 785 | 187.1 |
| C | 5 | 218 | 32712 | 170.68 | 780 | 785 | 187.1 |
| C | 3 | 233 | 31572 | 164.59 | 780 | 785 | 187.1 |
| D | 7 | 238 | 467633 | 2176.52 | 784 | 767 | 214.5 |
| D | 10 | 70 | 49423 | 226.83 | 784 | 767 | 214.5 |
| D | 2 | 234 | 33121 | 150.83 | 784 | 767 | 214.5 |
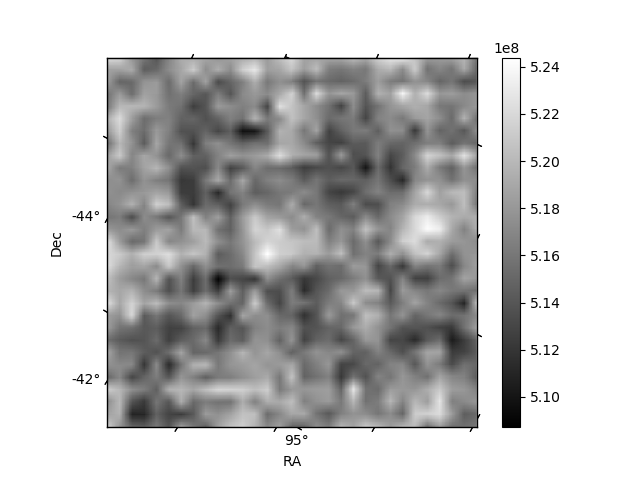
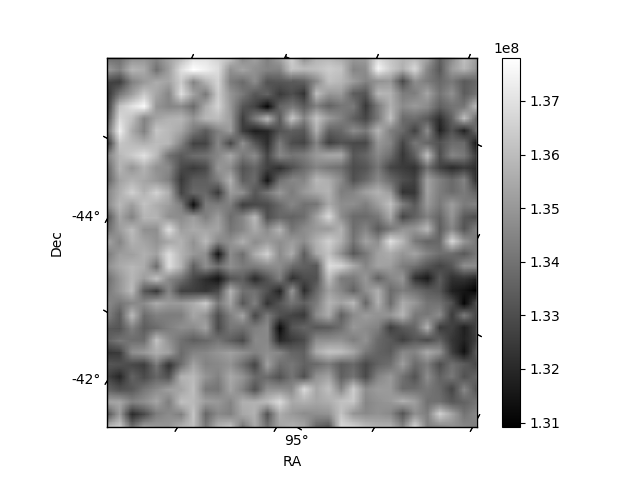
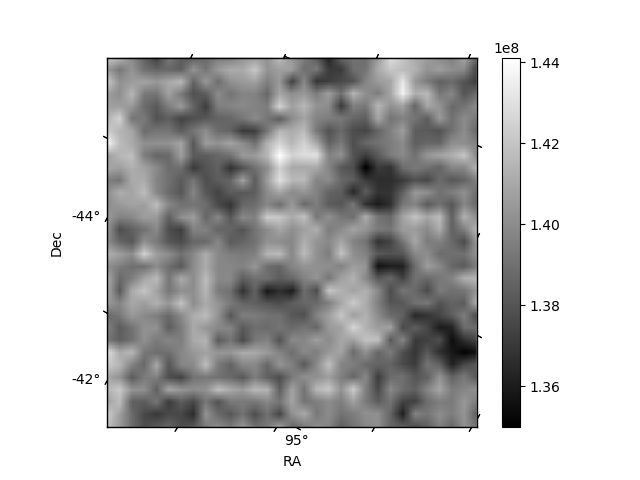
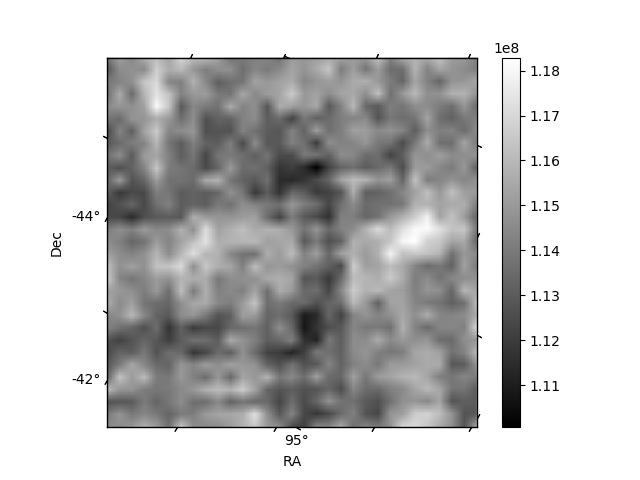
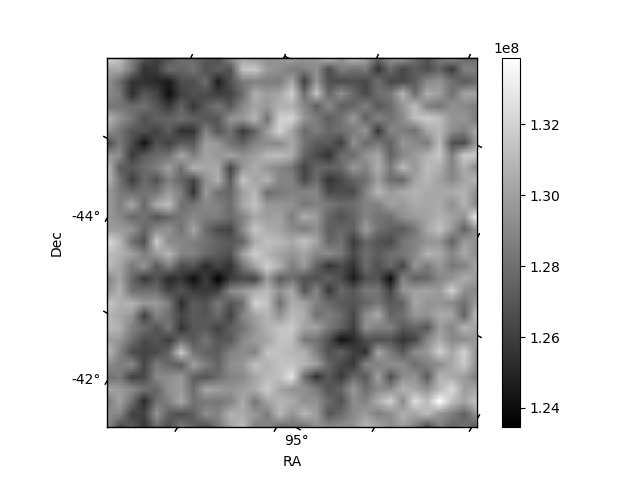
Histogram calculated using DETX and DETY for each event in the final _common_clean file
| Quadrant A | 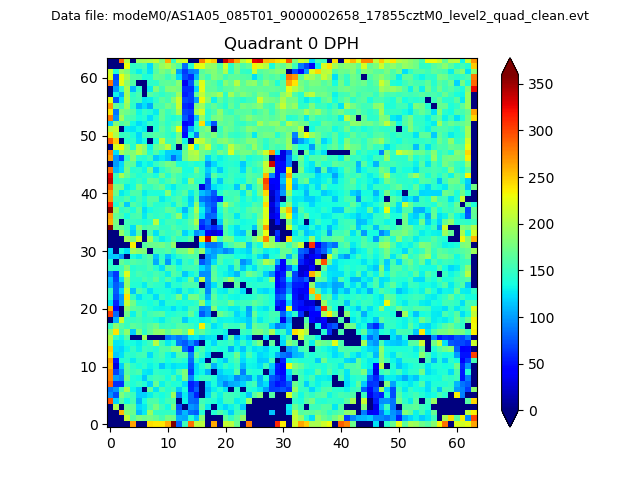 |
 |
Quadrant B |
|---|---|---|---|
| Quadrant D | 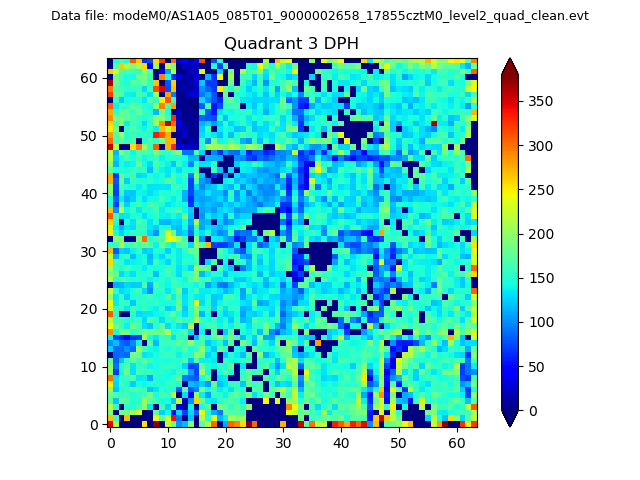 |
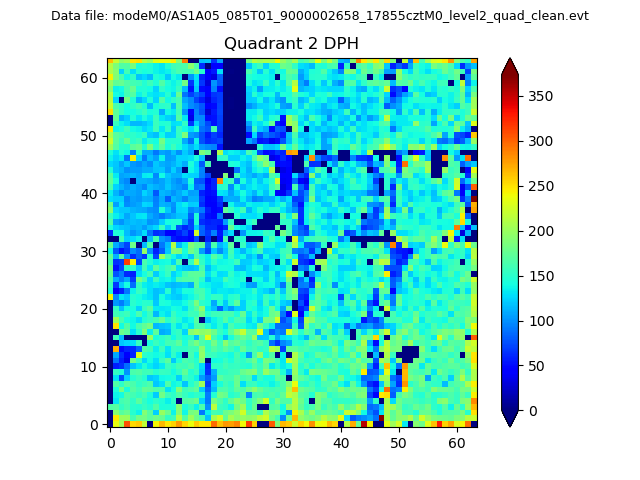 |
Quadrant C |
| Plot type | Count rate plots | Images |
|---|---|---|
| Comparison with Poisson distribution Blue bars denote a histogram of data divided into 1 sec bins. Red curve is a Poisson curve with rate = median count rate of data. |
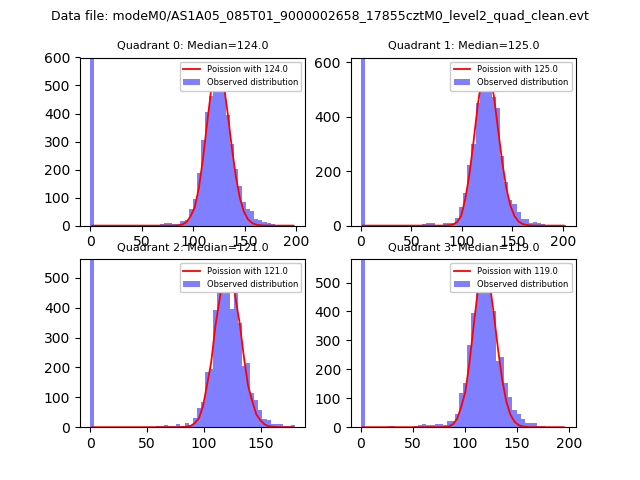 |
 |
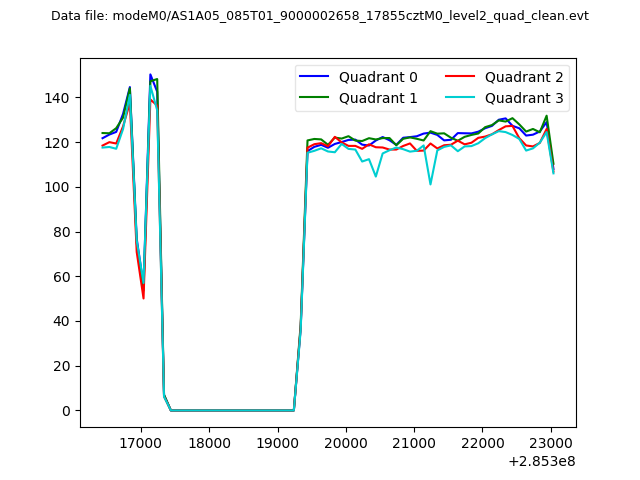
| Quadrant-wise count rates Data is divided into 100 sec bins |
 |
|
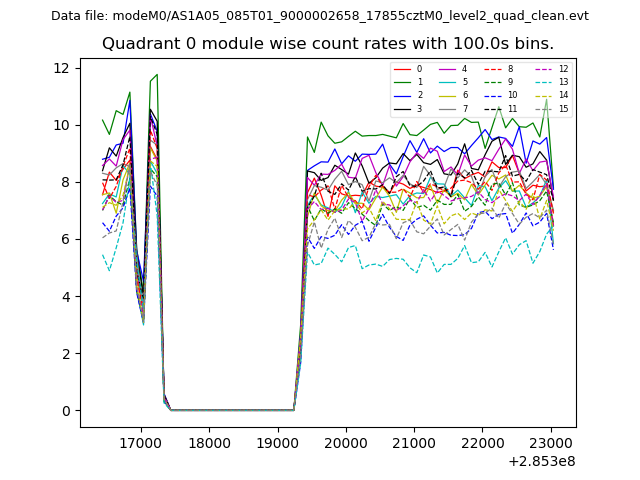
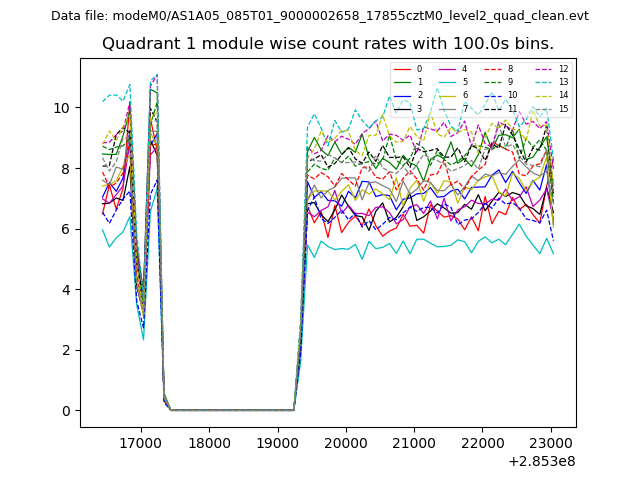
| Module-wise count rates for Quadrant A Data is divided into 100 sec bins |
 |
 |
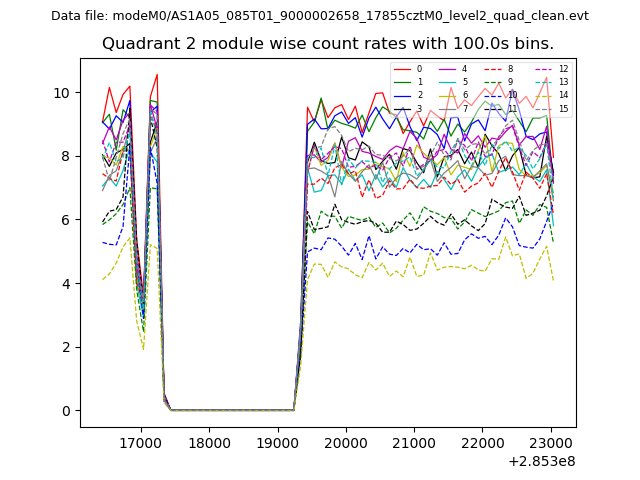
| Module-wise count rates for Quadrant B Data is divided into 100 sec bins |
 |
 |
| Module-wise count rates for Quadrant C Data is divided into 100 sec bins |
 |
 |
| Module-wise count rates for Quadrant D Data is divided into 100 sec bins |
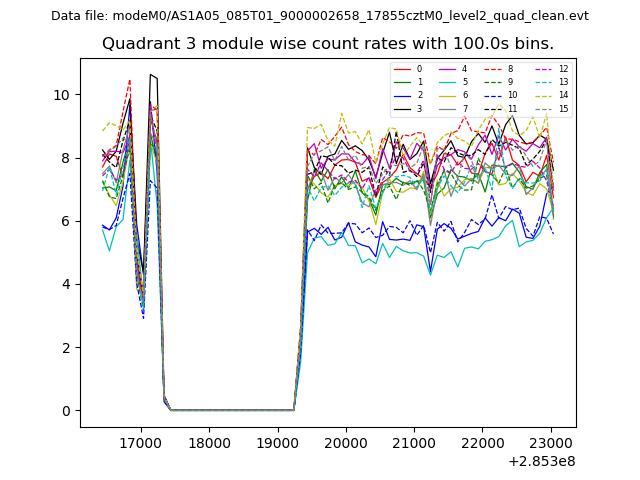 |
 |
| Parameter | Plot |
|---|---|
| CZT HV Monitor | 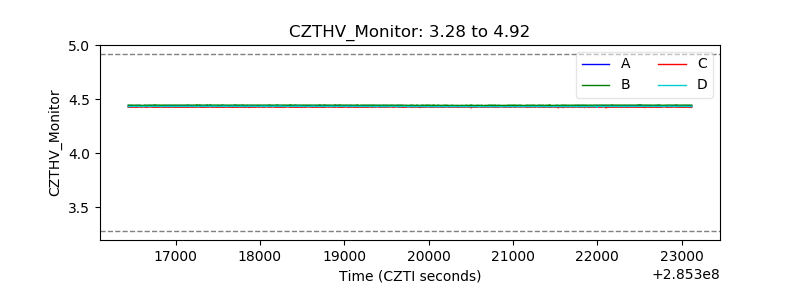 |
| D_VDD | 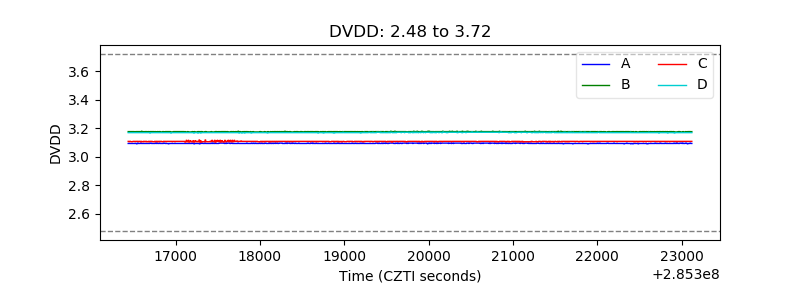 |
| Temperature 1 | 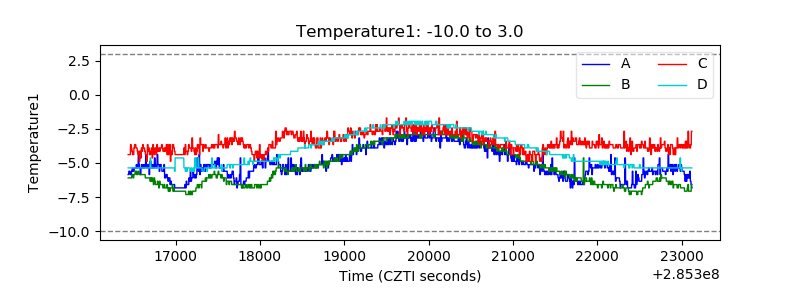 |
| Veto HV Monitor | 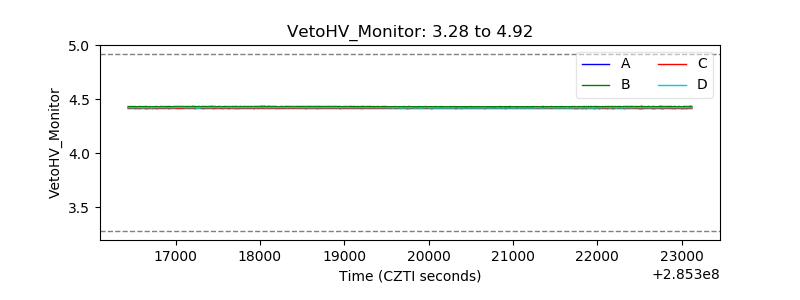 |
| Veto LLD |  |
| Alpha Counter | 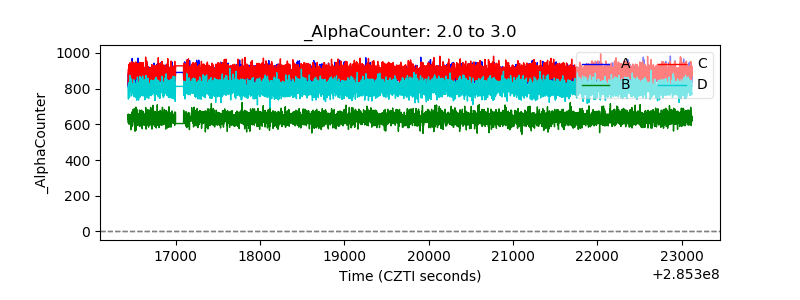 |
| _CPM_Rate |  |
| CZT Counter | 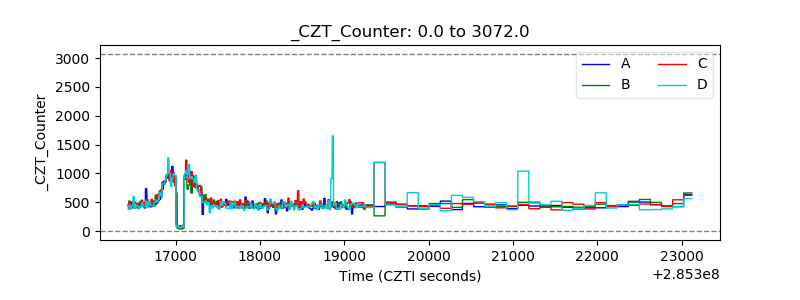 |
| +2.5 Volts monitor |  |
| +5 Volts monitor |  |
| _ROLL_ROT | 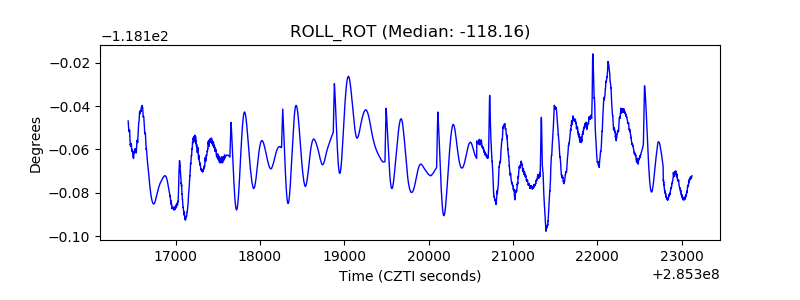 |
| _Roll_DEC | 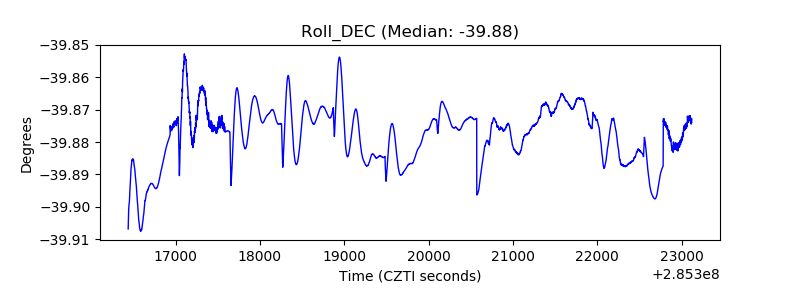 |
| _Roll_RA | 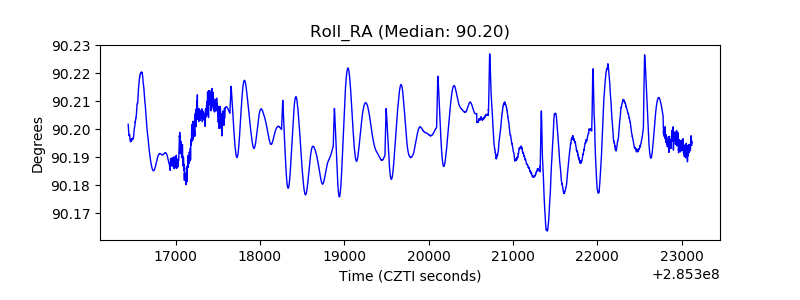 |
| Veto Counter | 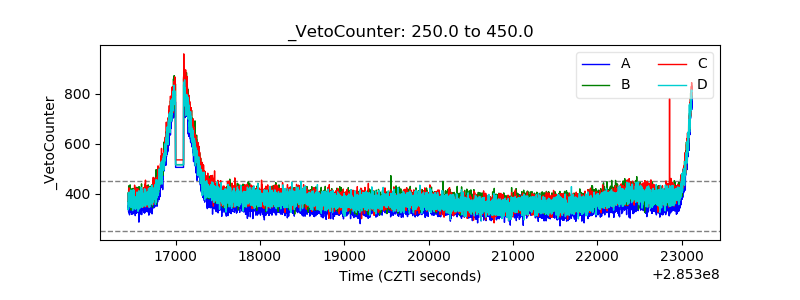 |