| Param | Original file | Final file |
|---|---|---|
| Filename | modeM0/AS1A05_085T01_9000002658_17856cztM0_level2.evt | modeM0/AS1A05_085T01_9000002658_17856cztM0_level2_quad_clean.evt |
| Size (bytes) | 1,156,878,720 | 236,180,160 |
| Size | 1.1 GB | 225.2 MB |
| Events in quadrant A | 7,727,996 | 1,527,060 |
| Events in quadrant B | 7,961,879 | 1,527,558 |
| Events in quadrant C | 7,950,187 | 1,485,379 |
| Events in quadrant D | 10,238,926 | 1,434,423 |
| Mode SS | |||
|---|---|---|---|
| Quadrant | BADHDUFLAG | Total packets | Discarded packets |
| A | 0 | 348 | 0 |
| B | 0 | 348 | 0 |
| C | 0 | 348 | 0 |
| D | 0 | 348 | 0 |
| Mode M9 | |||
|---|---|---|---|
| Quadrant | BADHDUFLAG | Total packets | Discarded packets |
| A | 0 | 17 | 0 |
| B | 0 | 17 | 0 |
| C | 0 | 17 | 0 |
| D | 0 | 17 | 0 |
| Mode M0 | |||
|---|---|---|---|
| Quadrant | BADHDUFLAG | Total packets | Discarded packets |
| A | 0 | 34861 | 3 |
| B | 0 | 35207 | 3 |
| C | 0 | 34974 | 3 |
| D | 0 | 42537 | 3 |
| Quadrant | Total seconds | Saturated seconds | Saturation percentage |
|---|---|---|---|
| A | 17097 | 211 | 1.234135% |
| B | 17097 | 263 | 1.538282% |
| C | 17096 | 285 | 1.667057% |
| D | 17097 | 773 | 4.521261% |
Noise dominated data is calculated using 1-second bins in cleaned event files. If a bin has >2000 counts, and if more than 50% of those come from <1% of pixels, then it is considered to be noise-dominated and hence unusable.
| Quadrant | # 1 sec bins | Bins with >0 counts | Bins with >2000 counts | High rate bins dominated by noise | Noise dominated (total time) | Noise dominated (detector-on time) | Marked lightcurve |
|---|---|---|---|---|---|---|---|
| A | 18797 | 17098 | 0 | 0 | 0.00% | 0.00% | 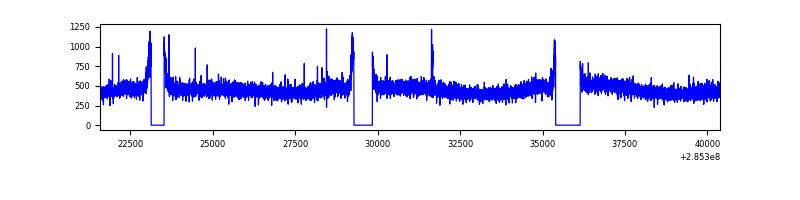 |
| B | 18797 | 17098 | 14 | 14 | 0.07% | 0.08% | 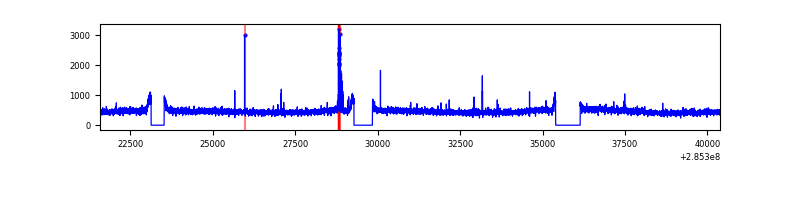 |
| C | 18796 | 17099 | 0 | 0 | 0.00% | 0.00% | 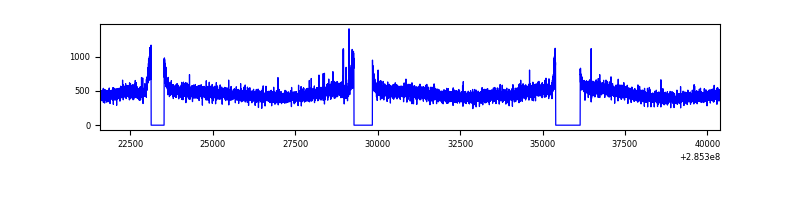 |
| D | 18797 | 17099 | 533 | 533 | 2.84% | 3.12% | 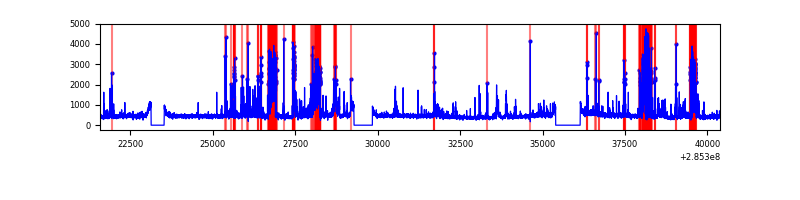 |
Top three noisy pixels from each quadrant. If the there are fewer than three noisy pixels in the level2.evt file, extra rows are filled as -1
| Pixel properties | Quadrant properties | ||||||
|---|---|---|---|---|---|---|---|
| Quadrant | DetID | PixID | Counts | Sigma | Mean | Median | Sigma |
| A | 0 | 226 | 17329 | 37.99 | 2007 | 1963 | 404.4 |
| A | 15 | 174 | 16217 | 35.24 | 2007 | 1963 | 404.4 |
| A | 3 | 137 | 15838 | 34.31 | 2007 | 1963 | 404.4 |
| B | 15 | 222 | 99805 | 254.49 | 2000 | 1947 | 384.5 |
| B | 12 | 111 | 47901 | 119.51 | 2000 | 1947 | 384.5 |
| B | 11 | 111 | 41077 | 101.76 | 2000 | 1947 | 384.5 |
| C | 14 | 238 | 297683 | 655.78 | 1923 | 1936 | 451.0 |
| C | 3 | 233 | 102333 | 222.62 | 1923 | 1936 | 451.0 |
| C | 5 | 218 | 48849 | 104.02 | 1923 | 1936 | 451.0 |
| D | 7 | 238 | 2703950 | 5804.31 | 1923 | 1868 | 465.5 |
| D | 2 | 234 | 83845 | 176.09 | 1923 | 1868 | 465.5 |
| D | 2 | 165 | 80080 | 168.01 | 1923 | 1868 | 465.5 |
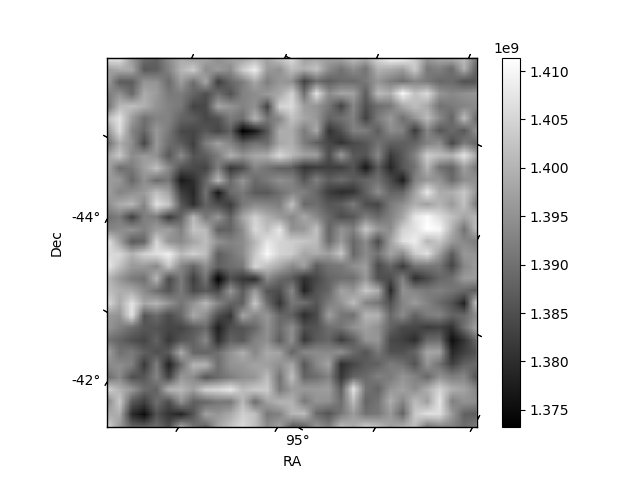
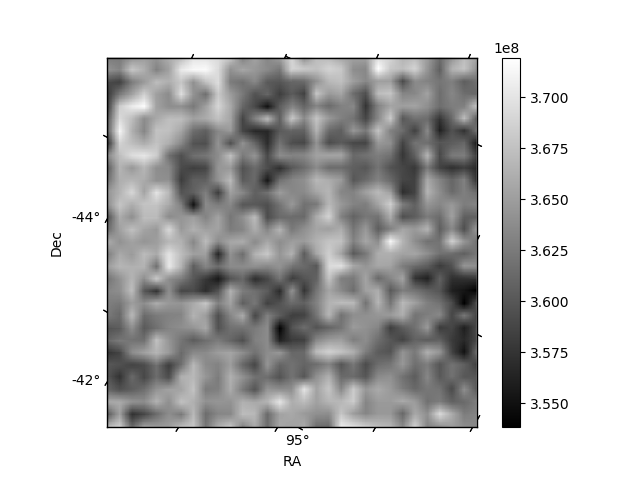
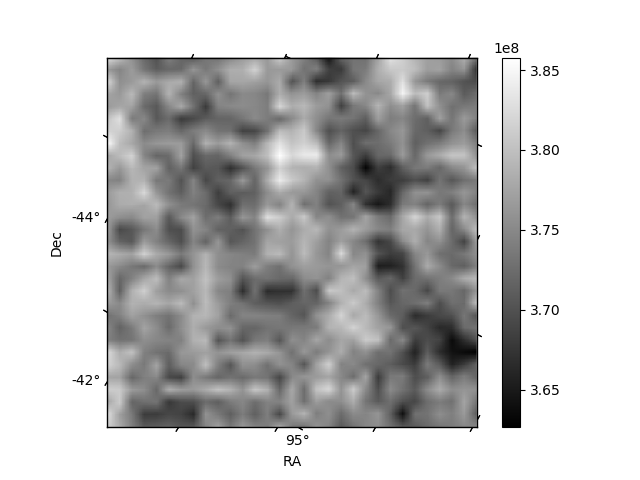
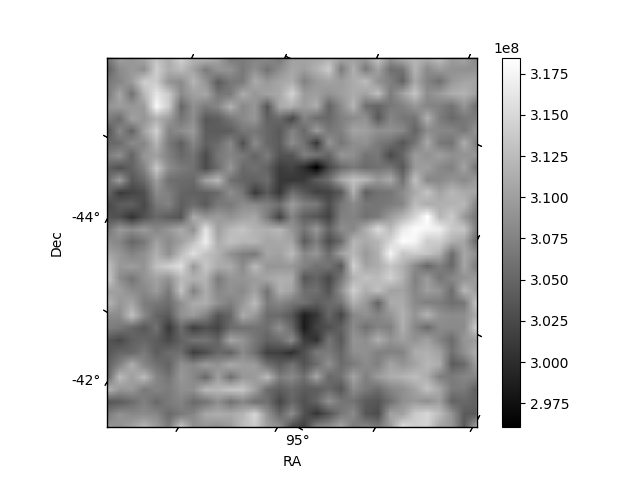
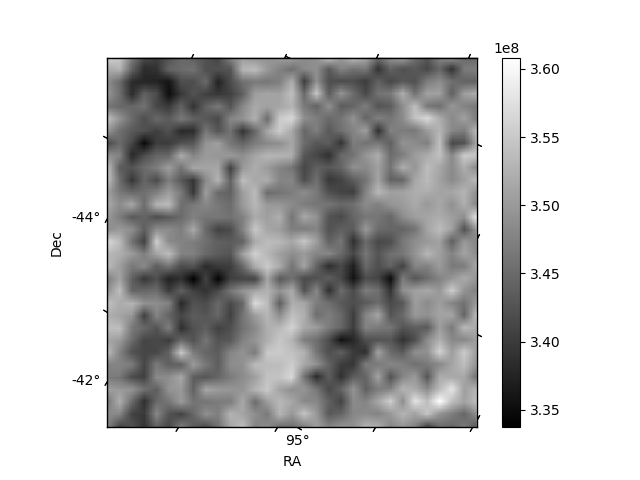
Histogram calculated using DETX and DETY for each event in the final _common_clean file
| Quadrant A | 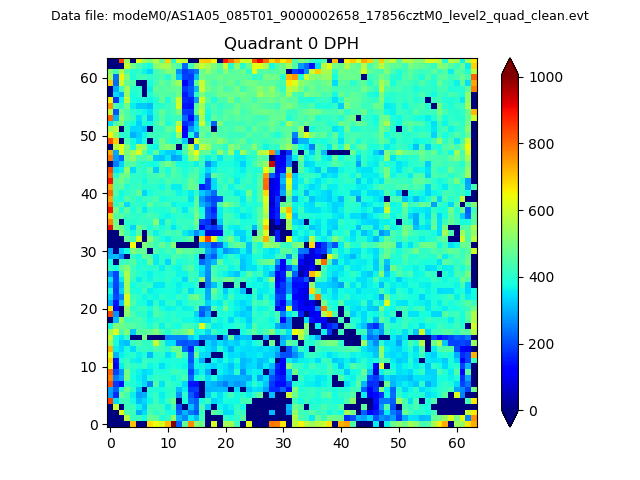 |
 |
Quadrant B |
|---|---|---|---|
| Quadrant D | 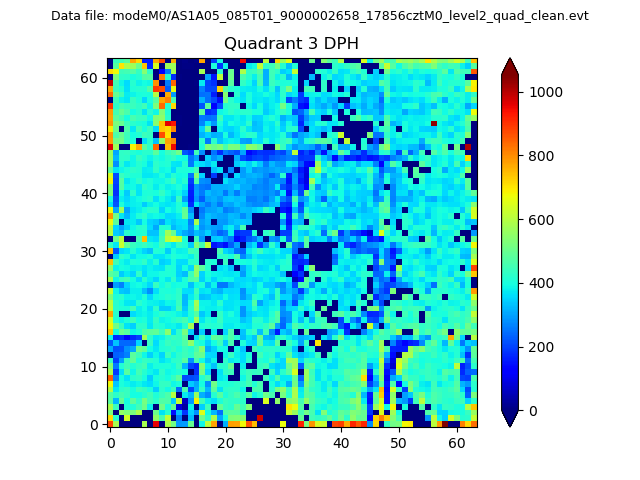 |
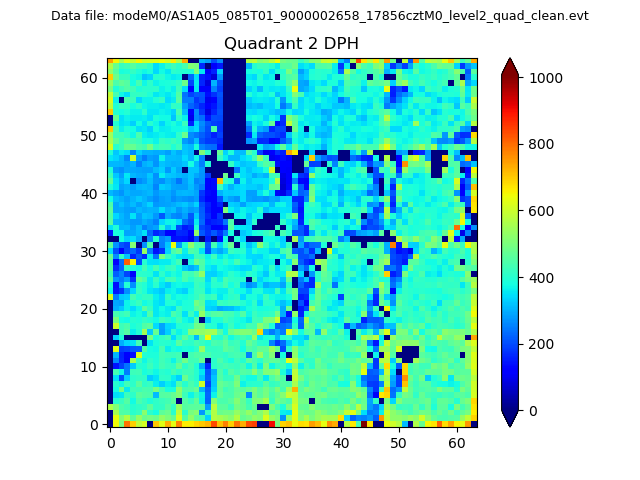 |
Quadrant C |
| Plot type | Count rate plots | Images |
|---|---|---|
| Comparison with Poisson distribution Blue bars denote a histogram of data divided into 1 sec bins. Red curve is a Poisson curve with rate = median count rate of data. |
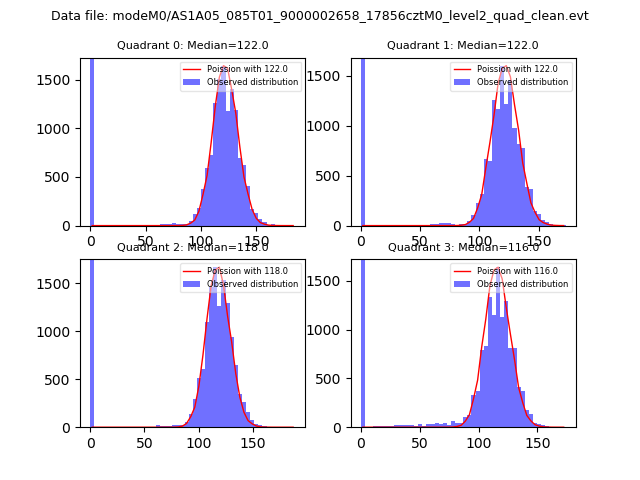 |
 |
| Quadrant-wise count rates Data is divided into 100 sec bins |
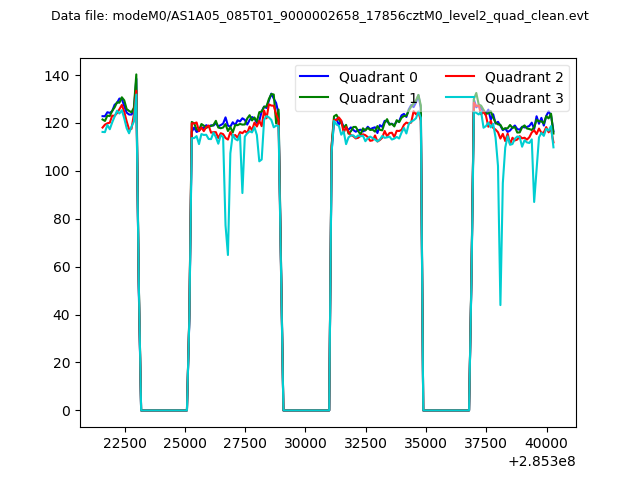 |
|
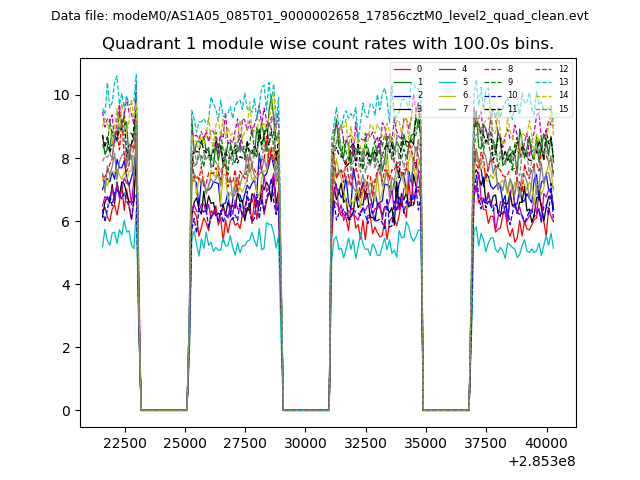
| Module-wise count rates for Quadrant A Data is divided into 100 sec bins |
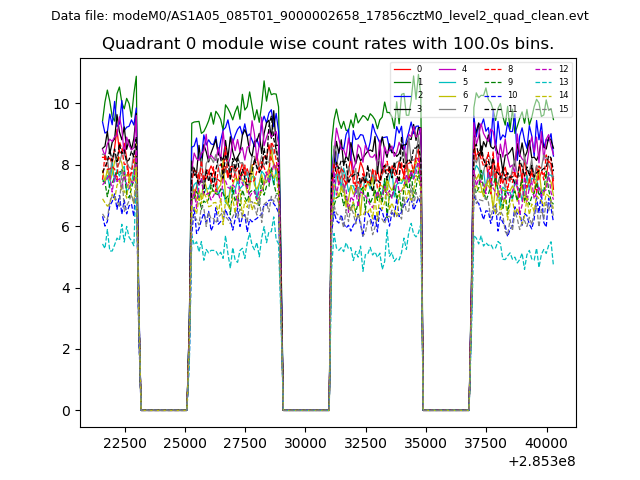 |
 |
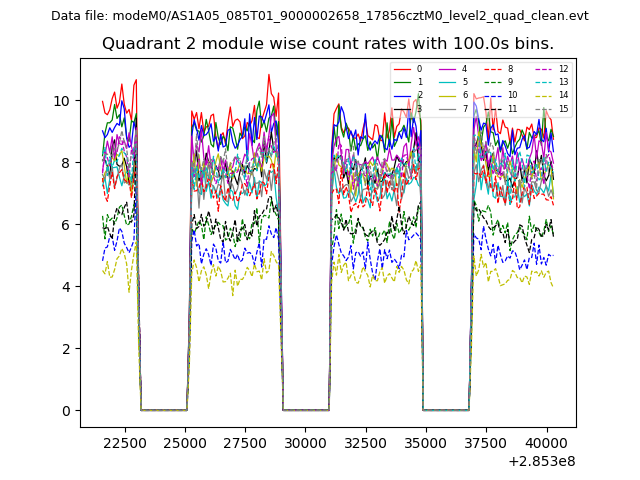
| Module-wise count rates for Quadrant B Data is divided into 100 sec bins |
 |
 |
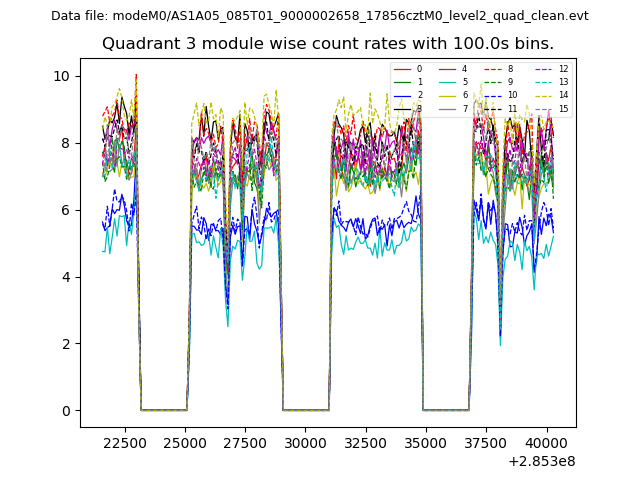
| Module-wise count rates for Quadrant C Data is divided into 100 sec bins |
 |
 |
| Module-wise count rates for Quadrant D Data is divided into 100 sec bins |
 |
 |
| Parameter | Plot |
|---|---|
| CZT HV Monitor | 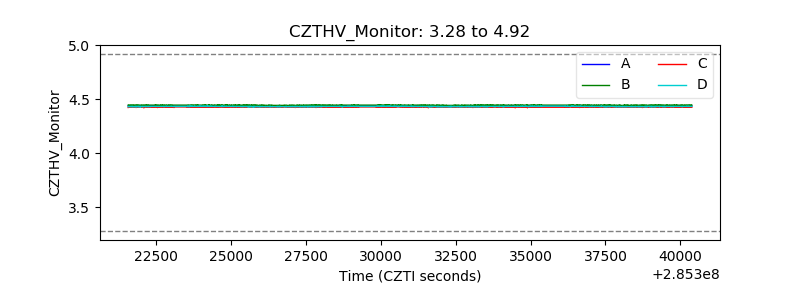 |
| D_VDD | 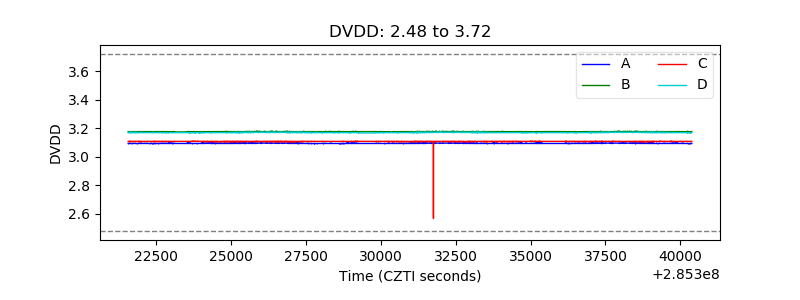 |
| Temperature 1 | 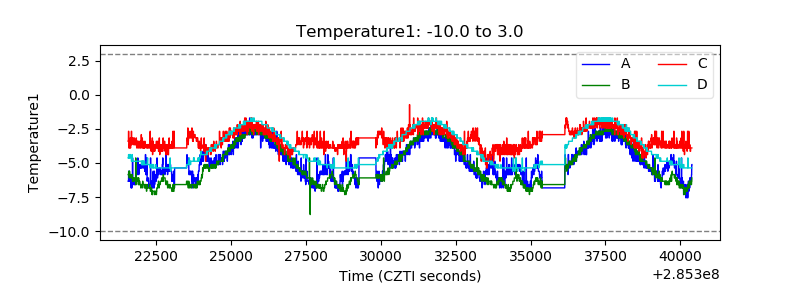 |
| Veto HV Monitor |  |
| Veto LLD | 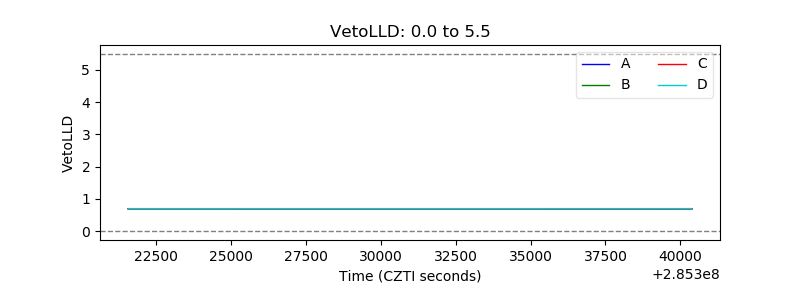 |
| Alpha Counter | 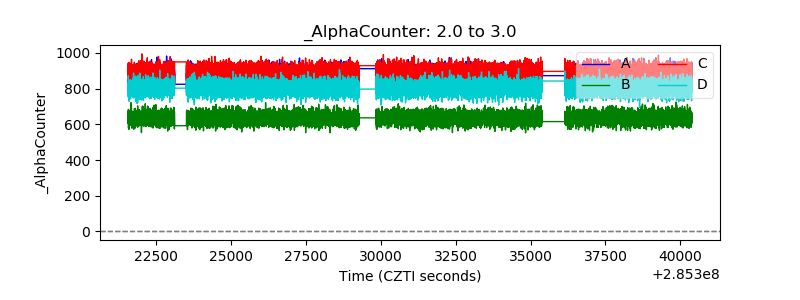 |
| _CPM_Rate | 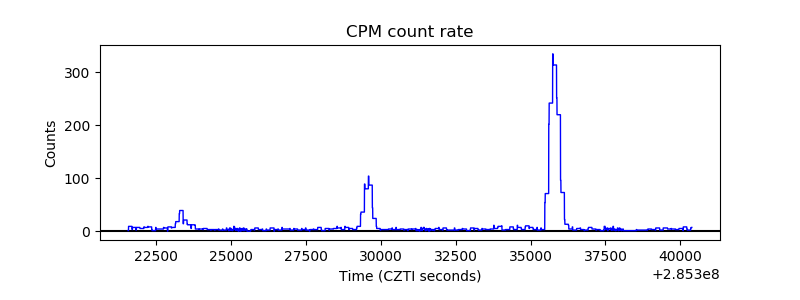 |
| CZT Counter | 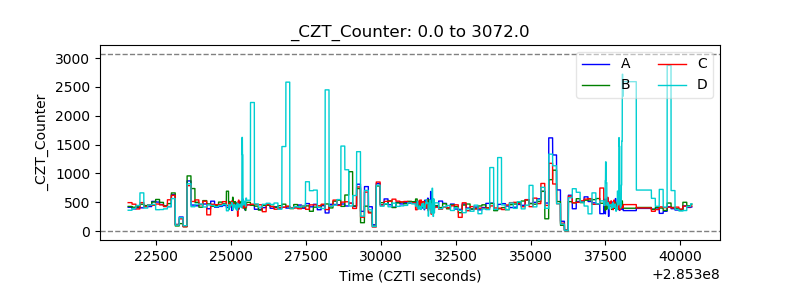 |
| +2.5 Volts monitor |  |
| +5 Volts monitor |  |
| _ROLL_ROT | 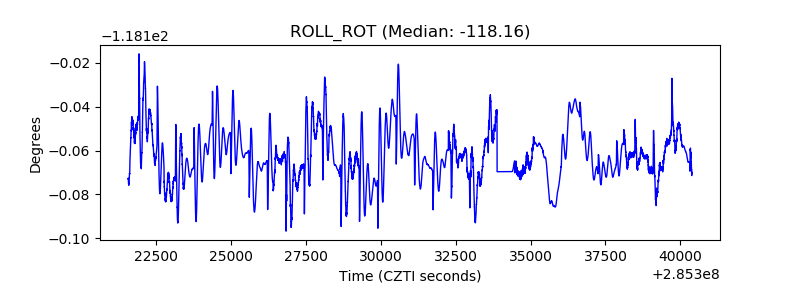 |
| _Roll_DEC | 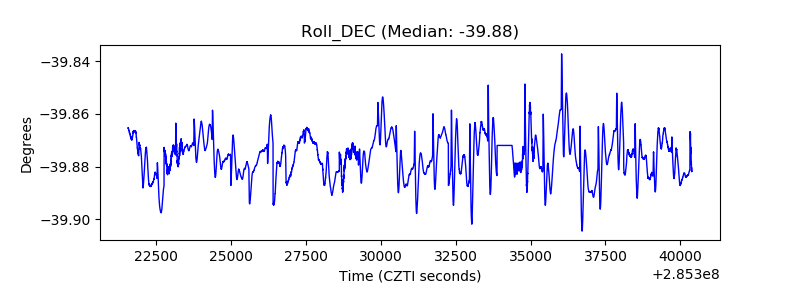 |
| _Roll_RA |  |
| Veto Counter | 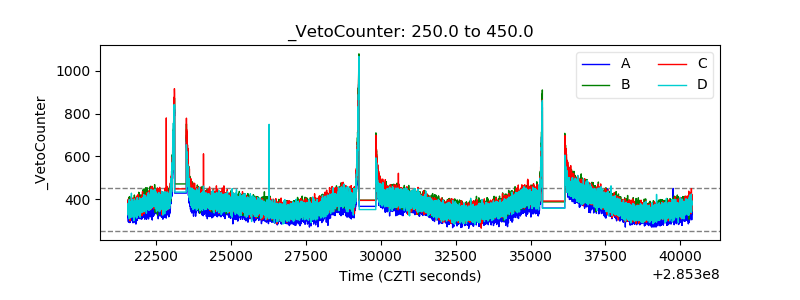 |