| Param | Original file | Final file |
|---|---|---|
| Filename | modeM0/AS1A05_085T01_9000002658_17858cztM0_level2.evt | modeM0/AS1A05_085T01_9000002658_17858cztM0_level2_quad_clean.evt |
| Size (bytes) | 680,178,240 | 135,089,280 |
| Size | 648.7 MB | 128.8 MB |
| Events in quadrant A | 4,280,221 | 903,245 |
| Events in quadrant B | 4,380,580 | 903,825 |
| Events in quadrant C | 4,350,169 | 861,091 |
| Events in quadrant D | 6,970,404 | 790,736 |
| Mode SS | |||
|---|---|---|---|
| Quadrant | BADHDUFLAG | Total packets | Discarded packets |
| A | 0 | 186 | 0 |
| B | 0 | 186 | 0 |
| C | 0 | 186 | 0 |
| D | 0 | 186 | 0 |
| Mode M9 | |||
|---|---|---|---|
| Quadrant | BADHDUFLAG | Total packets | Discarded packets |
| A | 0 | 20 | 0 |
| B | 0 | 20 | 0 |
| C | 0 | 20 | 0 |
| D | 0 | 20 | 0 |
| Mode M0 | |||
|---|---|---|---|
| Quadrant | BADHDUFLAG | Total packets | Discarded packets |
| A | 0 | 18966 | 2 |
| B | 0 | 19081 | 2 |
| C | 0 | 18932 | 2 |
| D | 0 | 26908 | 2 |
| Quadrant | Total seconds | Saturated seconds | Saturation percentage |
|---|---|---|---|
| A | 9114 | 114 | 1.250823% |
| B | 9115 | 123 | 1.349424% |
| C | 9115 | 144 | 1.579813% |
| D | 9115 | 808 | 8.864509% |
Noise dominated data is calculated using 1-second bins in cleaned event files. If a bin has >2000 counts, and if more than 50% of those come from <1% of pixels, then it is considered to be noise-dominated and hence unusable.
| Quadrant | # 1 sec bins | Bins with >0 counts | Bins with >2000 counts | High rate bins dominated by noise | Noise dominated (total time) | Noise dominated (detector-on time) | Marked lightcurve |
|---|---|---|---|---|---|---|---|
| A | 11124 | 9114 | 2 | 2 | 0.02% | 0.02% | 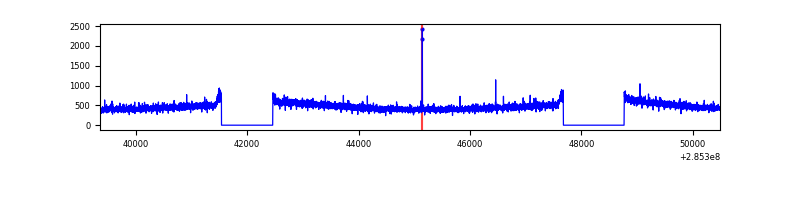 |
| B | 11125 | 9116 | 0 | 0 | 0.00% | 0.00% | 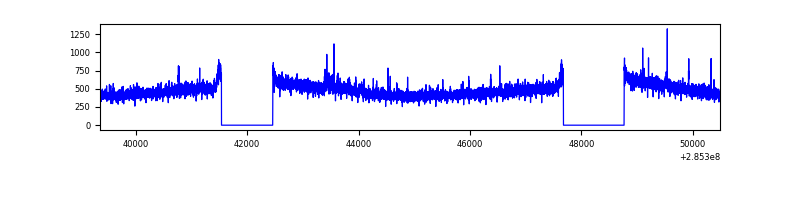 |
| C | 11125 | 9115 | 0 | 0 | 0.00% | 0.00% | 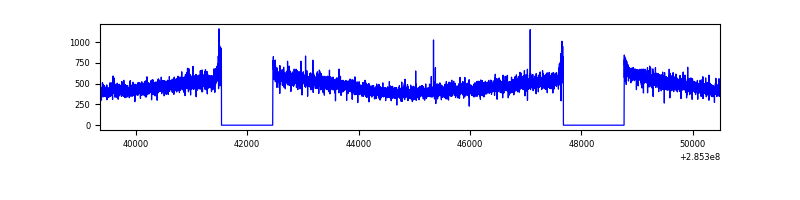 |
| D | 11125 | 9116 | 675 | 675 | 6.07% | 7.40% | 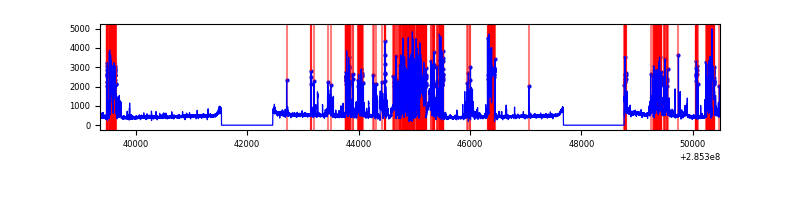 |
Top three noisy pixels from each quadrant. If the there are fewer than three noisy pixels in the level2.evt file, extra rows are filled as -1
| Pixel properties | Quadrant properties | ||||||
|---|---|---|---|---|---|---|---|
| Quadrant | DetID | PixID | Counts | Sigma | Mean | Median | Sigma |
| A | 0 | 226 | 9712 | 38.6 | 1112 | 1092 | 223.3 |
| A | 3 | 137 | 8345 | 32.48 | 1112 | 1092 | 223.3 |
| A | 15 | 174 | 8280 | 32.19 | 1112 | 1092 | 223.3 |
| B | 0 | 183 | 27091 | 124.19 | 1109 | 1083 | 209.4 |
| B | 12 | 111 | 25999 | 118.98 | 1109 | 1083 | 209.4 |
| B | 11 | 111 | 21944 | 99.61 | 1109 | 1083 | 209.4 |
| C | 14 | 238 | 164217 | 662.93 | 1058 | 1065 | 246.1 |
| C | 3 | 233 | 50545 | 201.05 | 1058 | 1065 | 246.1 |
| C | 13 | 61 | 7358 | 25.57 | 1058 | 1065 | 246.1 |
| D | 7 | 238 | 3000084 | 11918.58 | 1034 | 1004 | 251.6 |
| D | 2 | 234 | 40192 | 155.74 | 1034 | 1004 | 251.6 |
| D | 1 | 52 | 19480 | 73.43 | 1034 | 1004 | 251.6 |
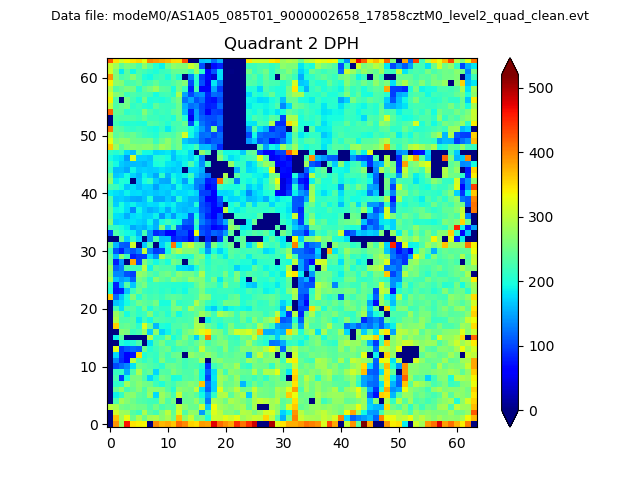
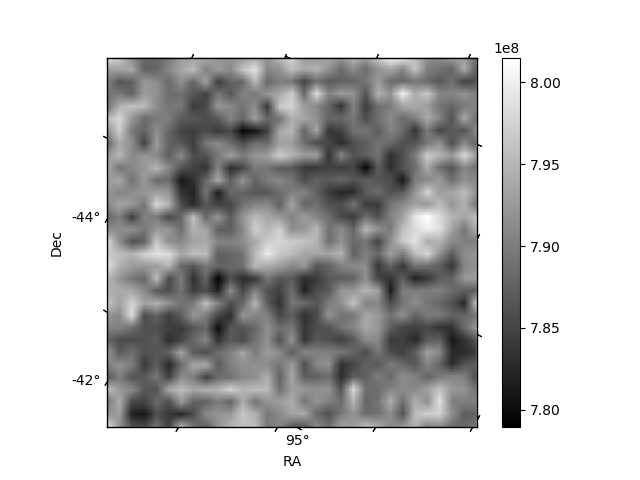
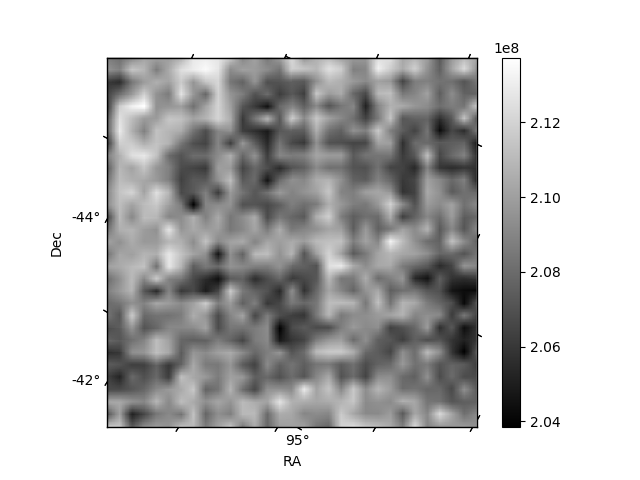
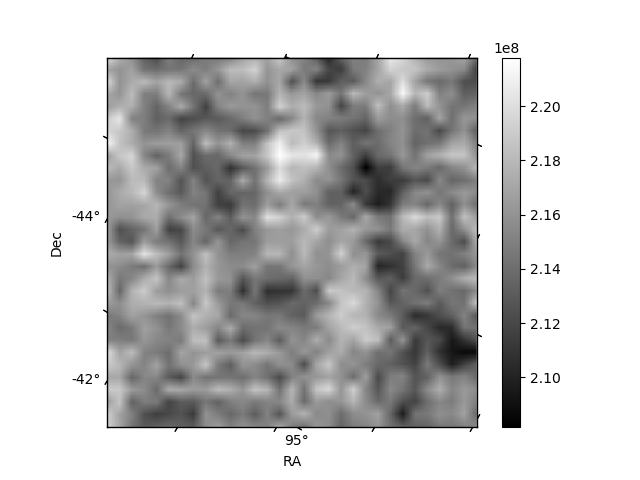
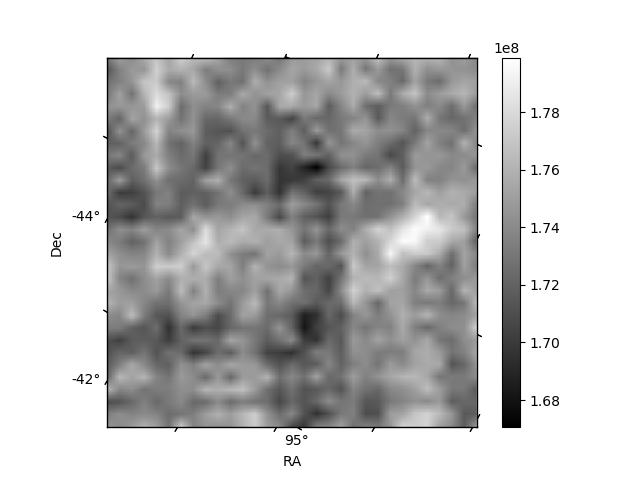
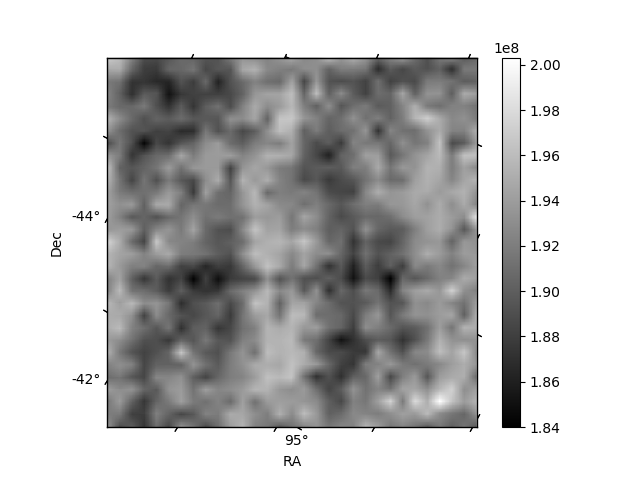
Histogram calculated using DETX and DETY for each event in the final _common_clean file
| Quadrant A | 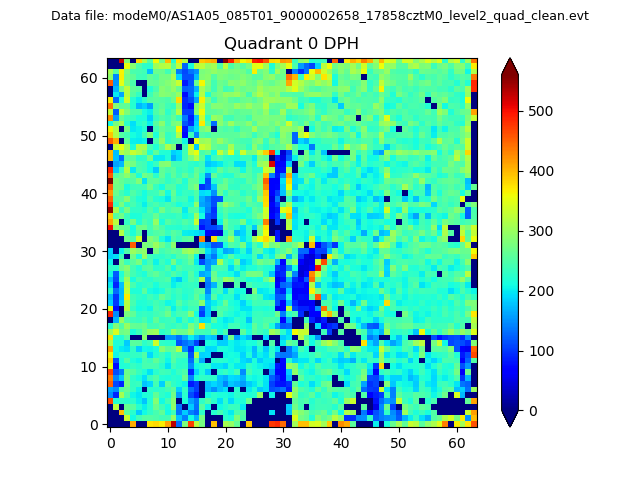 |
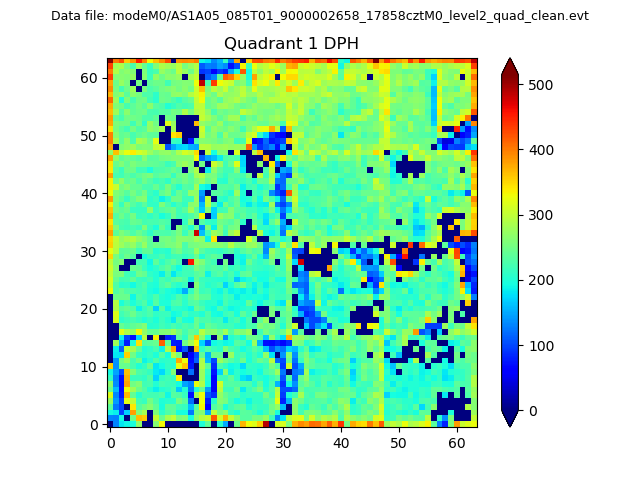 |
Quadrant B |
|---|---|---|---|
| Quadrant D | 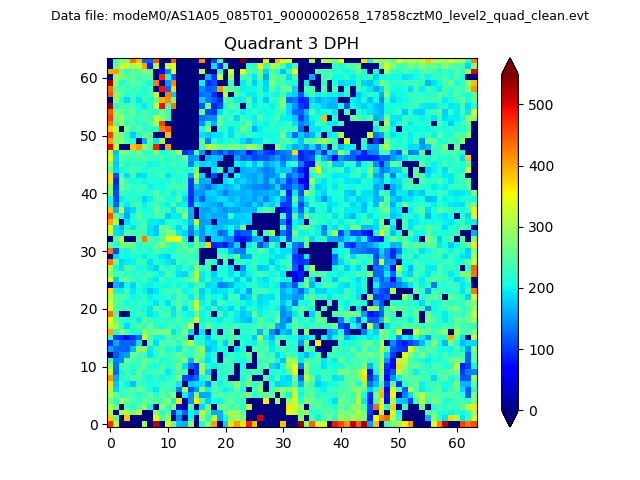 |
 |
Quadrant C |
| Plot type | Count rate plots | Images |
|---|---|---|
| Comparison with Poisson distribution Blue bars denote a histogram of data divided into 1 sec bins. Red curve is a Poisson curve with rate = median count rate of data. |
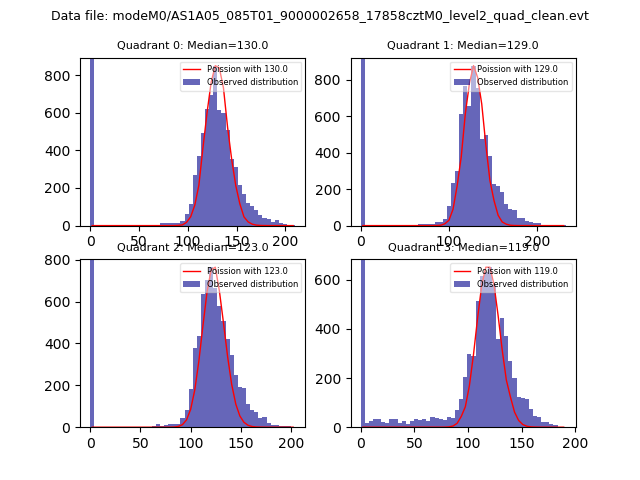 |
 |
| Quadrant-wise count rates Data is divided into 100 sec bins |
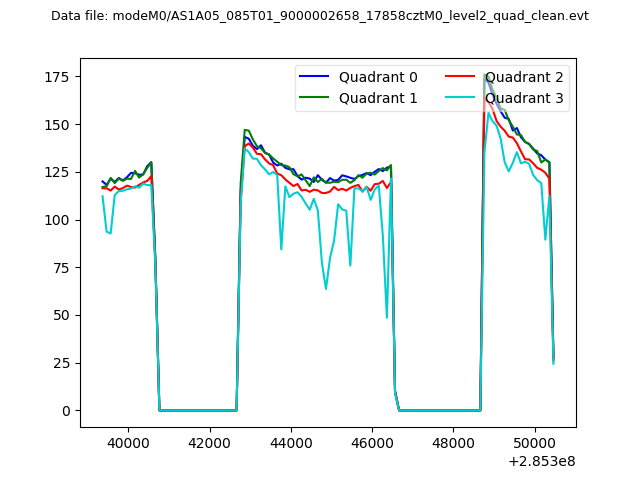 |
|
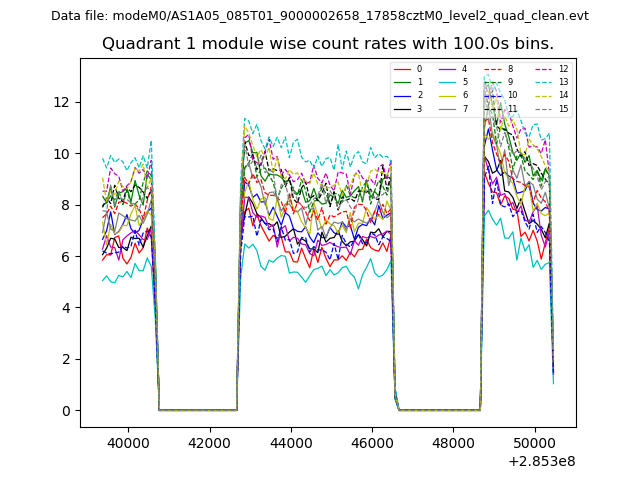
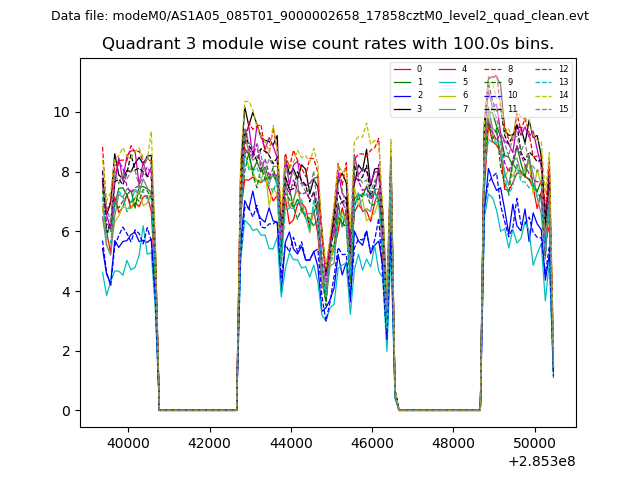
| Module-wise count rates for Quadrant A Data is divided into 100 sec bins |
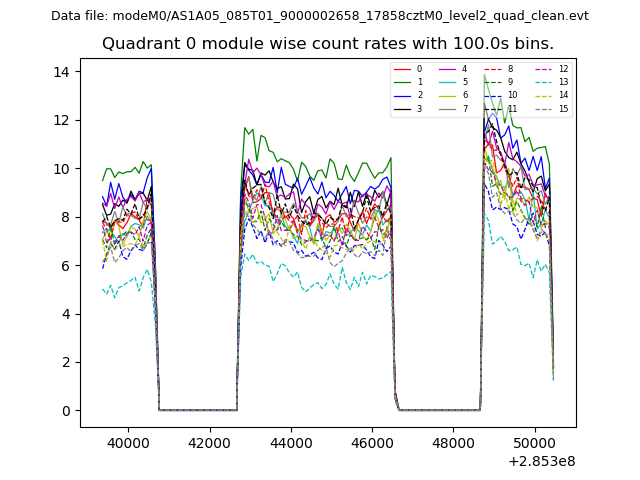 |
 |
| Module-wise count rates for Quadrant B Data is divided into 100 sec bins |
 |
 |
| Module-wise count rates for Quadrant C Data is divided into 100 sec bins |
 |
 |
| Module-wise count rates for Quadrant D Data is divided into 100 sec bins |
 |
 |
| Parameter | Plot |
|---|---|
| CZT HV Monitor |  |
| D_VDD | 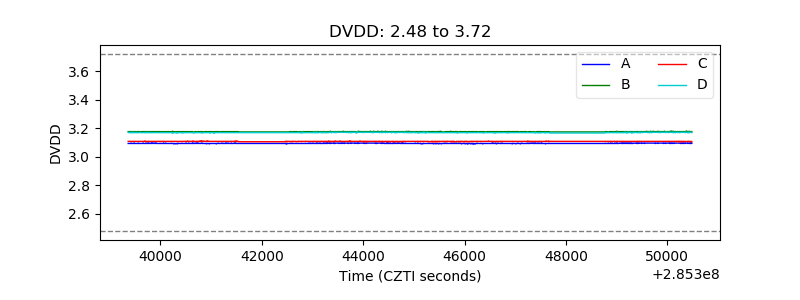 |
| Temperature 1 | 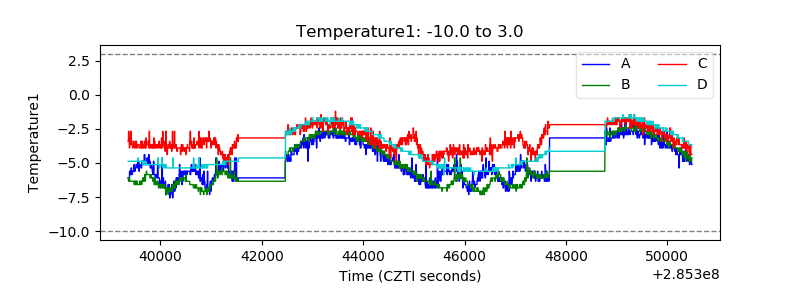 |
| Veto HV Monitor | 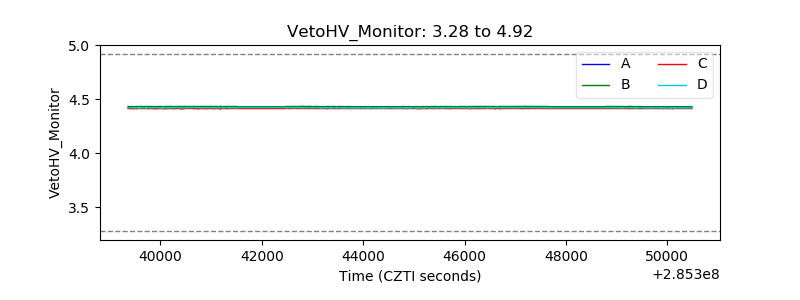 |
| Veto LLD | 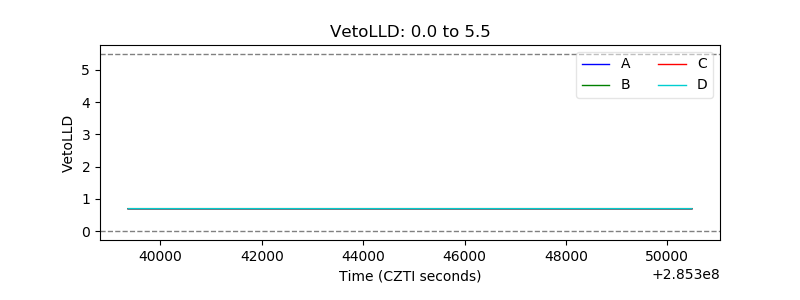 |
| Alpha Counter | 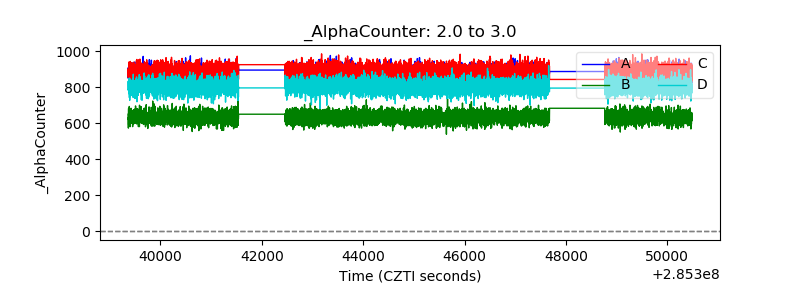 |
| _CPM_Rate | 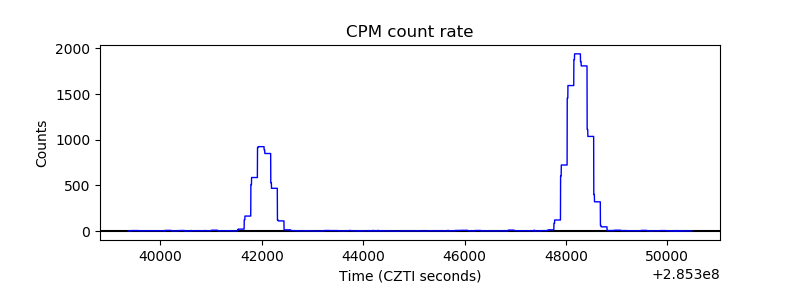 |
| CZT Counter | 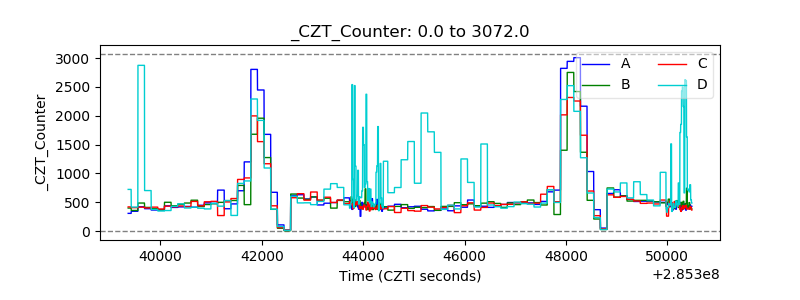 |
| +2.5 Volts monitor |  |
| +5 Volts monitor |  |
| _ROLL_ROT | 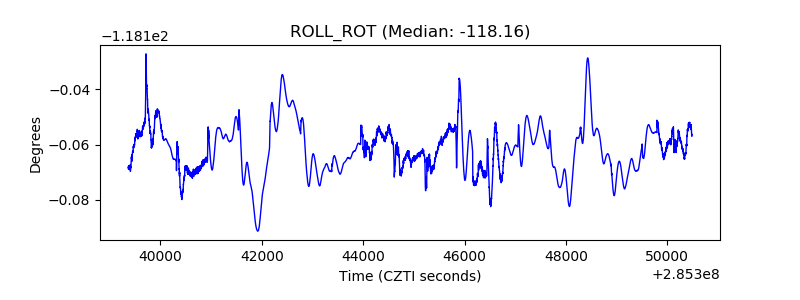 |
| _Roll_DEC | 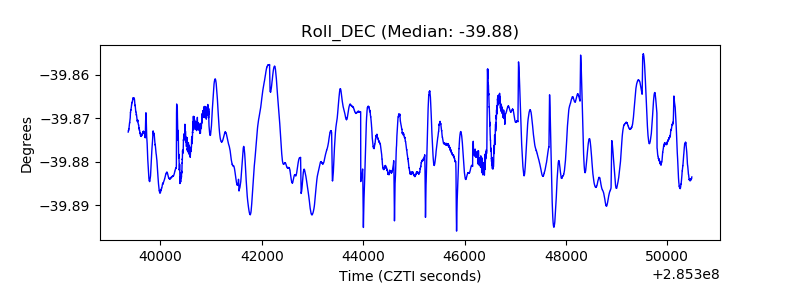 |
| _Roll_RA |  |
| Veto Counter | 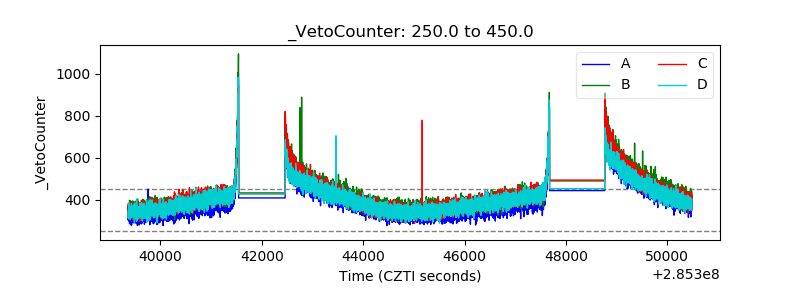 |