| Param | Original file | Final file |
|---|---|---|
| Filename | modeM0/AS1A05_085T01_9000002658_17859cztM0_level2.evt | modeM0/AS1A05_085T01_9000002658_17859cztM0_level2_quad_clean.evt |
| Size (bytes) | 455,941,440 | 100,846,080 |
| Size | 434.8 MB | 96.2 MB |
| Events in quadrant A | 3,038,392 | 678,909 |
| Events in quadrant B | 3,177,054 | 685,754 |
| Events in quadrant C | 3,000,126 | 644,490 |
| Events in quadrant D | 4,167,274 | 608,060 |
| Mode SS | |||
|---|---|---|---|
| Quadrant | BADHDUFLAG | Total packets | Discarded packets |
| A | 0 | 128 | 0 |
| B | 0 | 128 | 0 |
| C | 0 | 128 | 0 |
| D | 0 | 128 | 0 |
| Mode M9 | |||
|---|---|---|---|
| Quadrant | BADHDUFLAG | Total packets | Discarded packets |
| A | 0 | 12 | 0 |
| B | 0 | 12 | 0 |
| C | 0 | 12 | 0 |
| D | 0 | 12 | 0 |
| Mode M0 | |||
|---|---|---|---|
| Quadrant | BADHDUFLAG | Total packets | Discarded packets |
| A | 0 | 13233 | 1 |
| B | 0 | 13498 | 1 |
| C | 0 | 13007 | 1 |
| D | 0 | 16839 | 1 |
| Quadrant | Total seconds | Saturated seconds | Saturation percentage |
|---|---|---|---|
| A | 6255 | 82 | 1.310951% |
| B | 6256 | 72 | 1.150895% |
| C | 6256 | 69 | 1.102941% |
| D | 6256 | 338 | 5.402813% |
Noise dominated data is calculated using 1-second bins in cleaned event files. If a bin has >2000 counts, and if more than 50% of those come from <1% of pixels, then it is considered to be noise-dominated and hence unusable.
| Quadrant | # 1 sec bins | Bins with >0 counts | Bins with >2000 counts | High rate bins dominated by noise | Noise dominated (total time) | Noise dominated (detector-on time) | Marked lightcurve |
|---|---|---|---|---|---|---|---|
| A | 7455 | 6255 | 27 | 27 | 0.36% | 0.43% | 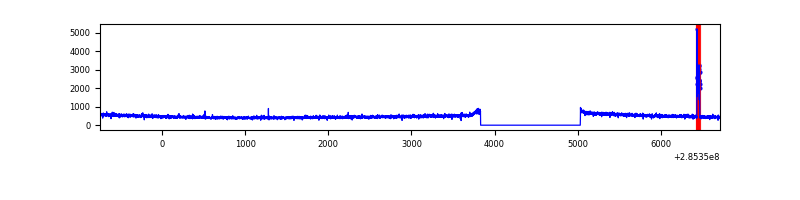 |
| B | 7456 | 6257 | 9 | 9 | 0.12% | 0.14% | 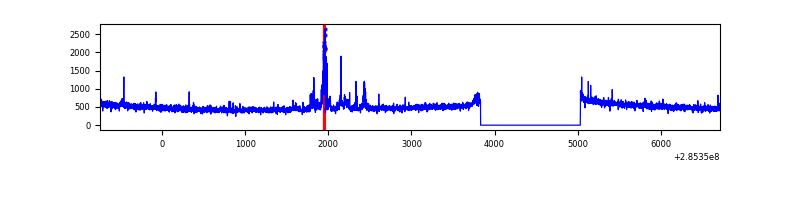 |
| C | 7456 | 6257 | 0 | 0 | 0.00% | 0.00% | 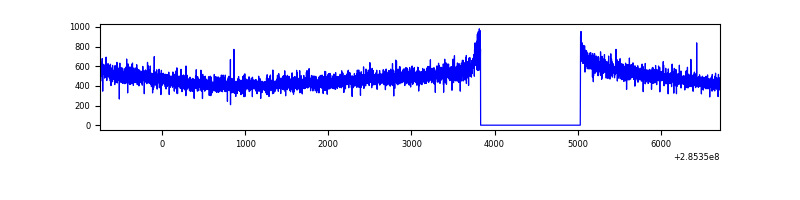 |
| D | 7456 | 6257 | 276 | 276 | 3.70% | 4.41% | 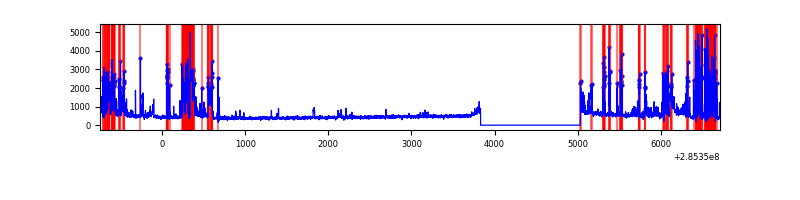 |
Top three noisy pixels from each quadrant. If the there are fewer than three noisy pixels in the level2.evt file, extra rows are filled as -1
| Pixel properties | Quadrant properties | ||||||
|---|---|---|---|---|---|---|---|
| Quadrant | DetID | PixID | Counts | Sigma | Mean | Median | Sigma |
| A | 15 | 174 | 73518 | 469.94 | 771 | 756 | 154.8 |
| A | 0 | 226 | 6848 | 39.34 | 771 | 756 | 154.8 |
| A | 3 | 137 | 5654 | 31.63 | 771 | 756 | 154.8 |
| B | 15 | 222 | 132924 | 903.0 | 774 | 757 | 146.4 |
| B | 12 | 111 | 17207 | 112.39 | 774 | 757 | 146.4 |
| B | 11 | 111 | 14675 | 95.09 | 774 | 757 | 146.4 |
| C | 14 | 238 | 115334 | 677.96 | 728 | 736 | 169.0 |
| C | 3 | 233 | 41087 | 238.72 | 728 | 736 | 169.0 |
| C | 13 | 61 | 5141 | 26.06 | 728 | 736 | 169.0 |
| D | 7 | 238 | 1118758 | 6357.02 | 721 | 699 | 175.9 |
| D | 1 | 52 | 208539 | 1181.73 | 721 | 699 | 175.9 |
| D | 13 | 232 | 98136 | 554.0 | 721 | 699 | 175.9 |
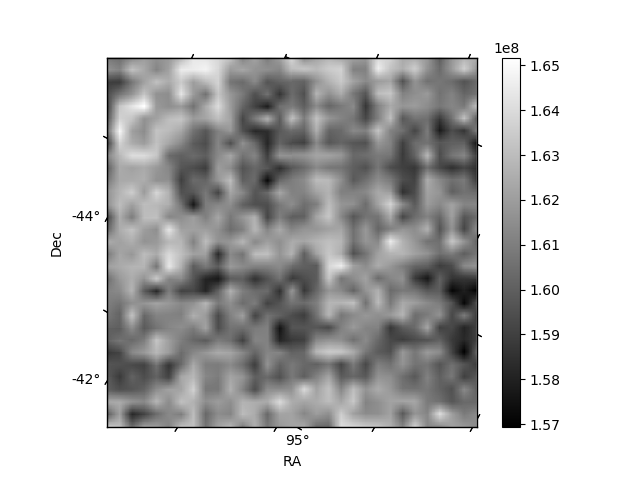
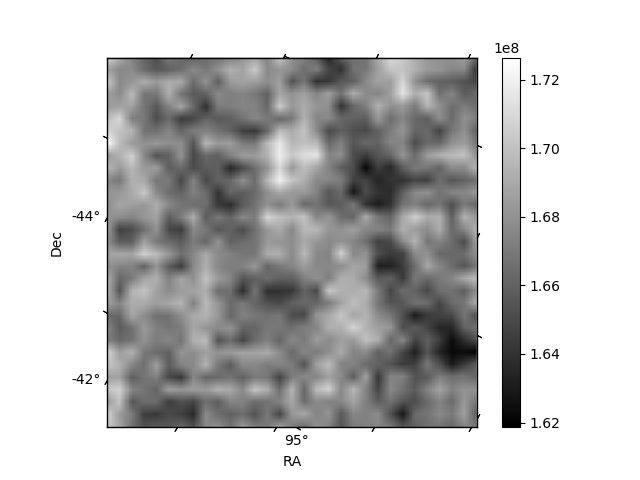
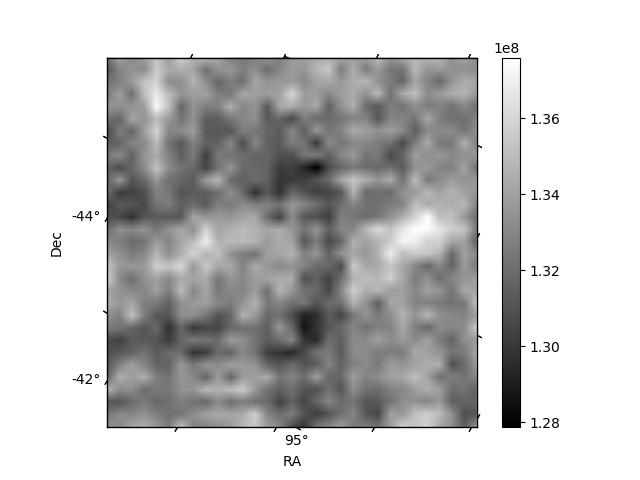
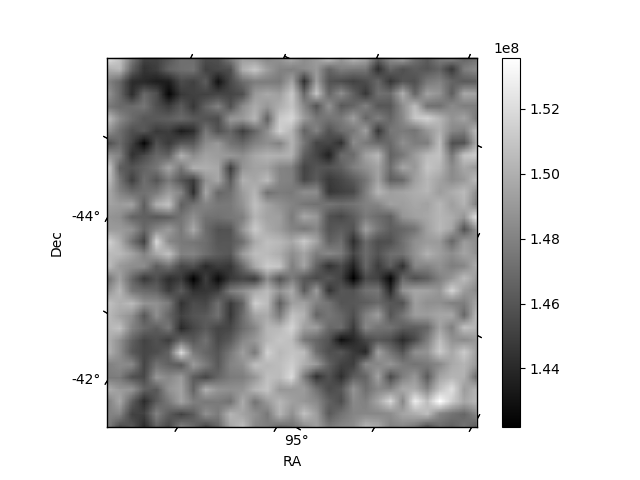
Histogram calculated using DETX and DETY for each event in the final _common_clean file
| Quadrant A | 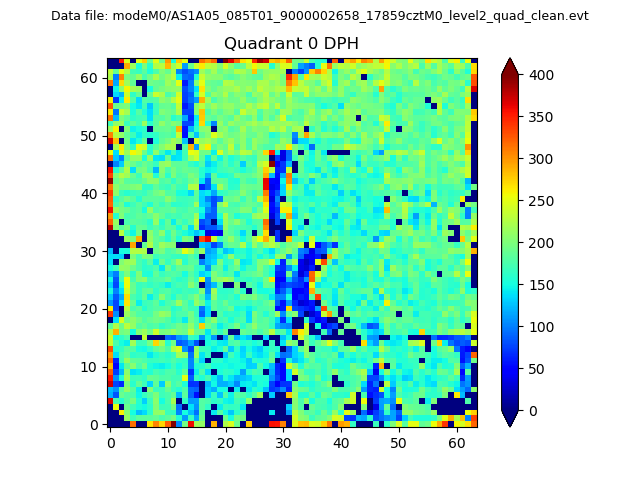 |
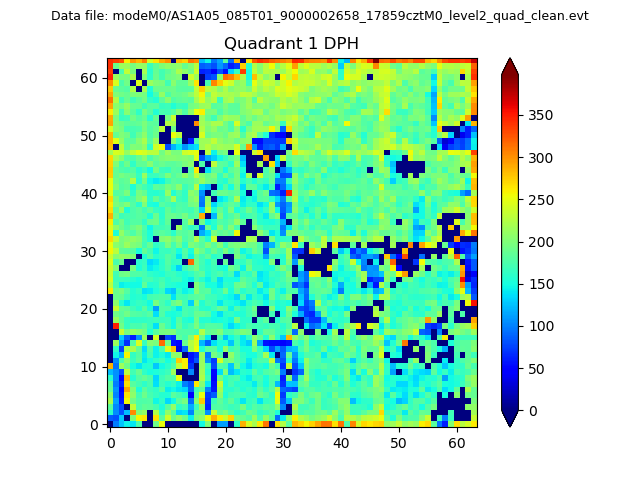 |
Quadrant B |
|---|---|---|---|
| Quadrant D |  |
 |
Quadrant C |
| Plot type | Count rate plots | Images |
|---|---|---|
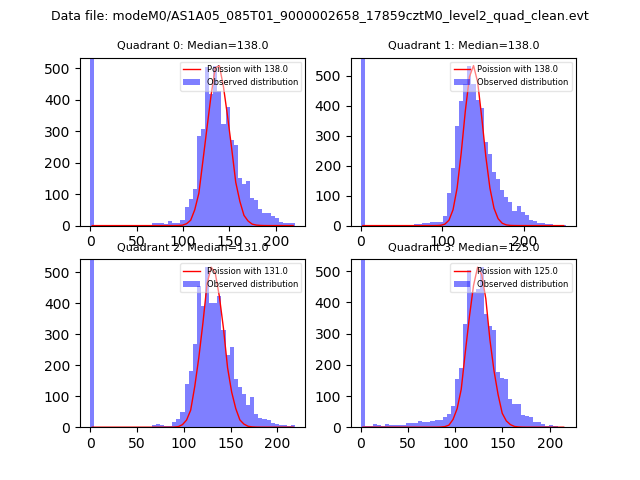
| Comparison with Poisson distribution Blue bars denote a histogram of data divided into 1 sec bins. Red curve is a Poisson curve with rate = median count rate of data. |
 |
 |
| Quadrant-wise count rates Data is divided into 100 sec bins |
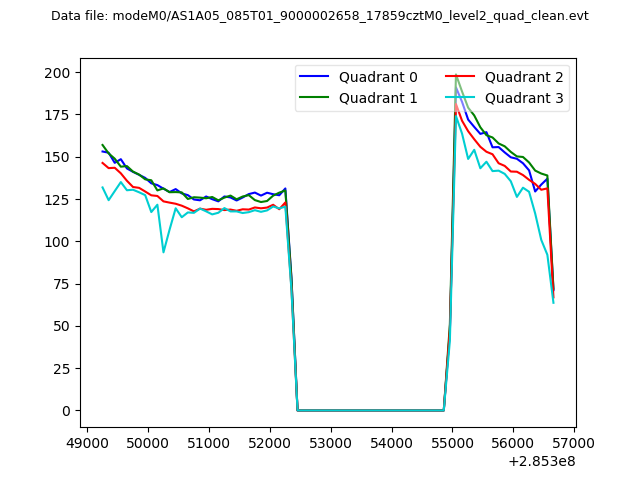 |
|
| Module-wise count rates for Quadrant A Data is divided into 100 sec bins |
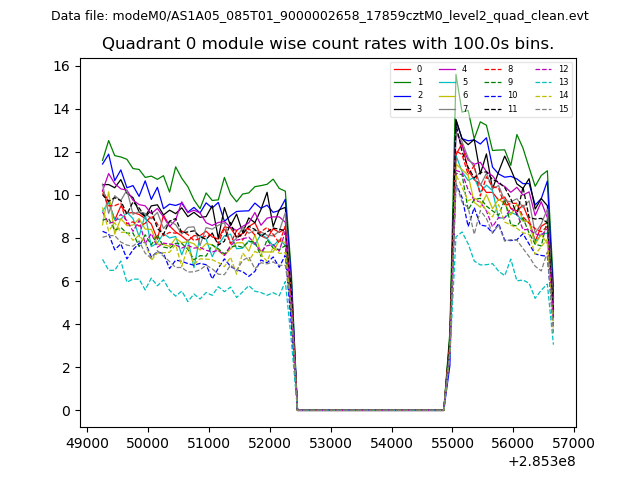 |
 |
| Module-wise count rates for Quadrant B Data is divided into 100 sec bins |
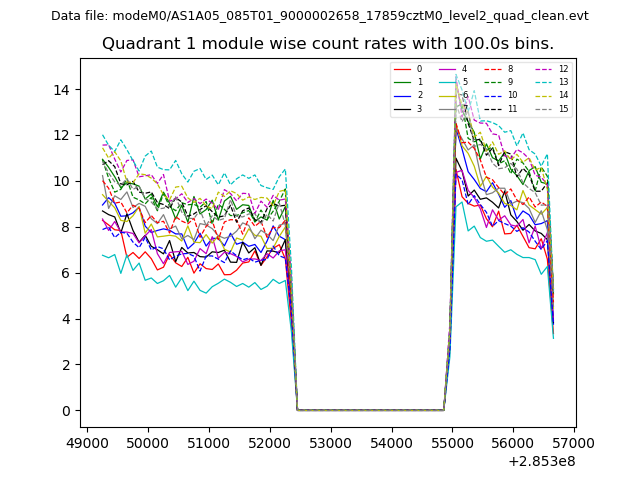 |
 |
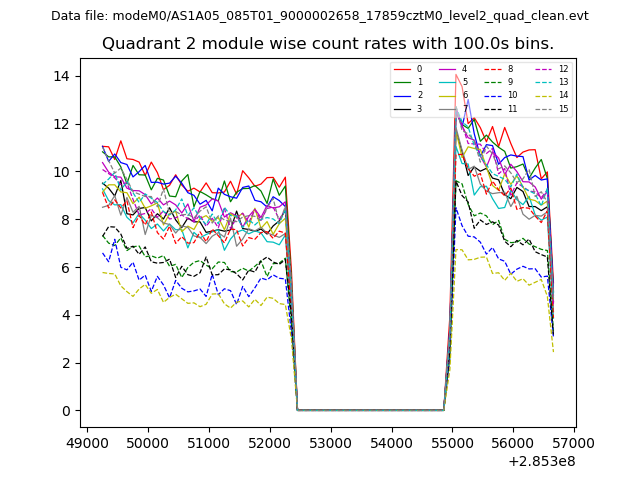
| Module-wise count rates for Quadrant C Data is divided into 100 sec bins |
 |
 |
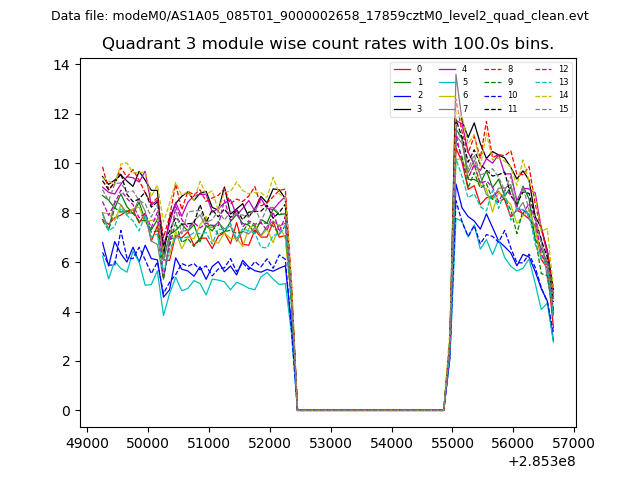
| Module-wise count rates for Quadrant D Data is divided into 100 sec bins |
 |
 |
| Parameter | Plot |
|---|---|
| CZT HV Monitor | 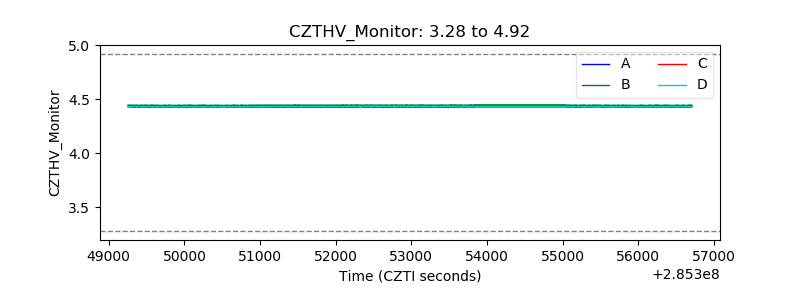 |
| D_VDD | 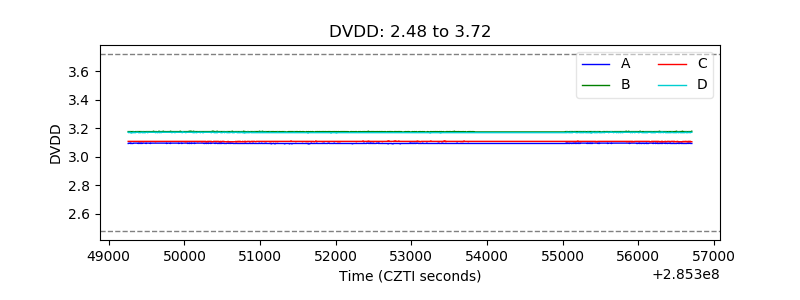 |
| Temperature 1 | 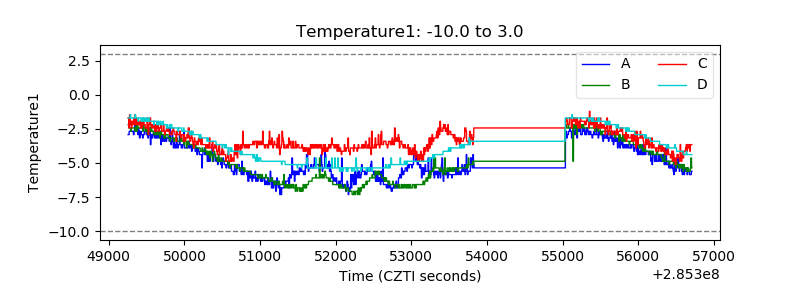 |
| Veto HV Monitor |  |
| Veto LLD | 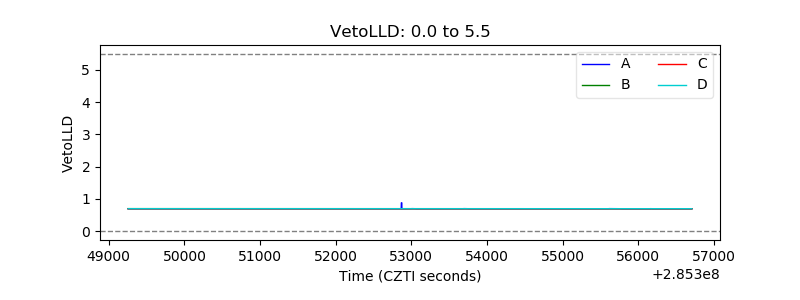 |
| Alpha Counter | 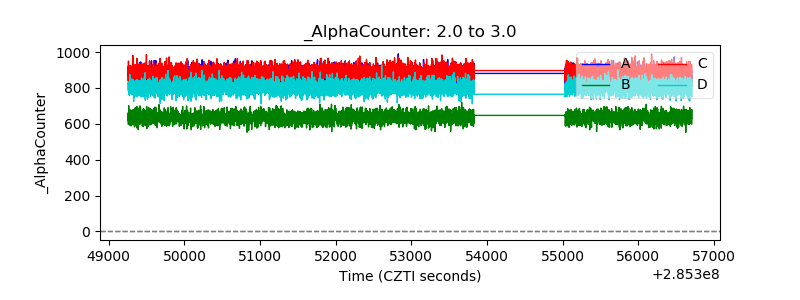 |
| _CPM_Rate | 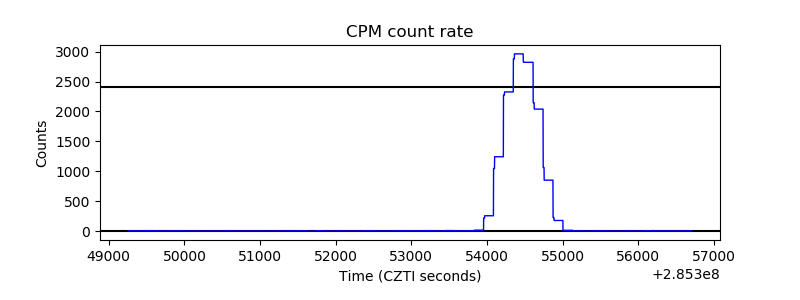 |
| CZT Counter | 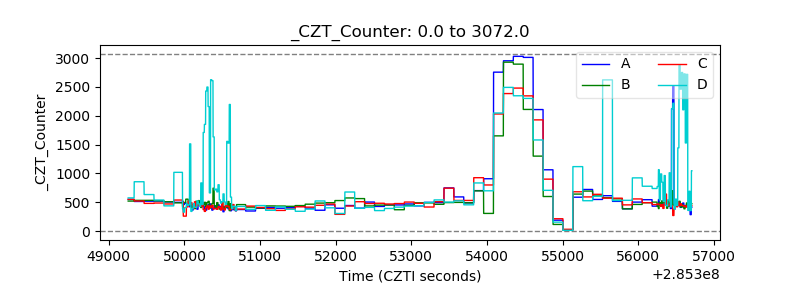 |
| +2.5 Volts monitor |  |
| +5 Volts monitor |  |
| _ROLL_ROT | 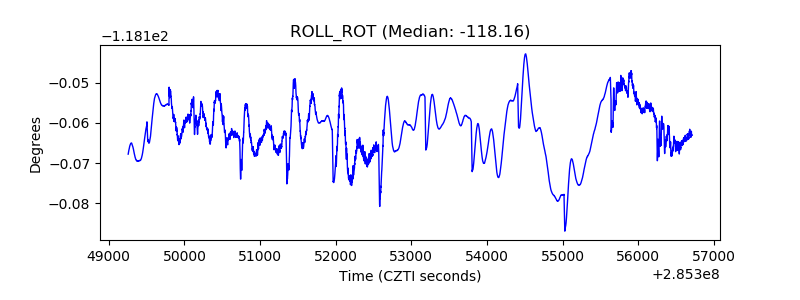 |
| _Roll_DEC | 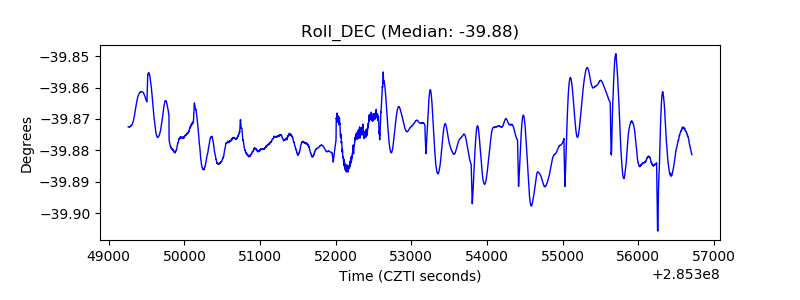 |
| _Roll_RA | 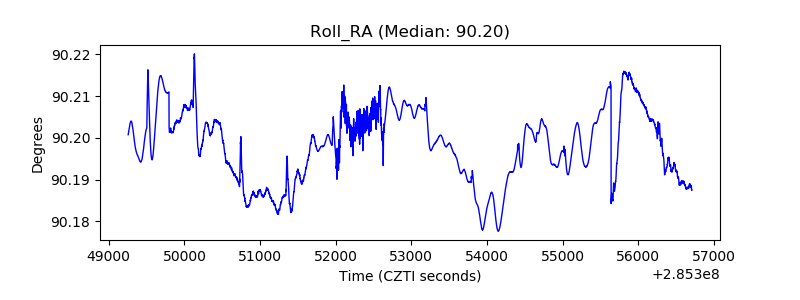 |
| Veto Counter | 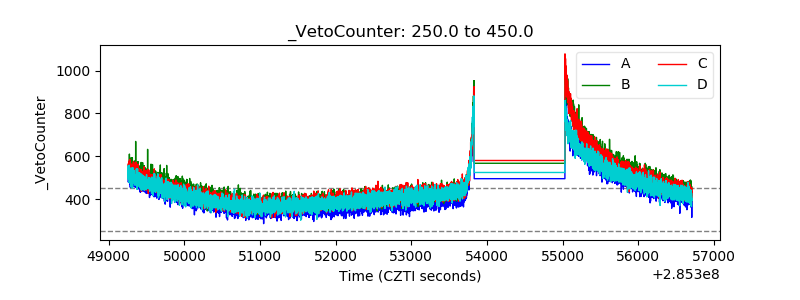 |