| Param | Original file | Final file |
|---|---|---|
| Filename | modeM0/AS1A05_085T01_9000002658_17860cztM0_level2.evt | modeM0/AS1A05_085T01_9000002658_17860cztM0_level2_quad_clean.evt |
| Size (bytes) | 462,902,400 | 104,123,520 |
| Size | 441.5 MB | 99.3 MB |
| Events in quadrant A | 3,211,761 | 698,107 |
| Events in quadrant B | 3,241,200 | 715,420 |
| Events in quadrant C | 3,198,799 | 665,257 |
| Events in quadrant D | 3,935,296 | 630,724 |
| Mode SS | |||
|---|---|---|---|
| Quadrant | BADHDUFLAG | Total packets | Discarded packets |
| A | 0 | 130 | 0 |
| B | 0 | 130 | 0 |
| C | 0 | 130 | 0 |
| D | 0 | 130 | 0 |
| Mode M9 | |||
|---|---|---|---|
| Quadrant | BADHDUFLAG | Total packets | Discarded packets |
| A | 0 | 13 | 0 |
| B | 0 | 13 | 0 |
| C | 0 | 13 | 0 |
| D | 0 | 13 | 0 |
| Mode M0 | |||
|---|---|---|---|
| Quadrant | BADHDUFLAG | Total packets | Discarded packets |
| A | 0 | 13729 | 2 |
| B | 0 | 13674 | 2 |
| C | 0 | 13495 | 2 |
| D | 0 | 16001 | 2 |
| Quadrant | Total seconds | Saturated seconds | Saturation percentage |
|---|---|---|---|
| A | 6357 | 57 | 0.896649% |
| B | 6358 | 39 | 0.613400% |
| C | 6358 | 44 | 0.692042% |
| D | 6358 | 212 | 3.334382% |
Noise dominated data is calculated using 1-second bins in cleaned event files. If a bin has >2000 counts, and if more than 50% of those come from <1% of pixels, then it is considered to be noise-dominated and hence unusable.
| Quadrant | # 1 sec bins | Bins with >0 counts | Bins with >2000 counts | High rate bins dominated by noise | Noise dominated (total time) | Noise dominated (detector-on time) | Marked lightcurve |
|---|---|---|---|---|---|---|---|
| A | 7672 | 6358 | 27 | 27 | 0.35% | 0.42% | 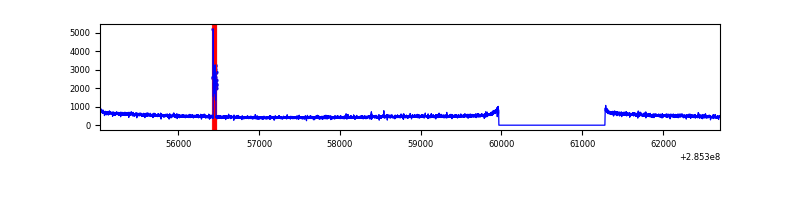 |
| B | 7673 | 6359 | 1 | 1 | 0.01% | 0.02% | 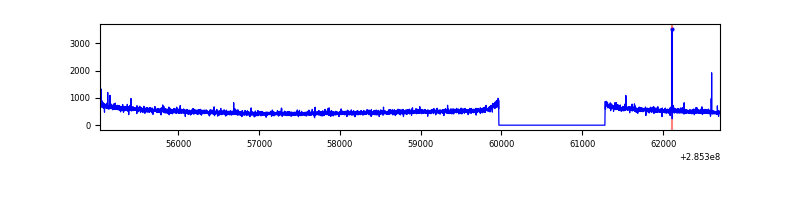 |
| C | 7673 | 6359 | 0 | 0 | 0.00% | 0.00% | 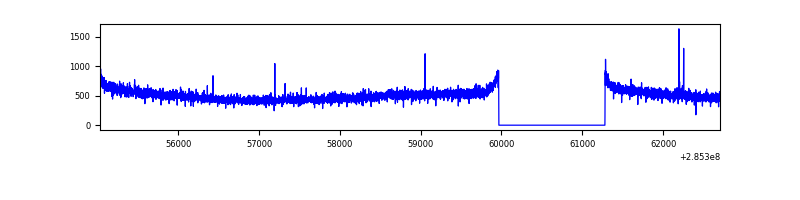 |
| D | 7673 | 6359 | 175 | 175 | 2.28% | 2.75% | 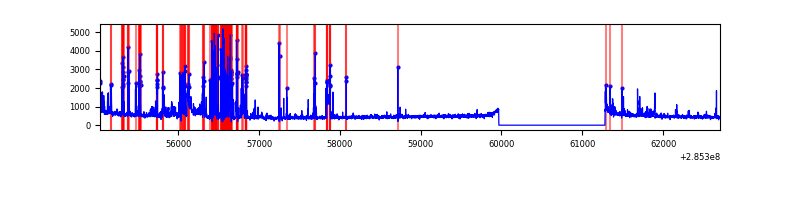 |
Top three noisy pixels from each quadrant. If the there are fewer than three noisy pixels in the level2.evt file, extra rows are filled as -1
| Pixel properties | Quadrant properties | ||||||
|---|---|---|---|---|---|---|---|
| Quadrant | DetID | PixID | Counts | Sigma | Mean | Median | Sigma |
| A | 15 | 174 | 73566 | 445.78 | 816 | 802 | 163.2 |
| A | 0 | 226 | 7359 | 40.17 | 816 | 802 | 163.2 |
| A | 3 | 137 | 6028 | 32.01 | 816 | 802 | 163.2 |
| B | 12 | 111 | 18014 | 111.71 | 823 | 806 | 154.0 |
| B | 11 | 111 | 15239 | 93.69 | 823 | 806 | 154.0 |
| B | 14 | 111 | 13243 | 80.74 | 823 | 806 | 154.0 |
| C | 14 | 238 | 120986 | 671.08 | 774 | 780 | 179.1 |
| C | 3 | 233 | 41884 | 229.47 | 774 | 780 | 179.1 |
| C | 9 | 160 | 7773 | 39.04 | 774 | 780 | 179.1 |
| D | 7 | 238 | 641707 | 3463.25 | 766 | 743 | 185.1 |
| D | 1 | 52 | 282289 | 1521.25 | 766 | 743 | 185.1 |
| D | 13 | 232 | 105109 | 563.91 | 766 | 743 | 185.1 |
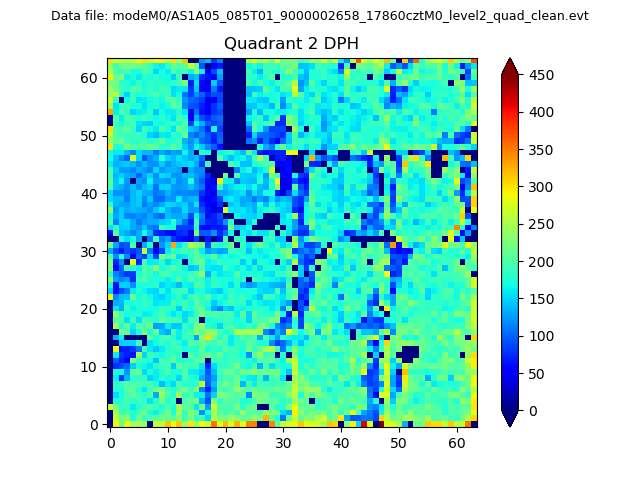
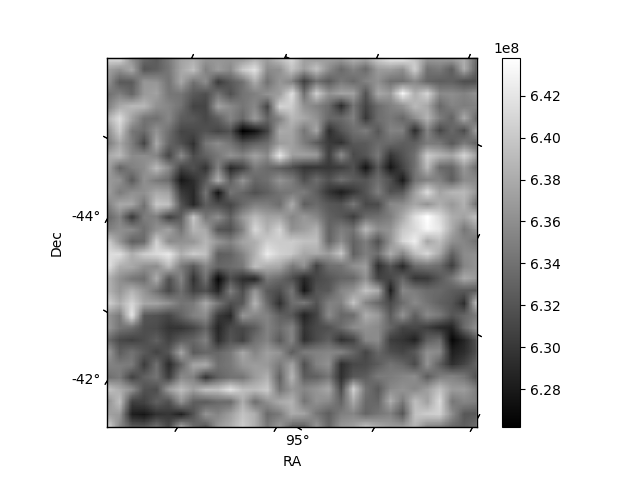
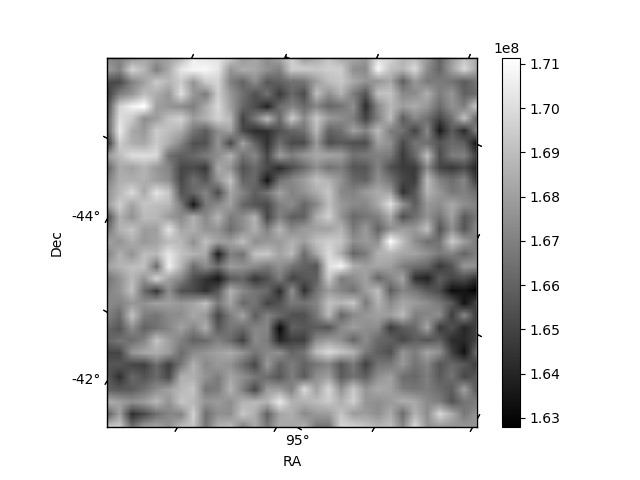
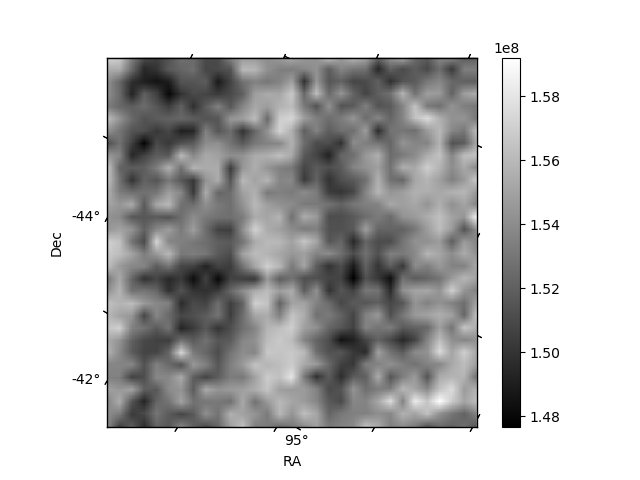
Histogram calculated using DETX and DETY for each event in the final _common_clean file
| Quadrant A | 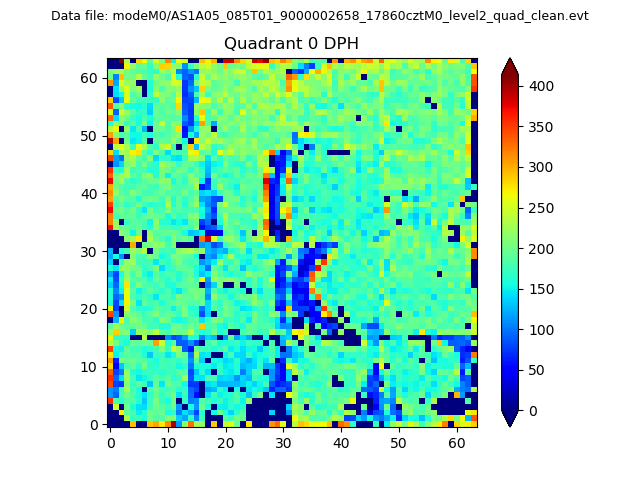 |
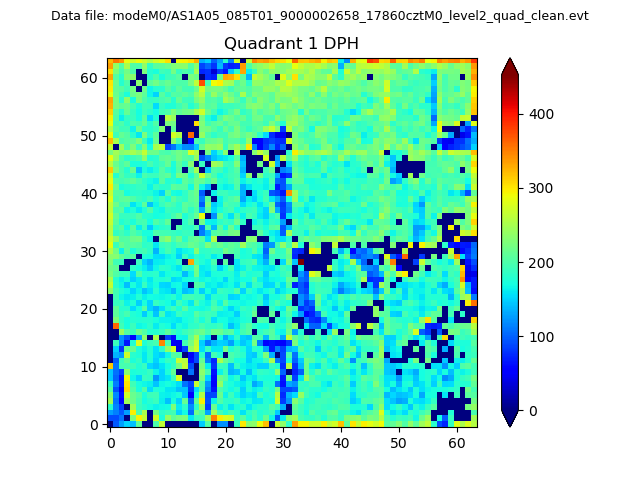 |
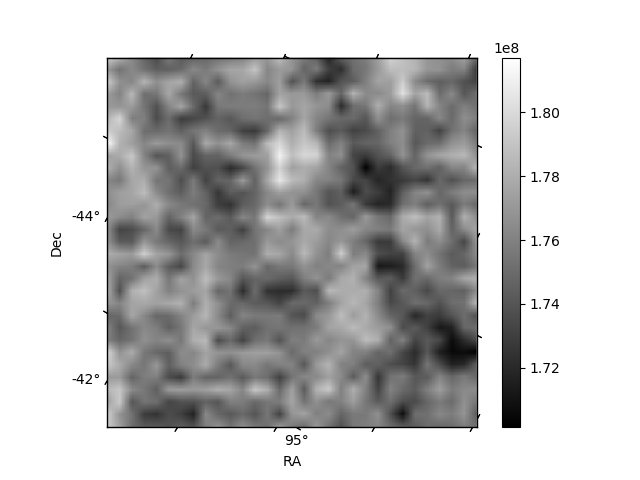
Quadrant B |
|---|---|---|---|
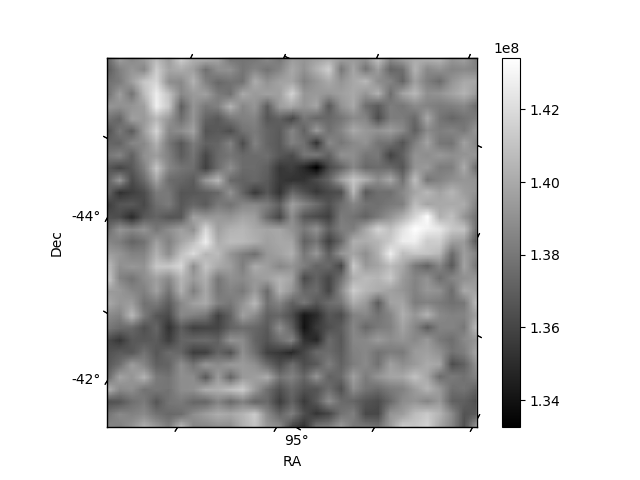
| Quadrant D | 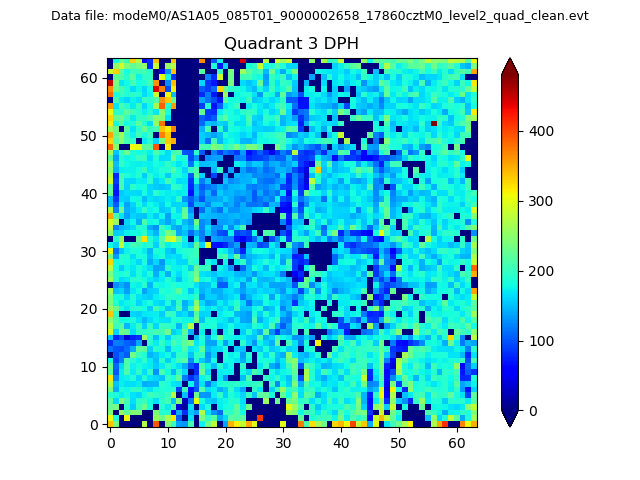 |
 |
Quadrant C |
| Plot type | Count rate plots | Images |
|---|---|---|
| Comparison with Poisson distribution Blue bars denote a histogram of data divided into 1 sec bins. Red curve is a Poisson curve with rate = median count rate of data. |
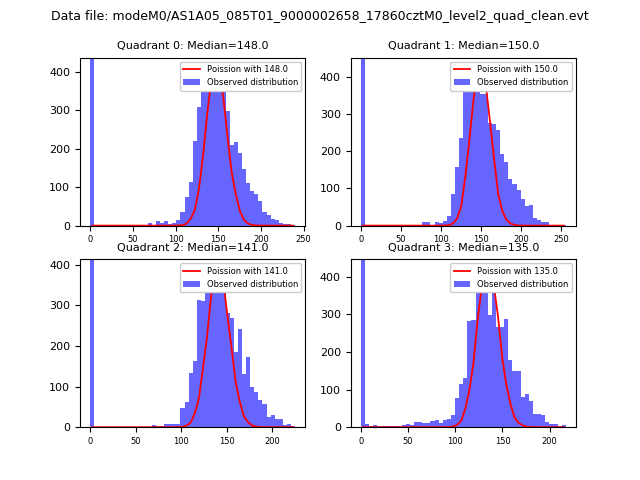 |
 |
| Quadrant-wise count rates Data is divided into 100 sec bins |
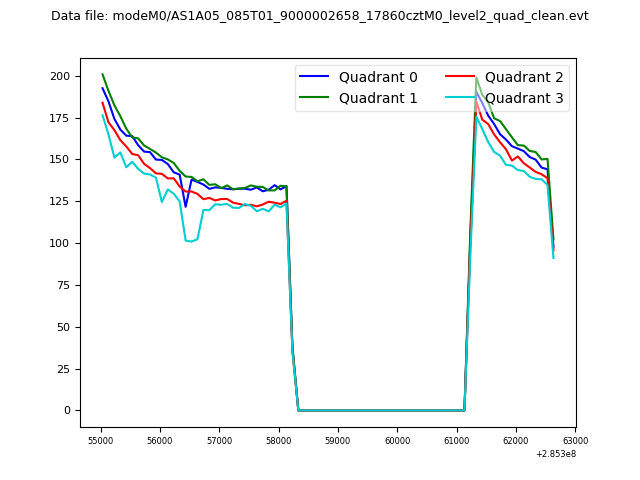 |
|
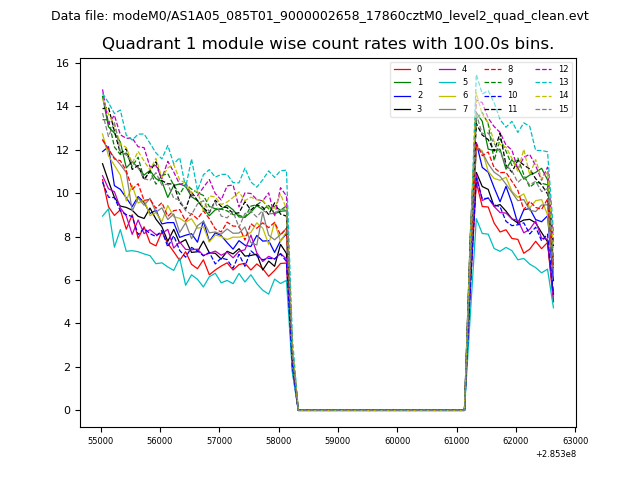
| Module-wise count rates for Quadrant A Data is divided into 100 sec bins |
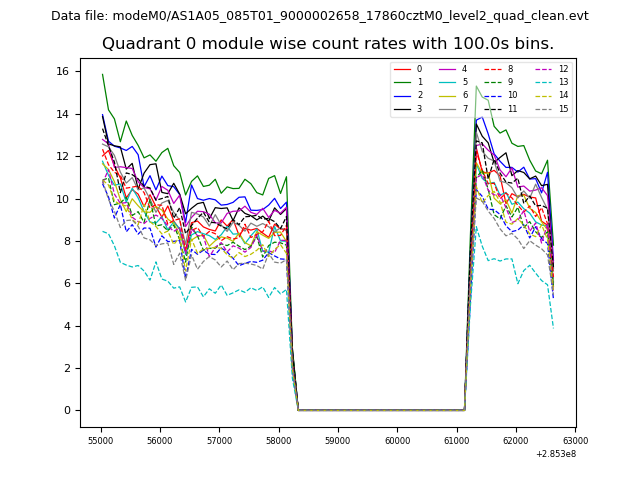 |
 |
| Module-wise count rates for Quadrant B Data is divided into 100 sec bins |
 |
 |
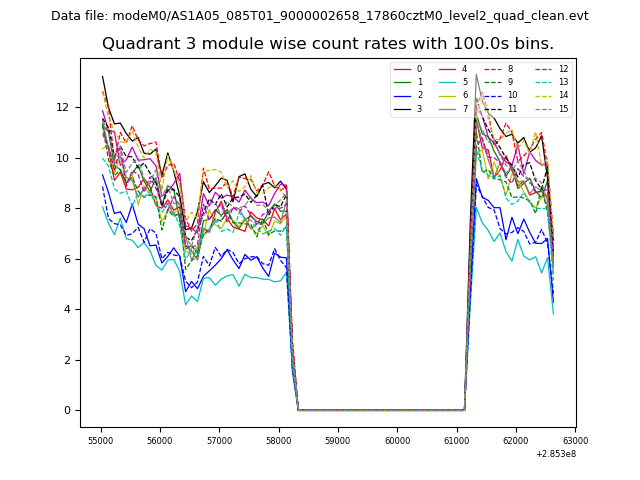
| Module-wise count rates for Quadrant C Data is divided into 100 sec bins |
 |
 |
| Module-wise count rates for Quadrant D Data is divided into 100 sec bins |
 |
 |
| Parameter | Plot |
|---|---|
| CZT HV Monitor | 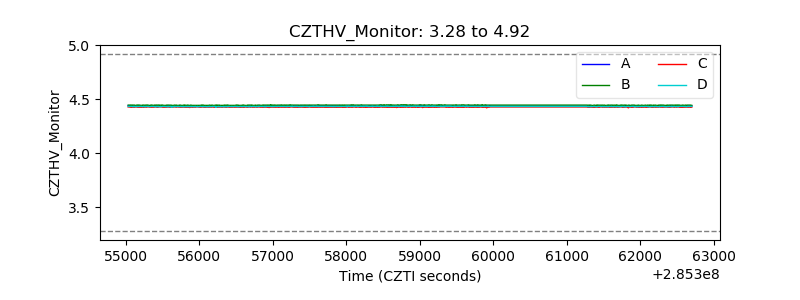 |
| D_VDD |  |
| Temperature 1 | 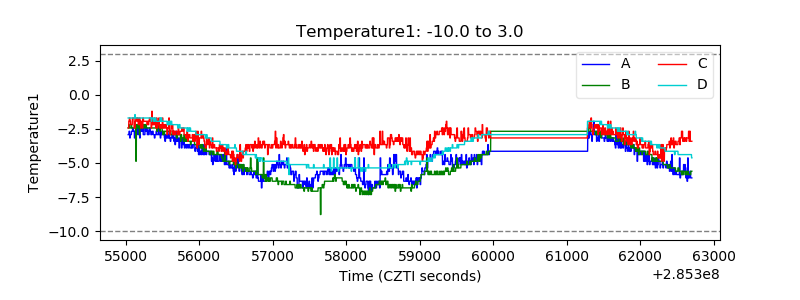 |
| Veto HV Monitor | 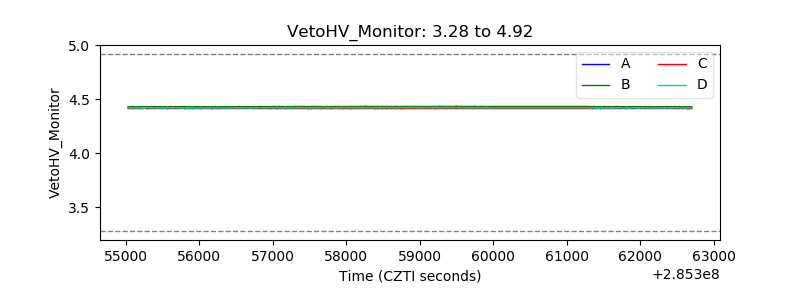 |
| Veto LLD | 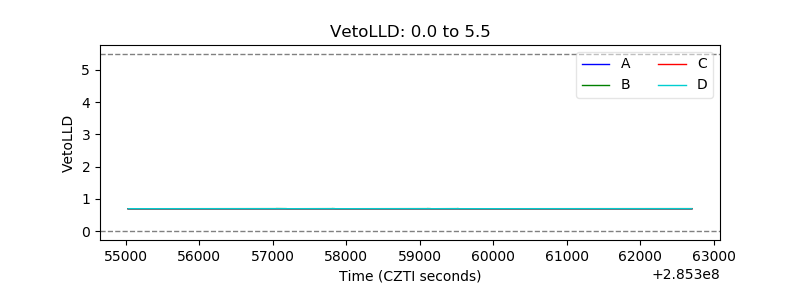 |
| Alpha Counter | 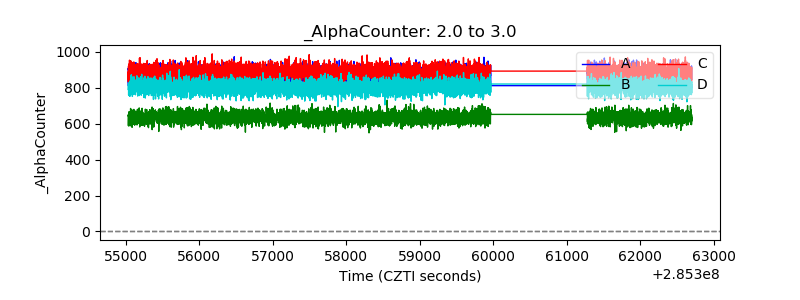 |
| _CPM_Rate | 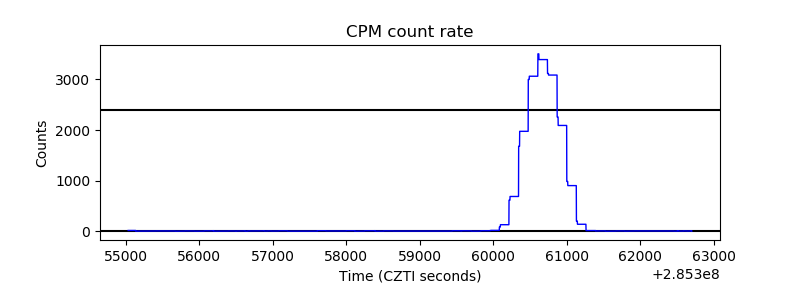 |
| CZT Counter | 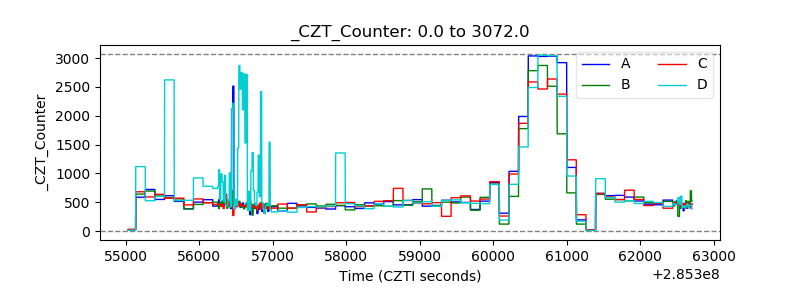 |
| +2.5 Volts monitor |  |
| +5 Volts monitor |  |
| _ROLL_ROT | 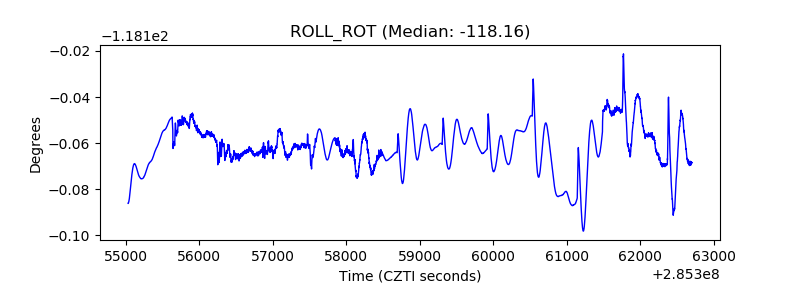 |
| _Roll_DEC | 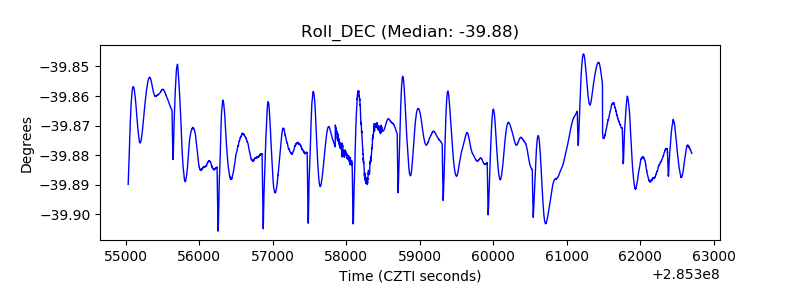 |
| _Roll_RA | 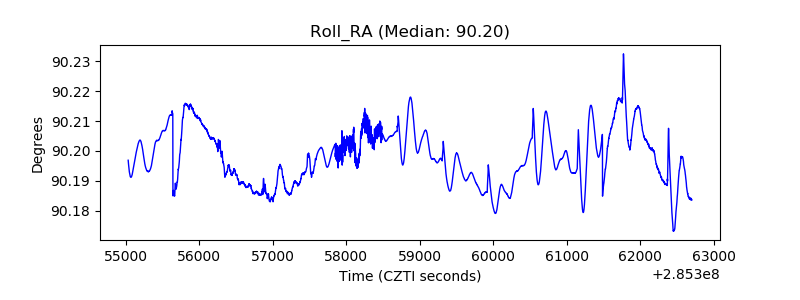 |
| Veto Counter | 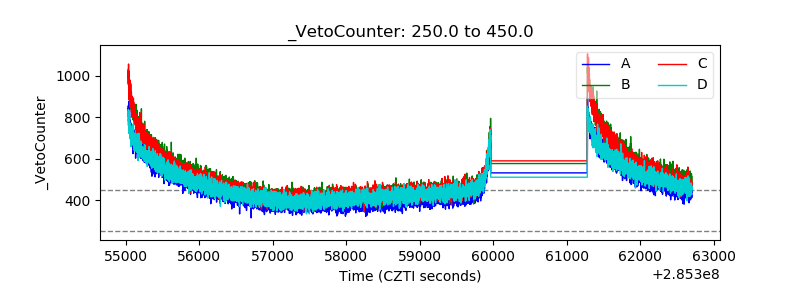 |