| Param | Original file | Final file |
|---|---|---|
| Filename | modeM0/AS1A05_085T01_9000002658_17861cztM0_level2.evt | modeM0/AS1A05_085T01_9000002658_17861cztM0_level2_quad_clean.evt |
| Size (bytes) | 448,827,840 | 94,371,840 |
| Size | 428.0 MB | 90.0 MB |
| Events in quadrant A | 3,060,876 | 627,505 |
| Events in quadrant B | 3,158,083 | 643,835 |
| Events in quadrant C | 3,145,412 | 602,904 |
| Events in quadrant D | 3,810,363 | 554,219 |
| Mode SS | |||
|---|---|---|---|
| Quadrant | BADHDUFLAG | Total packets | Discarded packets |
| A | 0 | 126 | 0 |
| B | 0 | 126 | 0 |
| C | 0 | 126 | 0 |
| D | 0 | 126 | 0 |
| Mode M9 | |||
|---|---|---|---|
| Quadrant | BADHDUFLAG | Total packets | Discarded packets |
| A | 0 | 19 | 0 |
| B | 0 | 20 | 0 |
| C | 0 | 20 | 0 |
| D | 0 | 20 | 0 |
| Mode M0 | |||
|---|---|---|---|
| Quadrant | BADHDUFLAG | Total packets | Discarded packets |
| A | 0 | 13049 | 2 |
| B | 0 | 13196 | 2 |
| C | 0 | 13073 | 2 |
| D | 0 | 15535 | 2 |
| Quadrant | Total seconds | Saturated seconds | Saturation percentage |
|---|---|---|---|
| A | 6147 | 33 | 0.536847% |
| B | 6147 | 63 | 1.024890% |
| C | 6147 | 64 | 1.041158% |
| D | 6147 | 305 | 4.961770% |
Noise dominated data is calculated using 1-second bins in cleaned event files. If a bin has >2000 counts, and if more than 50% of those come from <1% of pixels, then it is considered to be noise-dominated and hence unusable.
| Quadrant | # 1 sec bins | Bins with >0 counts | Bins with >2000 counts | High rate bins dominated by noise | Noise dominated (total time) | Noise dominated (detector-on time) | Marked lightcurve |
|---|---|---|---|---|---|---|---|
| A | 7507 | 6148 | 1 | 1 | 0.01% | 0.02% | 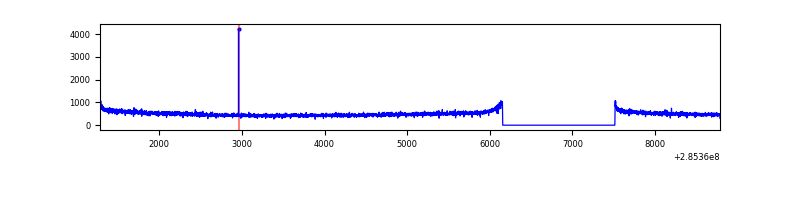 |
| B | 7507 | 6148 | 1 | 1 | 0.01% | 0.02% |  |
| C | 7507 | 6148 | 1 | 1 | 0.01% | 0.02% | 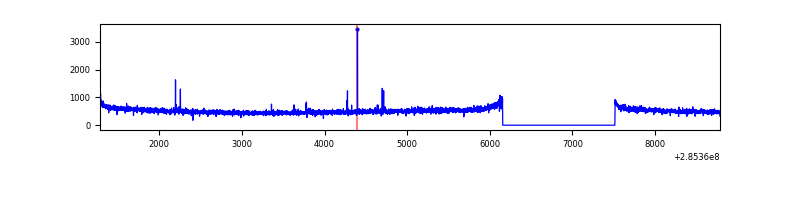 |
| D | 7507 | 6148 | 255 | 255 | 3.40% | 4.15% | 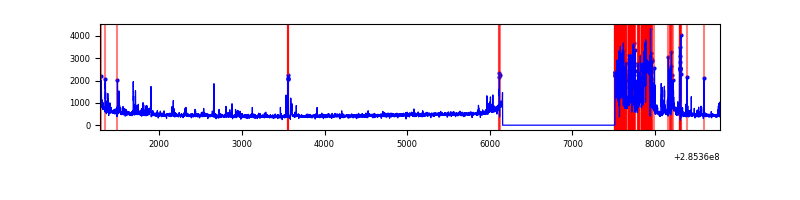 |
Top three noisy pixels from each quadrant. If the there are fewer than three noisy pixels in the level2.evt file, extra rows are filled as -1
| Pixel properties | Quadrant properties | ||||||
|---|---|---|---|---|---|---|---|
| Quadrant | DetID | PixID | Counts | Sigma | Mean | Median | Sigma |
| A | 0 | 226 | 7043 | 39.31 | 794 | 780 | 159.3 |
| A | 3 | 137 | 5861 | 31.89 | 794 | 780 | 159.3 |
| A | 12 | 194 | 5620 | 30.38 | 794 | 780 | 159.3 |
| B | 12 | 111 | 17484 | 110.49 | 803 | 785 | 151.1 |
| B | 11 | 111 | 14745 | 92.37 | 803 | 785 | 151.1 |
| B | 14 | 111 | 12986 | 80.73 | 803 | 785 | 151.1 |
| C | 14 | 238 | 121121 | 679.34 | 759 | 766 | 177.2 |
| C | 5 | 218 | 23824 | 130.15 | 759 | 766 | 177.2 |
| C | 3 | 233 | 15486 | 83.09 | 759 | 766 | 177.2 |
| D | 7 | 238 | 882585 | 4974.46 | 736 | 715 | 177.3 |
| D | 1 | 52 | 72039 | 402.32 | 736 | 715 | 177.3 |
| D | 2 | 14 | 67773 | 378.26 | 736 | 715 | 177.3 |
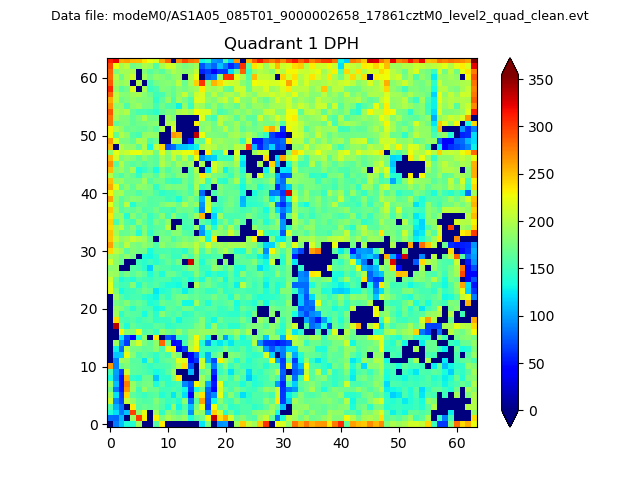
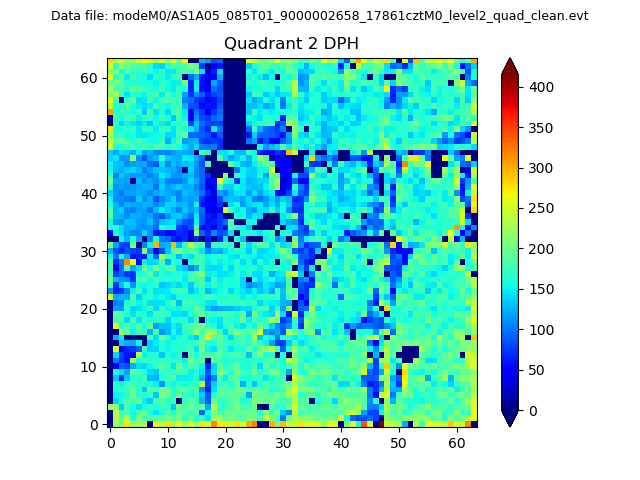
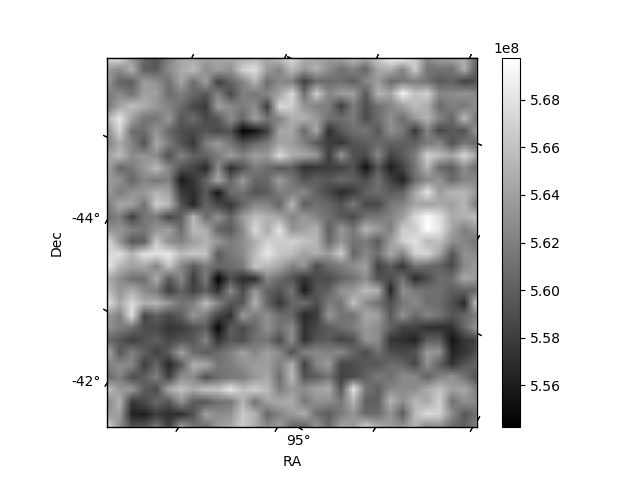
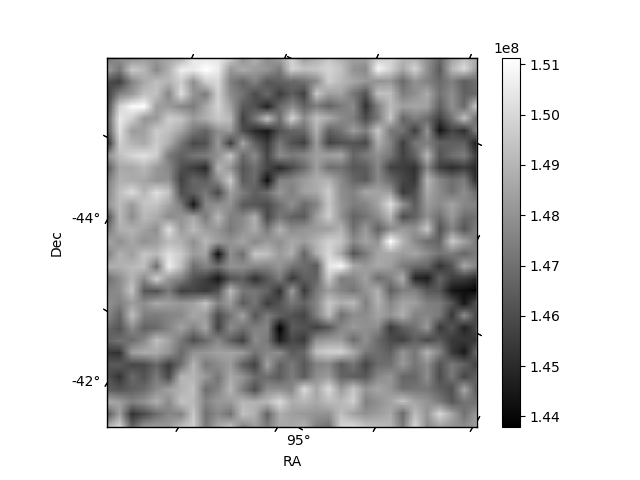
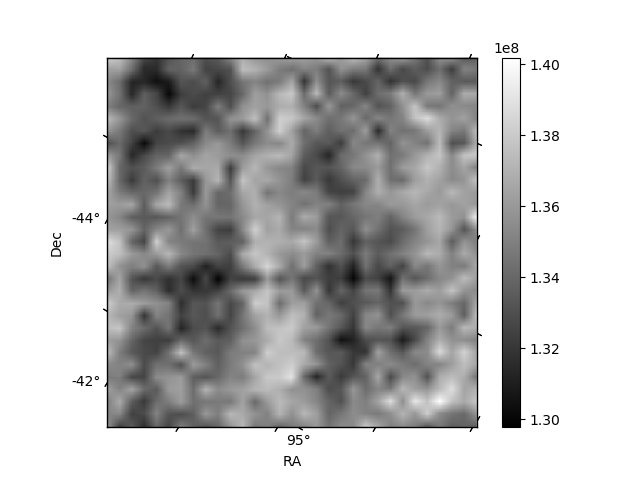
Histogram calculated using DETX and DETY for each event in the final _common_clean file
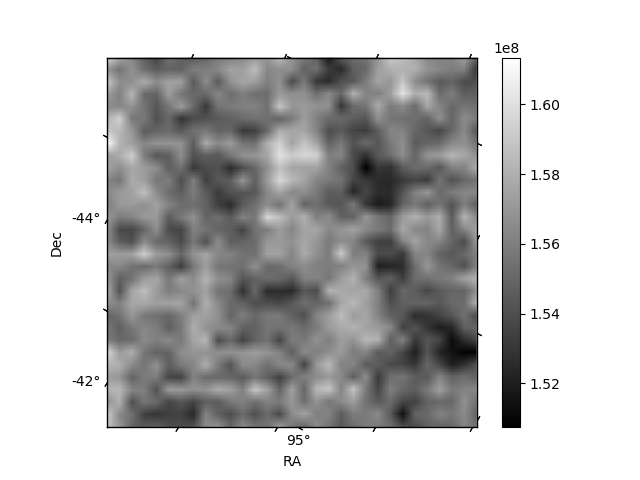
| Quadrant A | 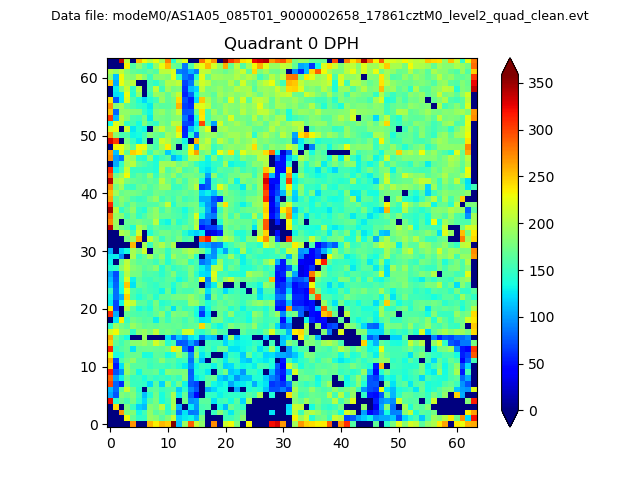 |
 |
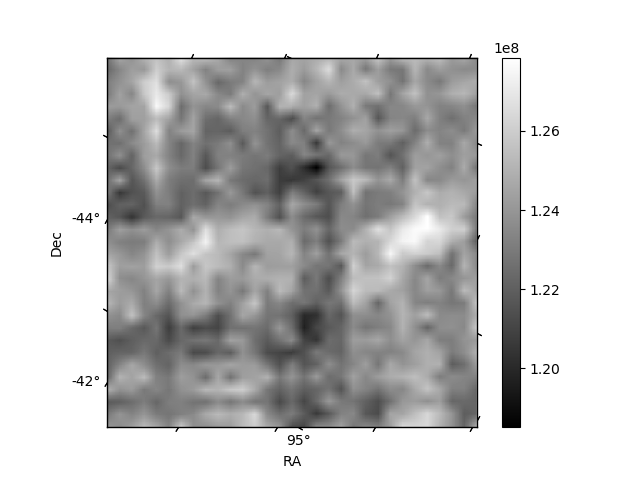
Quadrant B |
|---|---|---|---|
| Quadrant D | 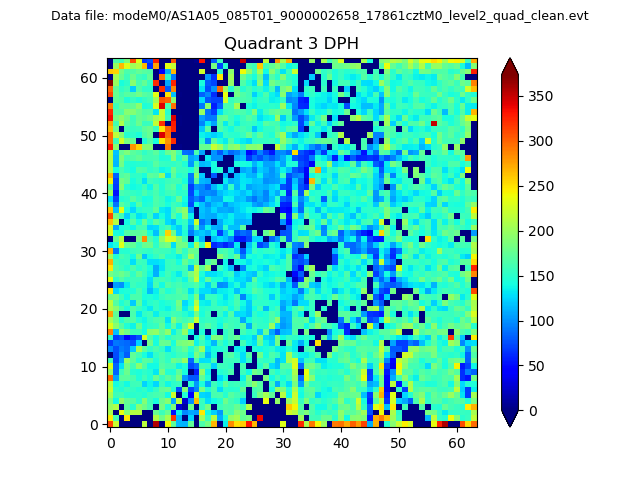 |
 |
Quadrant C |
| Plot type | Count rate plots | Images |
|---|---|---|
| Comparison with Poisson distribution Blue bars denote a histogram of data divided into 1 sec bins. Red curve is a Poisson curve with rate = median count rate of data. |
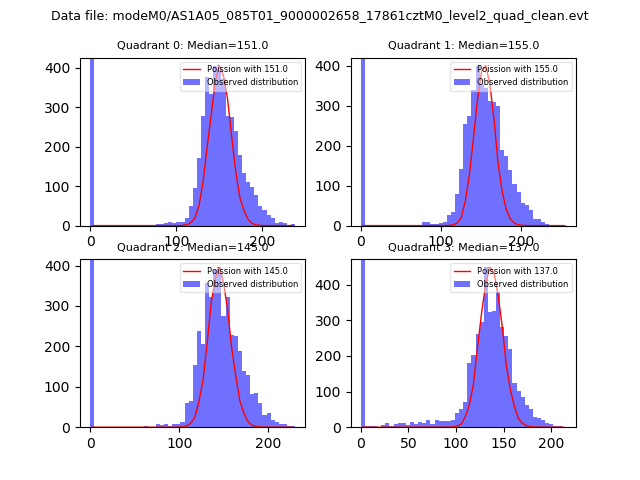 |
 |
| Quadrant-wise count rates Data is divided into 100 sec bins |
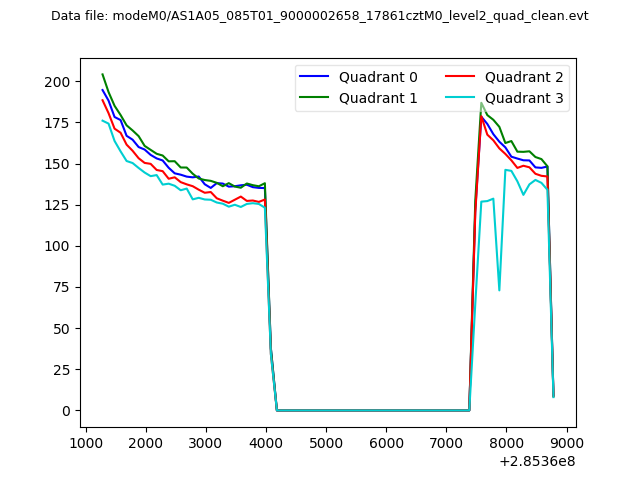 |
|
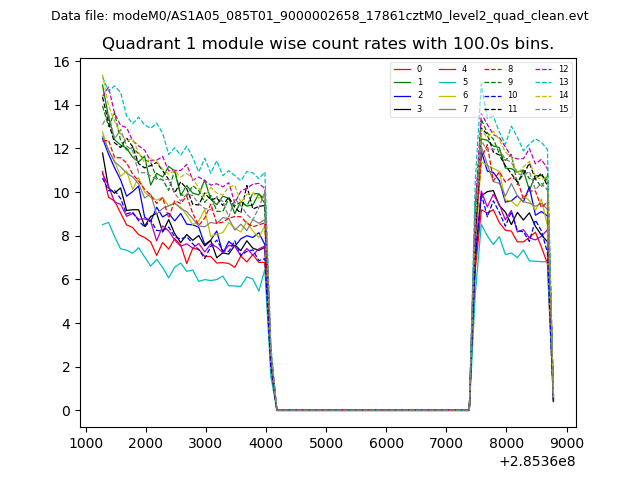
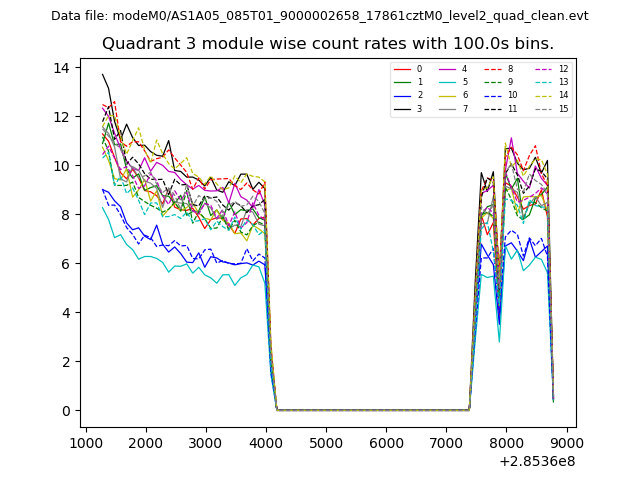
| Module-wise count rates for Quadrant A Data is divided into 100 sec bins |
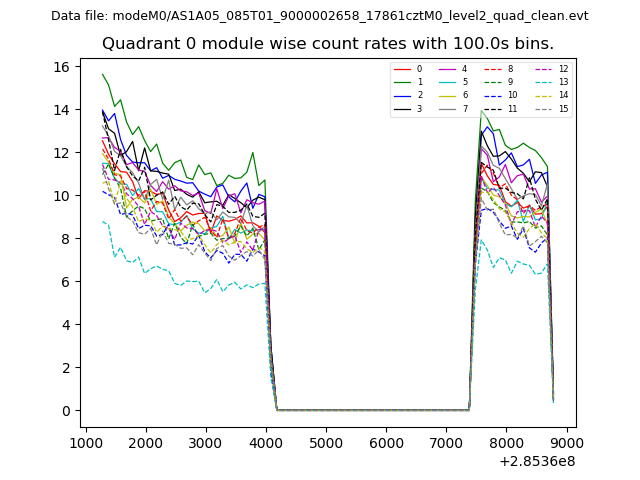 |
 |
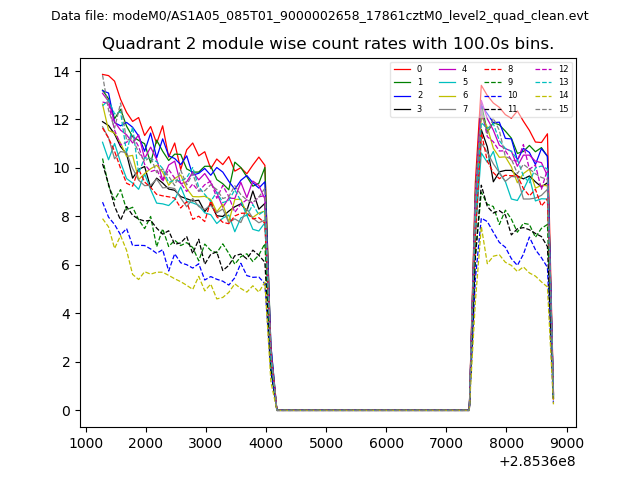
| Module-wise count rates for Quadrant B Data is divided into 100 sec bins |
 |
 |
| Module-wise count rates for Quadrant C Data is divided into 100 sec bins |
 |
 |
| Module-wise count rates for Quadrant D Data is divided into 100 sec bins |
 |
 |
| Parameter | Plot |
|---|---|
| CZT HV Monitor | 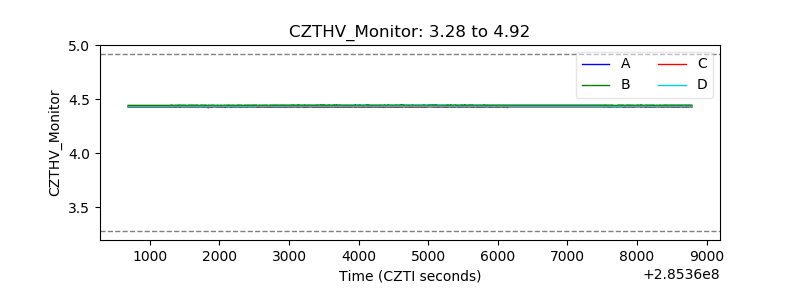 |
| D_VDD | 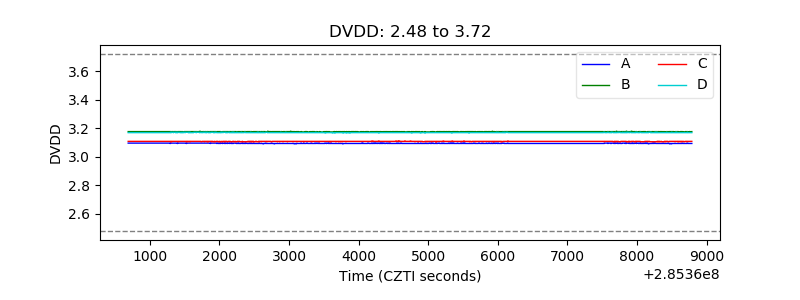 |
| Temperature 1 | 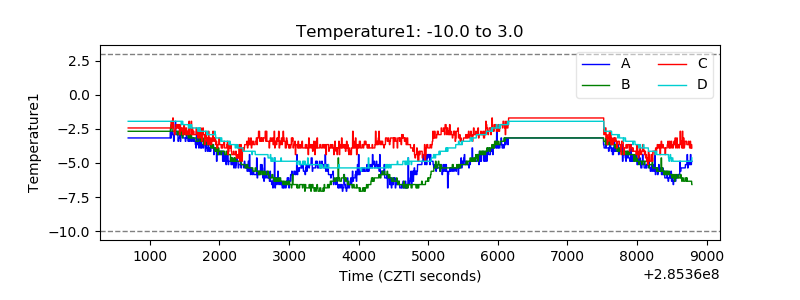 |
| Veto HV Monitor | 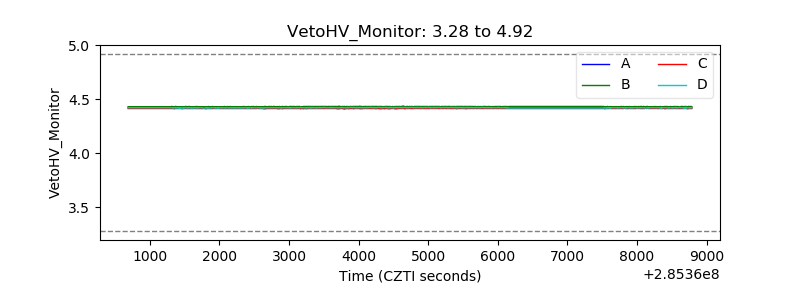 |
| Veto LLD | 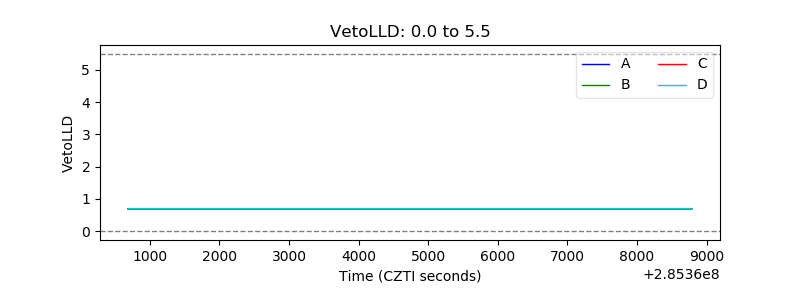 |
| Alpha Counter | 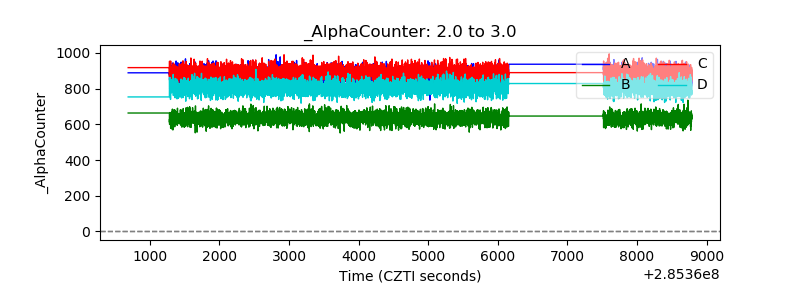 |
| _CPM_Rate | 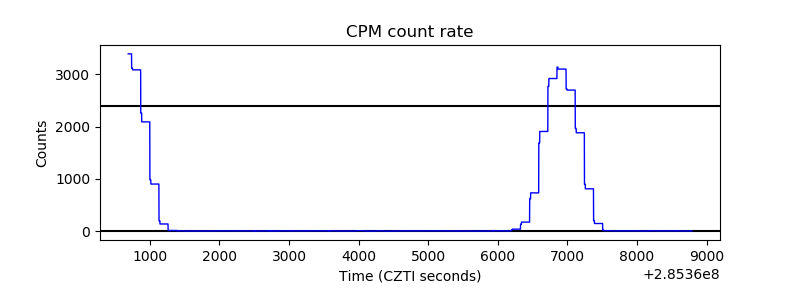 |
| CZT Counter | 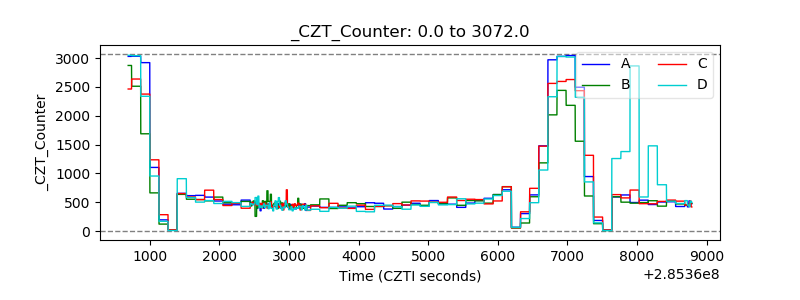 |
| +2.5 Volts monitor |  |
| +5 Volts monitor |  |
| _ROLL_ROT | 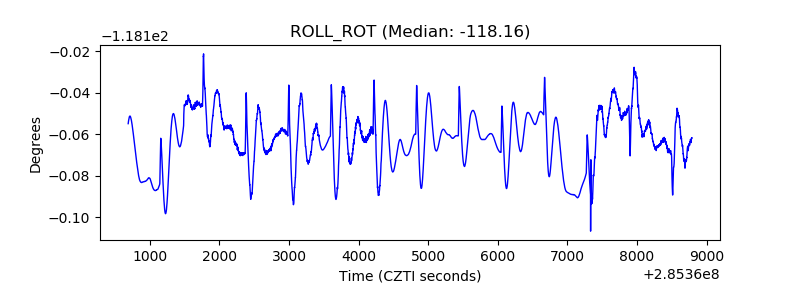 |
| _Roll_DEC |  |
| _Roll_RA | 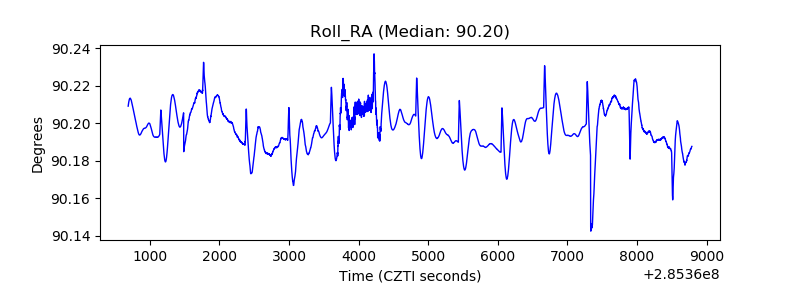 |
| Veto Counter |  |