| Param | Original file | Final file |
|---|---|---|
| Filename | modeM0/AS1A05_085T01_9000002658_17862cztM0_level2.evt | modeM0/AS1A05_085T01_9000002658_17862cztM0_level2_quad_clean.evt |
| Size (bytes) | 484,295,040 | 95,601,600 |
| Size | 461.9 MB | 91.2 MB |
| Events in quadrant A | 3,064,277 | 633,027 |
| Events in quadrant B | 3,174,397 | 650,805 |
| Events in quadrant C | 3,172,473 | 615,617 |
| Events in quadrant D | 4,826,193 | 554,301 |
| Mode SS | |||
|---|---|---|---|
| Quadrant | BADHDUFLAG | Total packets | Discarded packets |
| A | 0 | 130 | 0 |
| B | 0 | 130 | 0 |
| C | 0 | 130 | 0 |
| D | 0 | 130 | 0 |
| Mode M9 | |||
|---|---|---|---|
| Quadrant | BADHDUFLAG | Total packets | Discarded packets |
| A | 0 | 24 | 0 |
| B | 0 | 25 | 0 |
| C | 0 | 25 | 0 |
| D | 0 | 25 | 0 |
| Mode M0 | |||
|---|---|---|---|
| Quadrant | BADHDUFLAG | Total packets | Discarded packets |
| A | 0 | 13190 | 2 |
| B | 0 | 13343 | 2 |
| C | 0 | 13222 | 2 |
| D | 0 | 18597 | 2 |
| Quadrant | Total seconds | Saturated seconds | Saturation percentage |
|---|---|---|---|
| A | 6319 | 21 | 0.332331% |
| B | 6319 | 49 | 0.775439% |
| C | 6319 | 53 | 0.838740% |
| D | 6319 | 520 | 8.229150% |
Noise dominated data is calculated using 1-second bins in cleaned event files. If a bin has >2000 counts, and if more than 50% of those come from <1% of pixels, then it is considered to be noise-dominated and hence unusable.
| Quadrant | # 1 sec bins | Bins with >0 counts | Bins with >2000 counts | High rate bins dominated by noise | Noise dominated (total time) | Noise dominated (detector-on time) | Marked lightcurve |
|---|---|---|---|---|---|---|---|
| A | 7684 | 6320 | 0 | 0 | 0.00% | 0.00% | 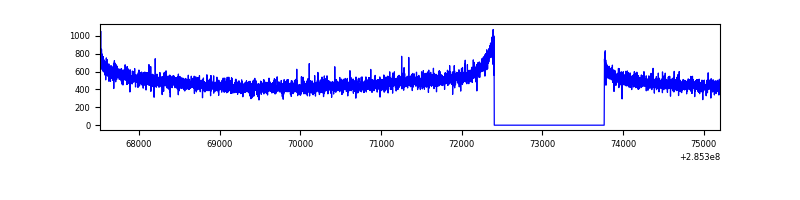 |
| B | 7684 | 6320 | 0 | 0 | 0.00% | 0.00% | 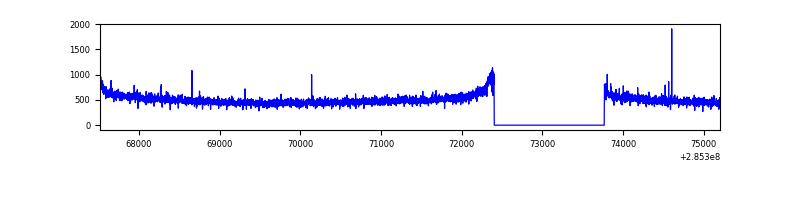 |
| C | 7684 | 6320 | 0 | 0 | 0.00% | 0.00% | 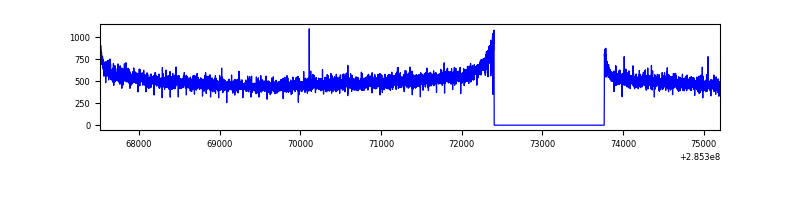 |
| D | 7684 | 6320 | 453 | 453 | 5.90% | 7.17% | 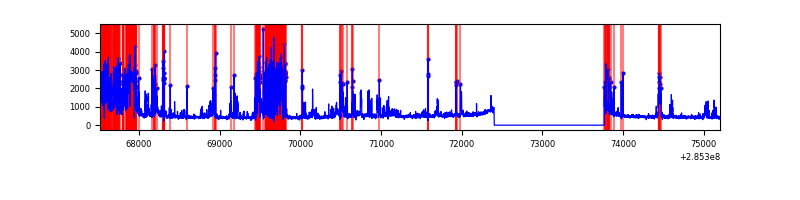 |
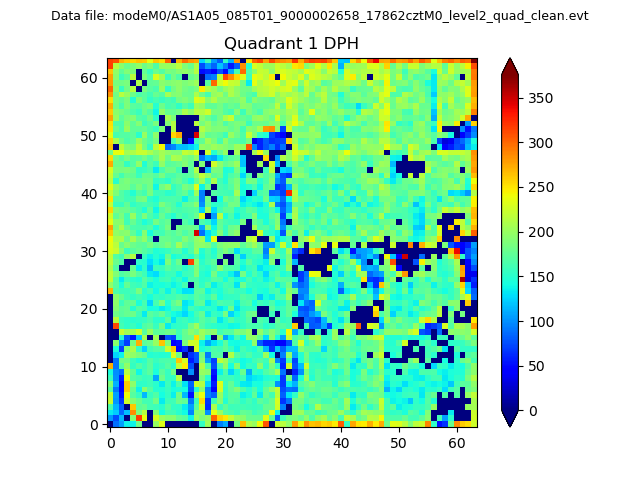
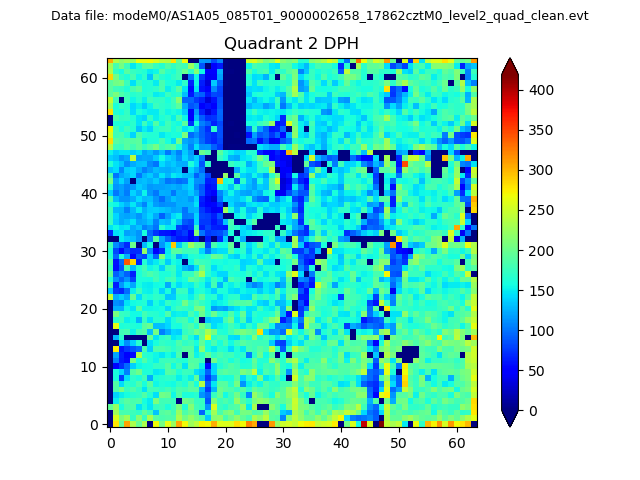
Top three noisy pixels from each quadrant. If the there are fewer than three noisy pixels in the level2.evt file, extra rows are filled as -1
| Pixel properties | Quadrant properties | ||||||
|---|---|---|---|---|---|---|---|
| Quadrant | DetID | PixID | Counts | Sigma | Mean | Median | Sigma |
| A | 0 | 226 | 6804 | 37.73 | 797 | 782 | 159.6 |
| A | 3 | 137 | 5979 | 32.56 | 797 | 782 | 159.6 |
| A | 12 | 194 | 5479 | 29.43 | 797 | 782 | 159.6 |
| B | 12 | 111 | 17906 | 113.89 | 808 | 791 | 150.3 |
| B | 11 | 111 | 15041 | 94.82 | 808 | 791 | 150.3 |
| B | 14 | 111 | 13538 | 84.82 | 808 | 791 | 150.3 |
| C | 14 | 238 | 122614 | 683.85 | 769 | 776 | 178.2 |
| C | 5 | 218 | 33445 | 183.36 | 769 | 776 | 178.2 |
| C | 5 | 219 | 6949 | 34.65 | 769 | 776 | 178.2 |
| D | 7 | 238 | 1860062 | 9481.44 | 729 | 714 | 196.1 |
| D | 1 | 52 | 96314 | 487.5 | 729 | 714 | 196.1 |
| D | 2 | 14 | 47813 | 240.17 | 729 | 714 | 196.1 |
Histogram calculated using DETX and DETY for each event in the final _common_clean file
| Quadrant A | 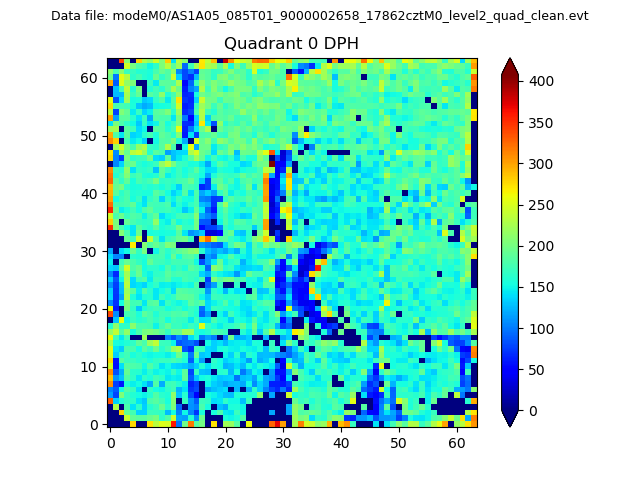 |
 |
Quadrant B |
|---|---|---|---|
| Quadrant D | 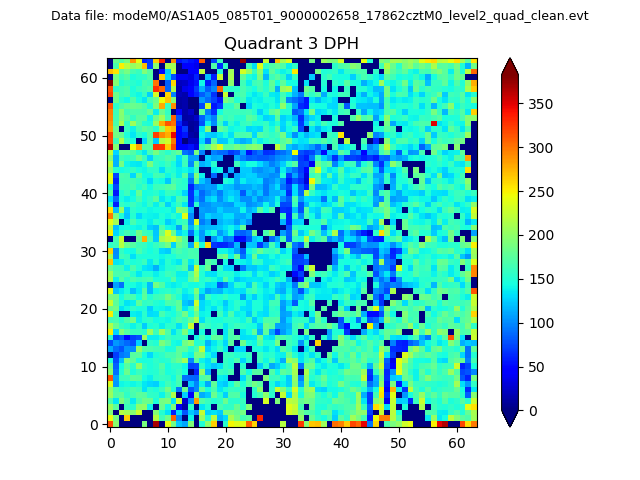 |
 |
Quadrant C |
| Plot type | Count rate plots | Images |
|---|---|---|
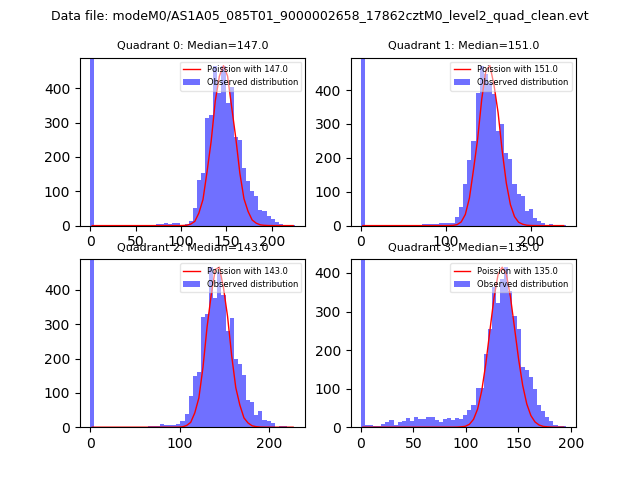
| Comparison with Poisson distribution Blue bars denote a histogram of data divided into 1 sec bins. Red curve is a Poisson curve with rate = median count rate of data. |
 |
 |
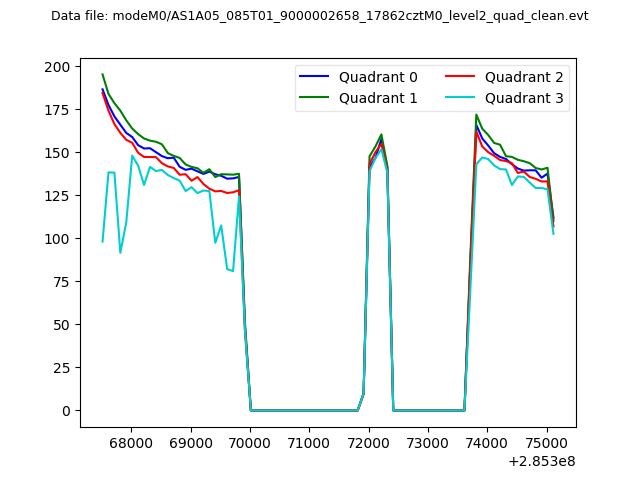
| Quadrant-wise count rates Data is divided into 100 sec bins |
 |
|
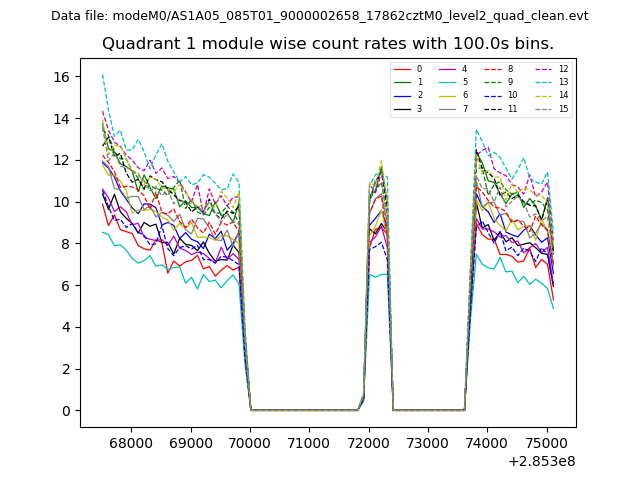
| Module-wise count rates for Quadrant A Data is divided into 100 sec bins |
 |
 |
| Module-wise count rates for Quadrant B Data is divided into 100 sec bins |
 |
 |
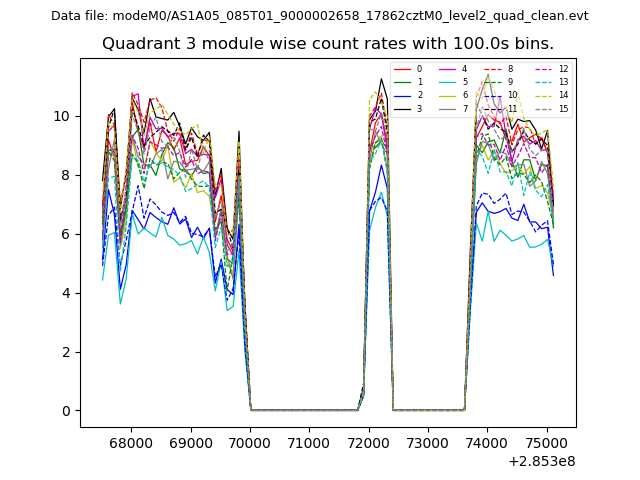
| Module-wise count rates for Quadrant C Data is divided into 100 sec bins |
 |
 |
| Module-wise count rates for Quadrant D Data is divided into 100 sec bins |
 |
 |
| Parameter | Plot |
|---|---|
| CZT HV Monitor | 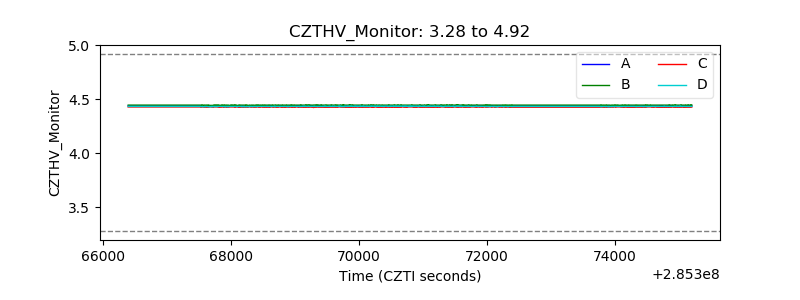 |
| D_VDD | 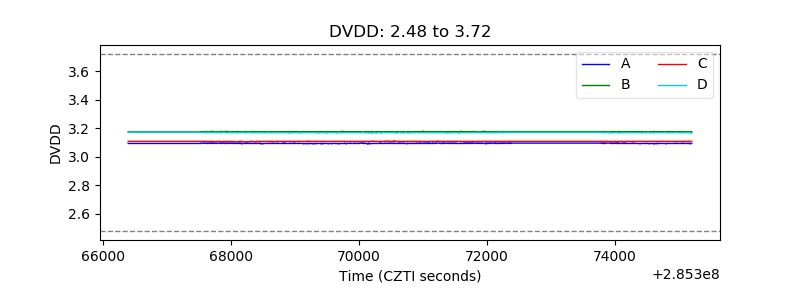 |
| Temperature 1 | 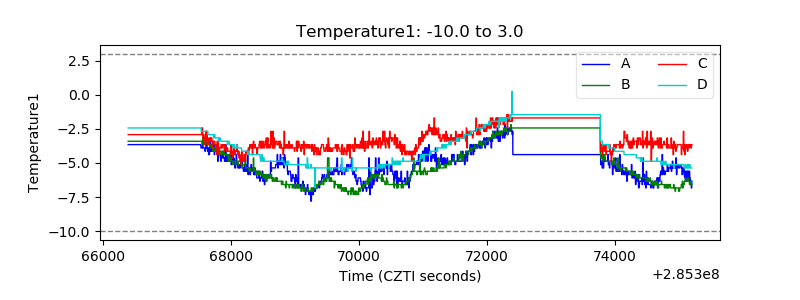 |
| Veto HV Monitor | 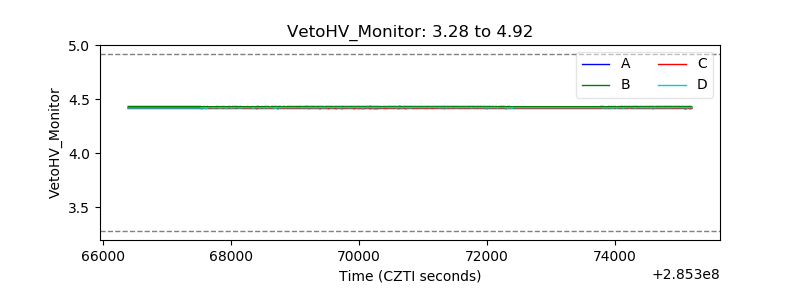 |
| Veto LLD | 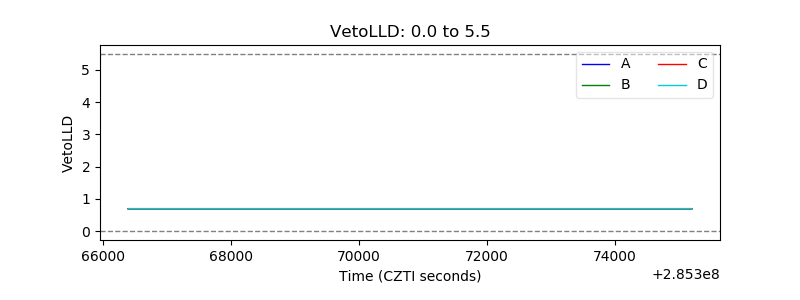 |
| Alpha Counter | 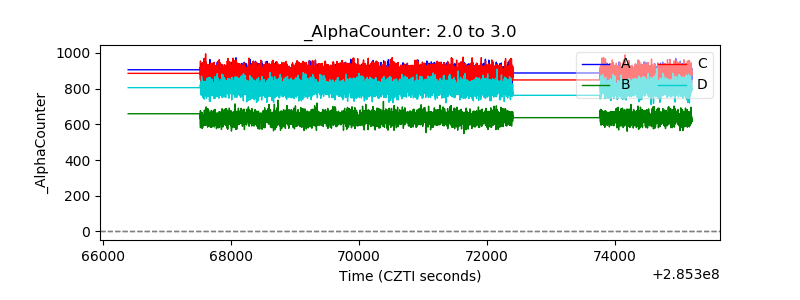 |
| _CPM_Rate | 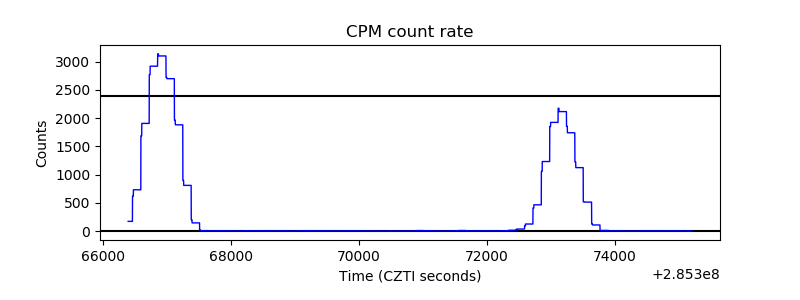 |
| CZT Counter | 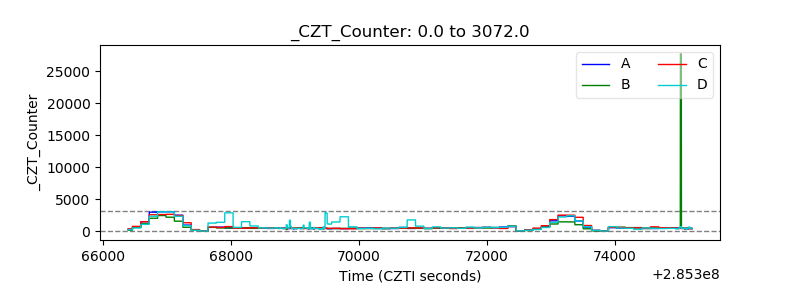 |
| +2.5 Volts monitor |  |
| +5 Volts monitor |  |
| _ROLL_ROT | 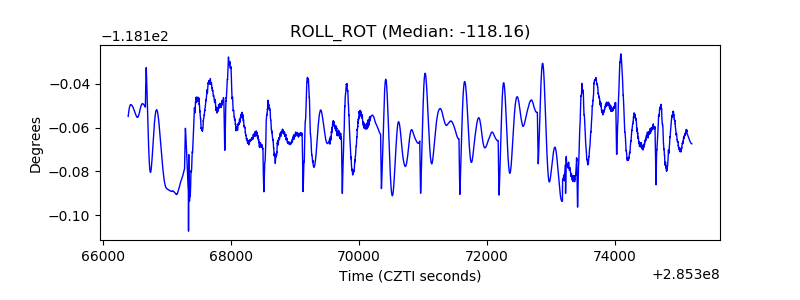 |
| _Roll_DEC | 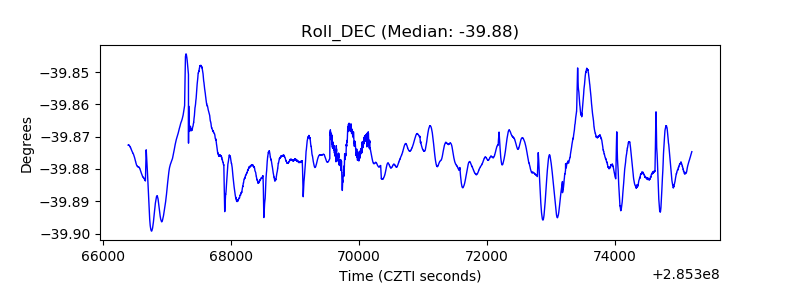 |
| _Roll_RA | 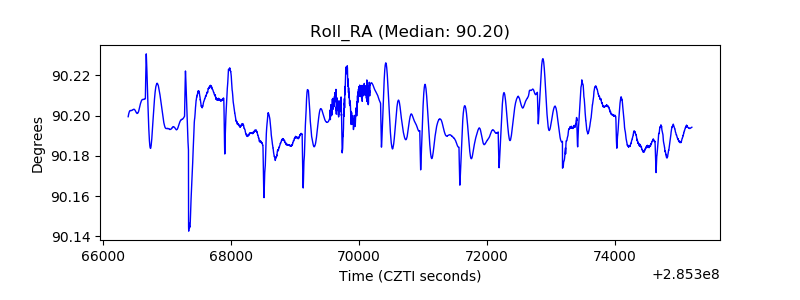 |
| Veto Counter | 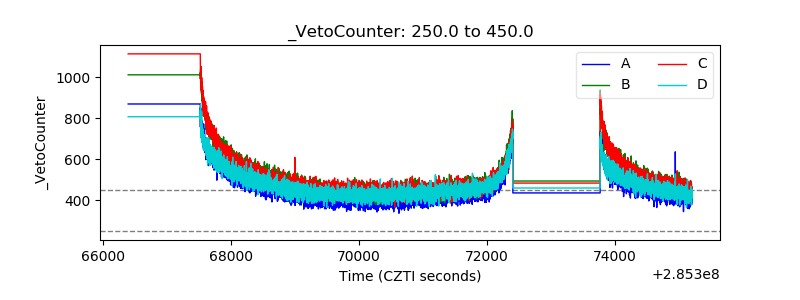 |