| Param | Original file | Final file |
|---|---|---|
| Filename | modeM0/AS1A05_085T01_9000002658_17866cztM0_level2.evt | modeM0/AS1A05_085T01_9000002658_17866cztM0_level2_quad_clean.evt |
| Size (bytes) | 567,829,440 | 100,607,040 |
| Size | 541.5 MB | 95.9 MB |
| Events in quadrant A | 3,757,076 | 633,922 |
| Events in quadrant B | 3,846,426 | 638,996 |
| Events in quadrant C | 4,088,747 | 612,624 |
| Events in quadrant D | 4,959,329 | 602,879 |
| Mode SS | |||
|---|---|---|---|
| Quadrant | BADHDUFLAG | Total packets | Discarded packets |
| A | 0 | 166 | 0 |
| B | 0 | 166 | 0 |
| C | 0 | 166 | 0 |
| D | 0 | 166 | 0 |
| Mode M9 | |||
|---|---|---|---|
| Quadrant | BADHDUFLAG | Total packets | Discarded packets |
| A | 0 | 6 | 0 |
| B | 0 | 6 | 0 |
| C | 0 | 6 | 0 |
| D | 0 | 6 | 0 |
| Mode M0 | |||
|---|---|---|---|
| Quadrant | BADHDUFLAG | Total packets | Discarded packets |
| A | 0 | 16746 | 2 |
| B | 0 | 16765 | 2 |
| C | 0 | 17166 | 2 |
| D | 0 | 20497 | 2 |
| Quadrant | Total seconds | Saturated seconds | Saturation percentage |
|---|---|---|---|
| A | 8024 | 155 | 1.931705% |
| B | 8024 | 213 | 2.654536% |
| C | 8024 | 251 | 3.128116% |
| D | 8024 | 473 | 5.894816% |
Noise dominated data is calculated using 1-second bins in cleaned event files. If a bin has >2000 counts, and if more than 50% of those come from <1% of pixels, then it is considered to be noise-dominated and hence unusable.
| Quadrant | # 1 sec bins | Bins with >0 counts | Bins with >2000 counts | High rate bins dominated by noise | Noise dominated (total time) | Noise dominated (detector-on time) | Marked lightcurve |
|---|---|---|---|---|---|---|---|
| A | 8614 | 8026 | 0 | 0 | 0.00% | 0.00% | 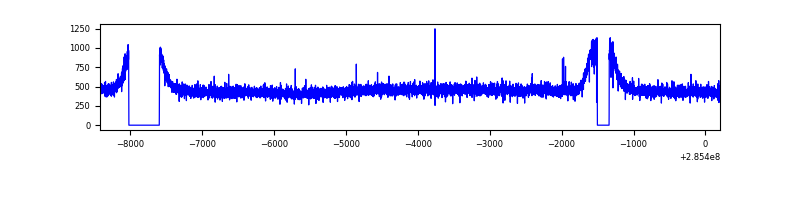 |
| B | 8614 | 8026 | 1 | 1 | 0.01% | 0.01% | 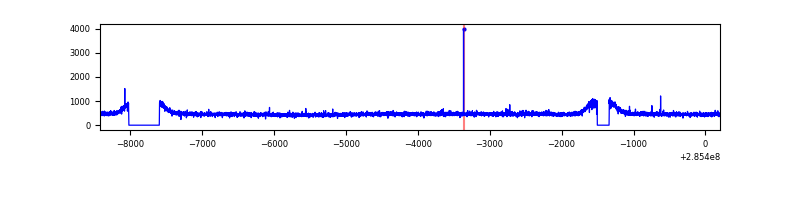 |
| C | 8614 | 8026 | 0 | 0 | 0.00% | 0.00% | 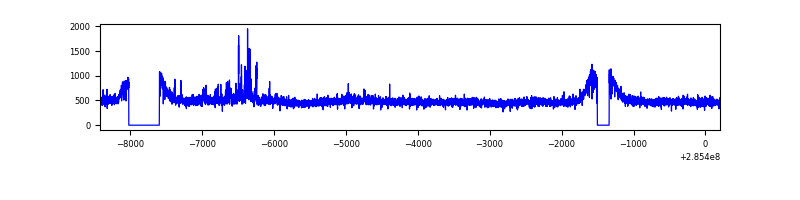 |
| D | 8614 | 8025 | 255 | 255 | 2.96% | 3.18% | 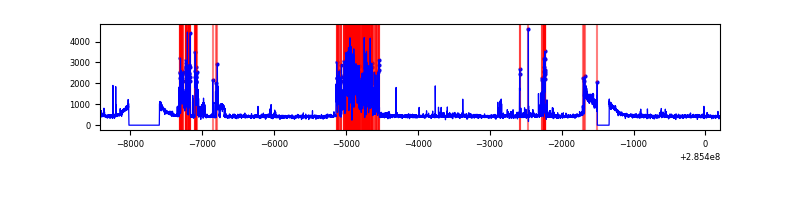 |
Top three noisy pixels from each quadrant. If the there are fewer than three noisy pixels in the level2.evt file, extra rows are filled as -1
| Pixel properties | Quadrant properties | ||||||
|---|---|---|---|---|---|---|---|
| Quadrant | DetID | PixID | Counts | Sigma | Mean | Median | Sigma |
| A | 0 | 226 | 8373 | 37.37 | 977 | 954 | 198.5 |
| A | 3 | 137 | 7734 | 34.15 | 977 | 954 | 198.5 |
| A | 12 | 194 | 6852 | 29.71 | 977 | 954 | 198.5 |
| B | 12 | 111 | 23472 | 117.78 | 978 | 951 | 191.2 |
| B | 11 | 111 | 20517 | 102.33 | 978 | 951 | 191.2 |
| B | 14 | 111 | 18038 | 89.36 | 978 | 951 | 191.2 |
| C | 3 | 233 | 204226 | 909.52 | 942 | 947 | 223.5 |
| C | 14 | 238 | 139681 | 620.73 | 942 | 947 | 223.5 |
| C | 5 | 218 | 55592 | 244.5 | 942 | 947 | 223.5 |
| D | 12 | 227 | 819597 | 3430.57 | 934 | 911 | 238.6 |
| D | 7 | 238 | 532281 | 2226.62 | 934 | 911 | 238.6 |
| D | 2 | 234 | 35945 | 146.8 | 934 | 911 | 238.6 |
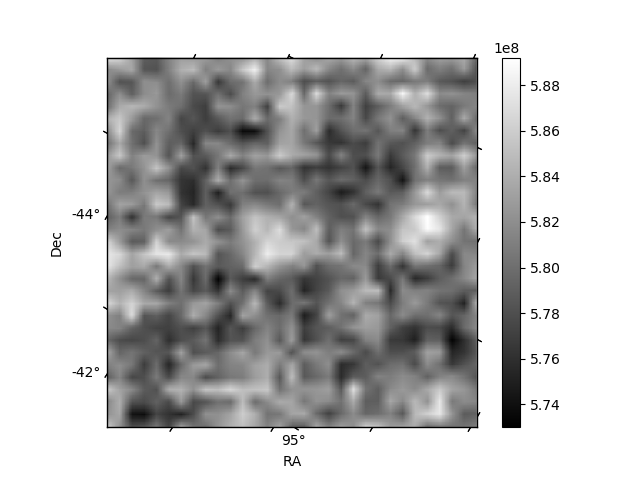
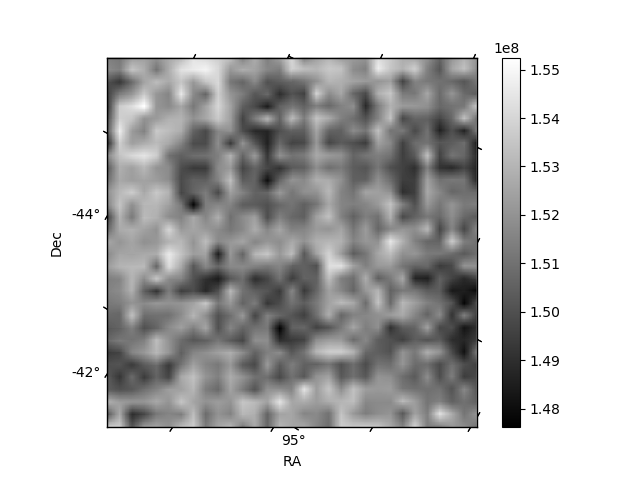
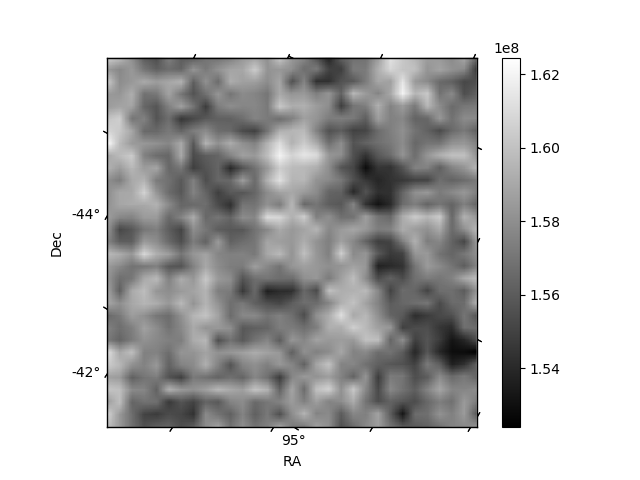
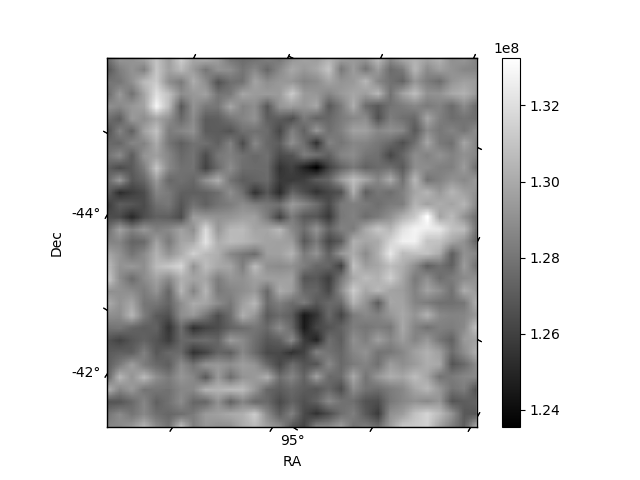
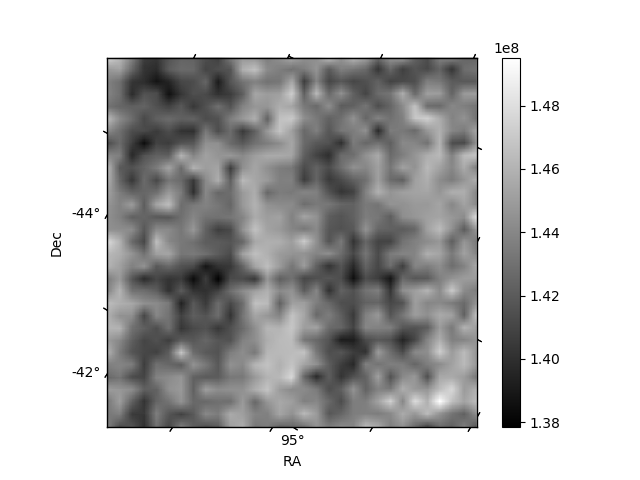
Histogram calculated using DETX and DETY for each event in the final _common_clean file
| Quadrant A | 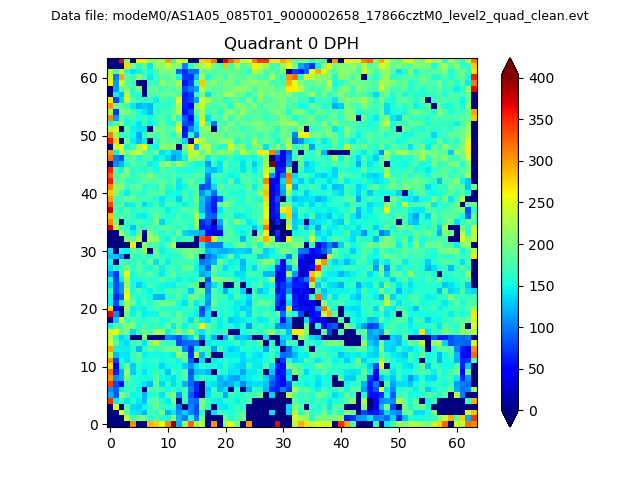 |
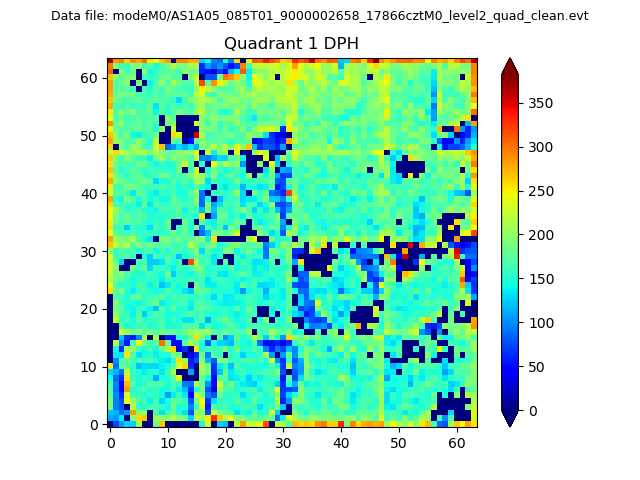 |
Quadrant B |
|---|---|---|---|
| Quadrant D | 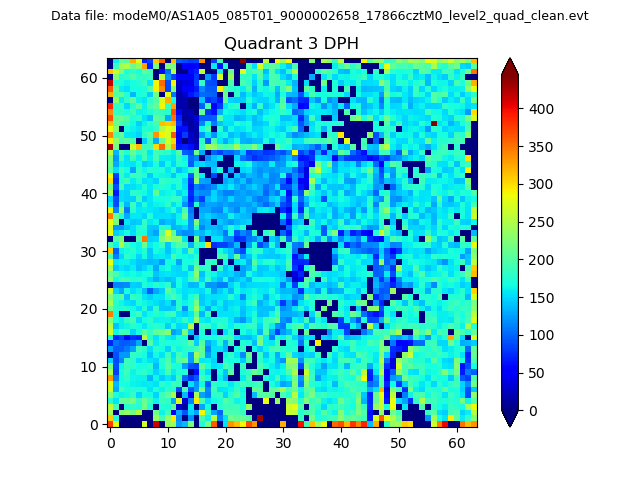 |
 |
Quadrant C |
| Plot type | Count rate plots | Images |
|---|---|---|
| Comparison with Poisson distribution Blue bars denote a histogram of data divided into 1 sec bins. Red curve is a Poisson curve with rate = median count rate of data. |
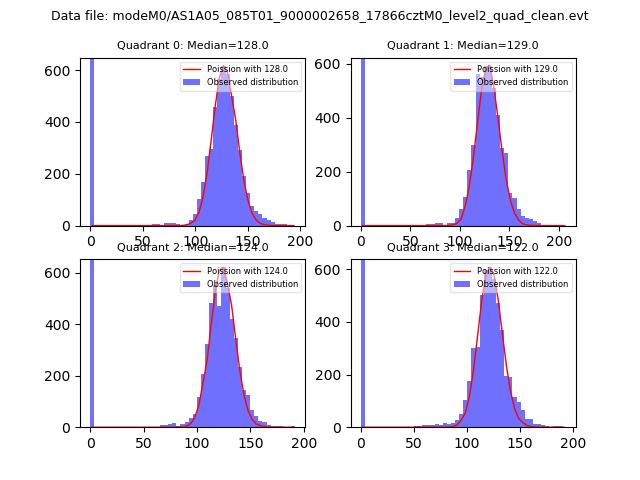 |
 |
| Quadrant-wise count rates Data is divided into 100 sec bins |
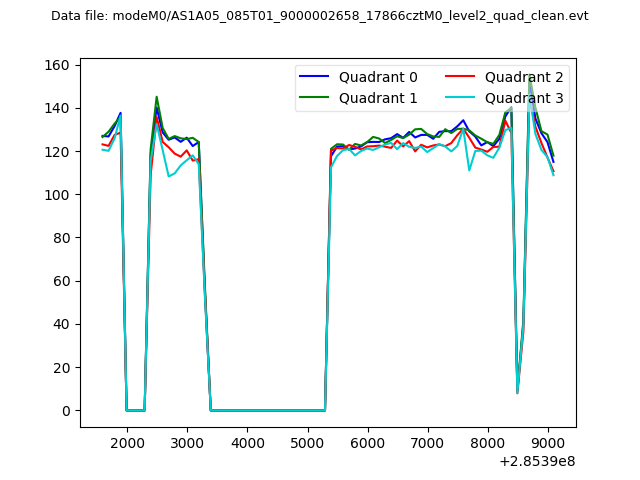 |
|
| Module-wise count rates for Quadrant A Data is divided into 100 sec bins |
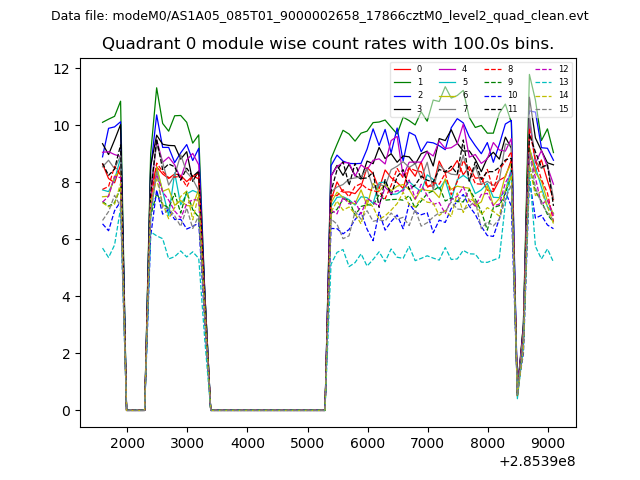 |
 |
| Module-wise count rates for Quadrant B Data is divided into 100 sec bins |
 |
 |
| Module-wise count rates for Quadrant C Data is divided into 100 sec bins |
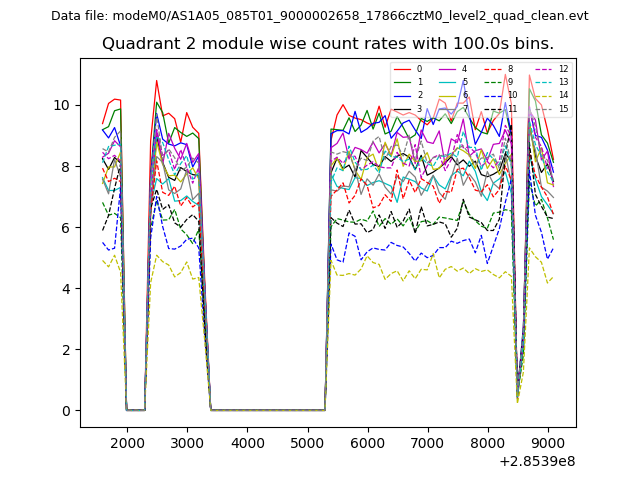 |
 |
| Module-wise count rates for Quadrant D Data is divided into 100 sec bins |
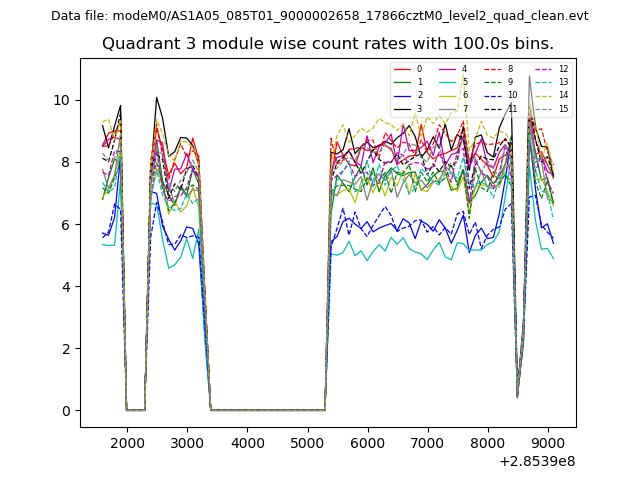 |
 |
| Parameter | Plot |
|---|---|
| CZT HV Monitor | 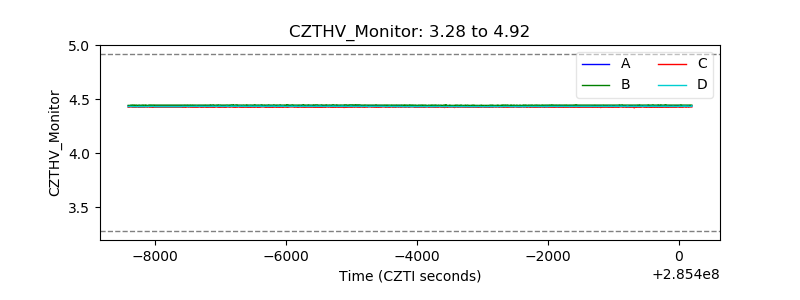 |
| D_VDD | 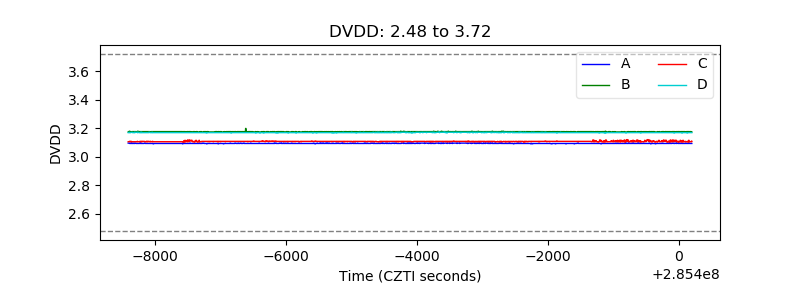 |
| Temperature 1 | 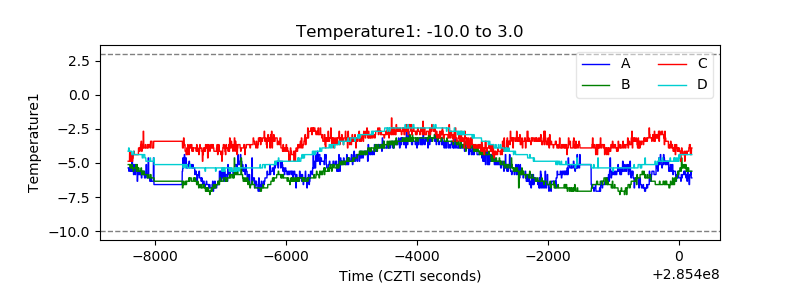 |
| Veto HV Monitor | 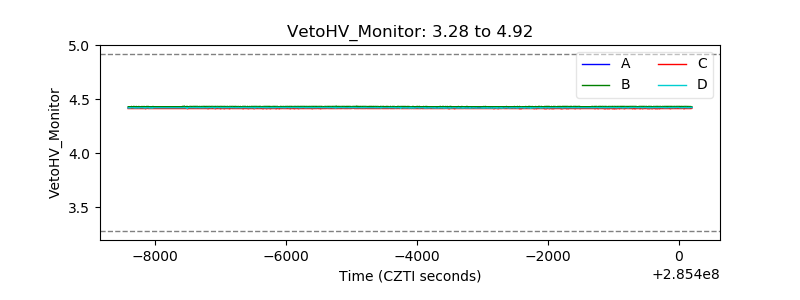 |
| Veto LLD | 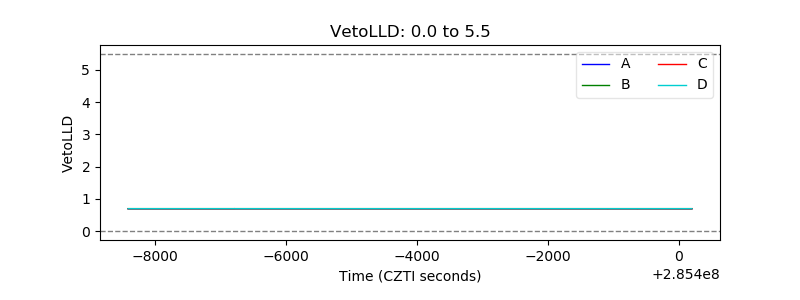 |
| Alpha Counter |  |
| _CPM_Rate | 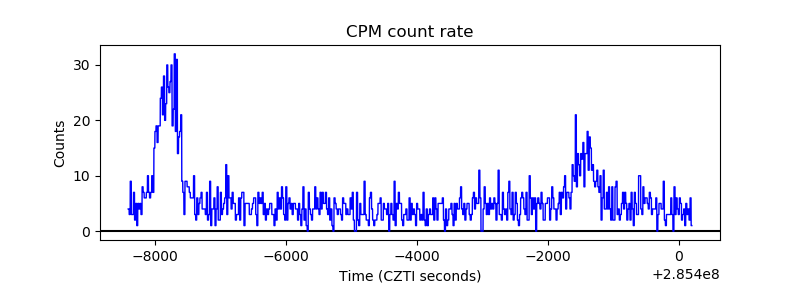 |
| CZT Counter |  |
| +2.5 Volts monitor |  |
| +5 Volts monitor |  |
| _ROLL_ROT | 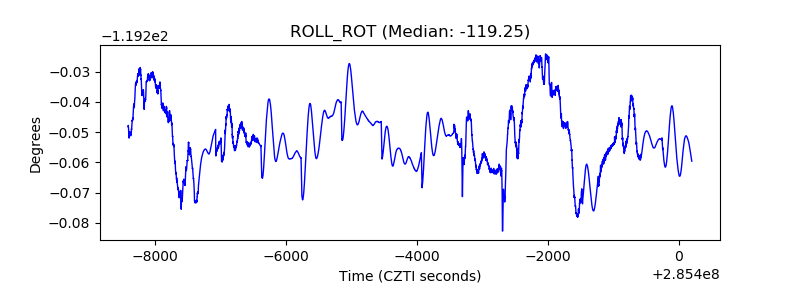 |
| _Roll_DEC | 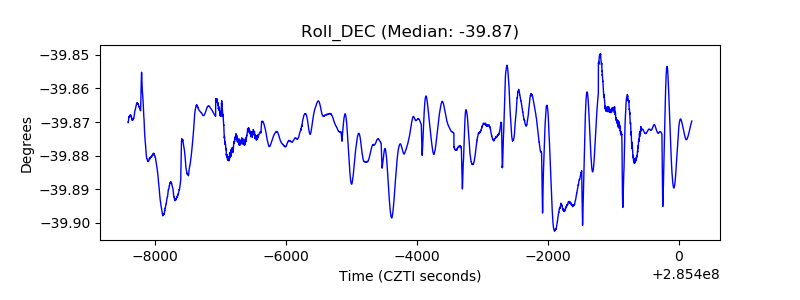 |
| _Roll_RA |  |
| Veto Counter | 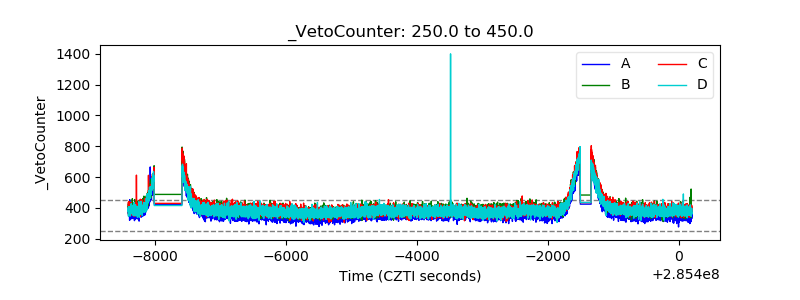 |