| Param | Original file | Final file |
|---|---|---|
| Filename | modeM0/AS1A05_085T01_9000002658_17867cztM0_level2.evt | modeM0/AS1A05_085T01_9000002658_17867cztM0_level2_quad_clean.evt |
| Size (bytes) | 499,458,240 | 83,275,200 |
| Size | 476.3 MB | 79.4 MB |
| Events in quadrant A | 3,544,101 | 505,749 |
| Events in quadrant B | 3,615,296 | 509,295 |
| Events in quadrant C | 3,673,049 | 489,264 |
| Events in quadrant D | 3,773,627 | 485,055 |
| Mode SS | |||
|---|---|---|---|
| Quadrant | BADHDUFLAG | Total packets | Discarded packets |
| A | 0 | 160 | 0 |
| B | 0 | 160 | 0 |
| C | 0 | 160 | 0 |
| D | 0 | 160 | 0 |
| Mode M9 | |||
|---|---|---|---|
| Quadrant | BADHDUFLAG | Total packets | Discarded packets |
| A | 0 | 3 | 0 |
| B | 0 | 3 | 0 |
| C | 0 | 3 | 0 |
| D | 0 | 3 | 0 |
| Mode M0 | |||
|---|---|---|---|
| Quadrant | BADHDUFLAG | Total packets | Discarded packets |
| A | 0 | 15839 | 2 |
| B | 0 | 15834 | 2 |
| C | 0 | 15854 | 2 |
| D | 0 | 16565 | 2 |
| Quadrant | Total seconds | Saturated seconds | Saturation percentage |
|---|---|---|---|
| A | 7638 | 157 | 2.055512% |
| B | 7638 | 183 | 2.395915% |
| C | 7638 | 212 | 2.775596% |
| D | 7638 | 177 | 2.317361% |
Noise dominated data is calculated using 1-second bins in cleaned event files. If a bin has >2000 counts, and if more than 50% of those come from <1% of pixels, then it is considered to be noise-dominated and hence unusable.
| Quadrant | # 1 sec bins | Bins with >0 counts | Bins with >2000 counts | High rate bins dominated by noise | Noise dominated (total time) | Noise dominated (detector-on time) | Marked lightcurve |
|---|---|---|---|---|---|---|---|
| A | 8093 | 7640 | 0 | 0 | 0.00% | 0.00% | 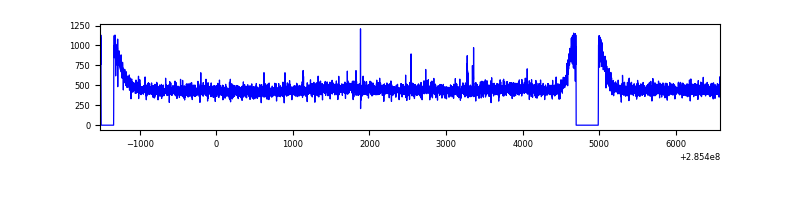 |
| B | 8093 | 7639 | 0 | 0 | 0.00% | 0.00% | 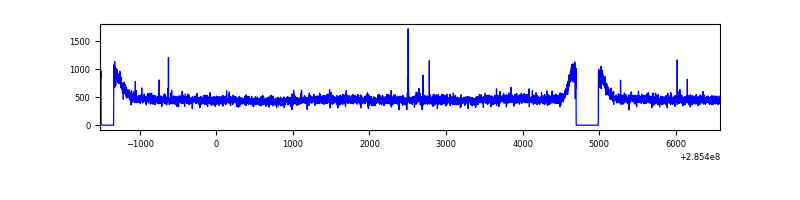 |
| C | 8093 | 7639 | 0 | 0 | 0.00% | 0.00% | 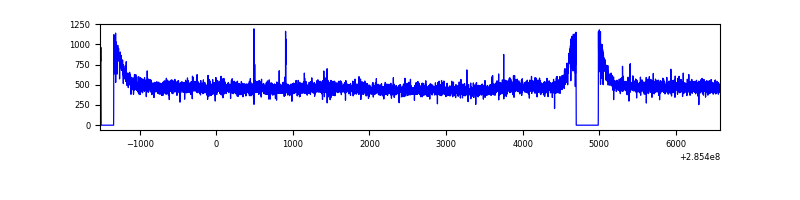 |
| D | 8093 | 7639 | 29 | 29 | 0.36% | 0.38% | 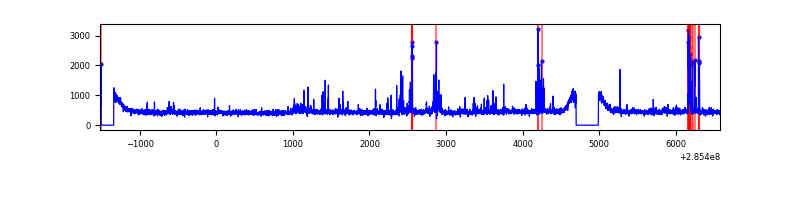 |
Top three noisy pixels from each quadrant. If the there are fewer than three noisy pixels in the level2.evt file, extra rows are filled as -1
| Pixel properties | Quadrant properties | ||||||
|---|---|---|---|---|---|---|---|
| Quadrant | DetID | PixID | Counts | Sigma | Mean | Median | Sigma |
| A | 15 | 174 | 13045 | 64.16 | 919 | 897 | 189.3 |
| A | 0 | 226 | 7814 | 36.53 | 919 | 897 | 189.3 |
| A | 3 | 137 | 7242 | 33.51 | 919 | 897 | 189.3 |
| B | 12 | 111 | 22154 | 117.62 | 920 | 894 | 180.7 |
| B | 11 | 111 | 19371 | 102.23 | 920 | 894 | 180.7 |
| B | 14 | 111 | 16759 | 87.78 | 920 | 894 | 180.7 |
| C | 14 | 238 | 135248 | 640.59 | 888 | 892 | 209.7 |
| C | 5 | 218 | 32603 | 151.19 | 888 | 892 | 209.7 |
| C | 3 | 233 | 14309 | 63.97 | 888 | 892 | 209.7 |
| D | 7 | 238 | 244733 | 1104.94 | 897 | 869 | 220.7 |
| D | 12 | 227 | 42180 | 187.18 | 897 | 869 | 220.7 |
| D | 2 | 152 | 35388 | 156.4 | 897 | 869 | 220.7 |
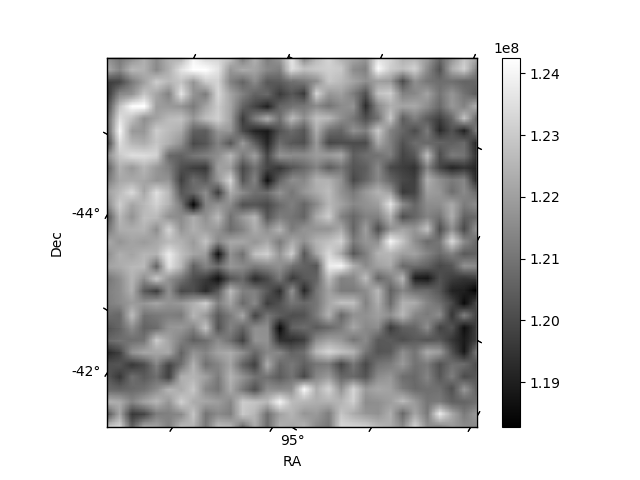
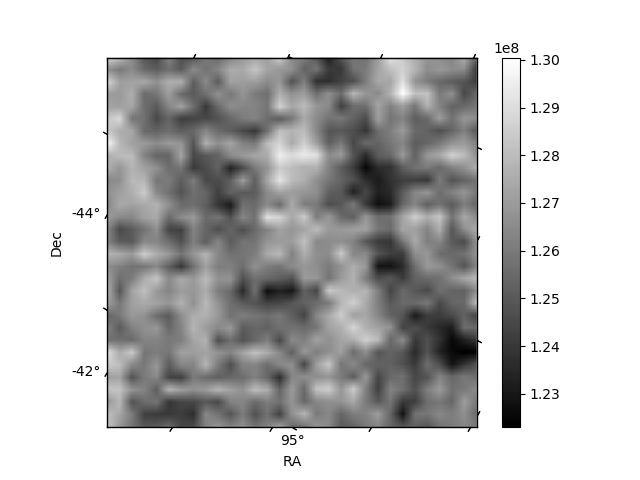
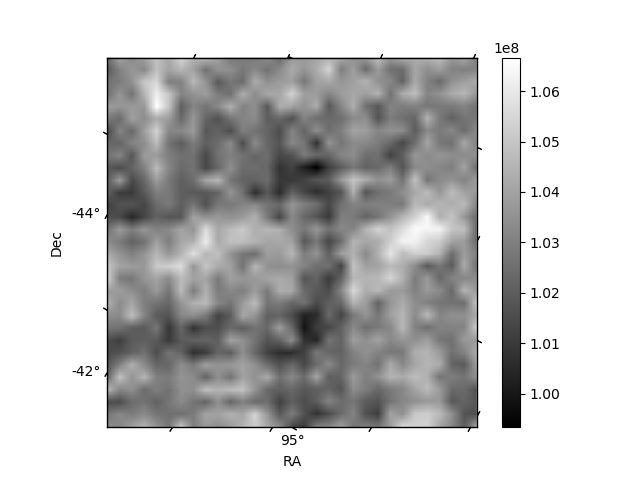
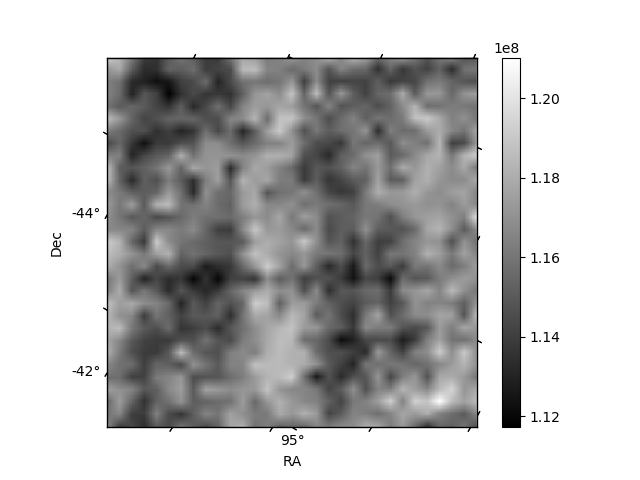
Histogram calculated using DETX and DETY for each event in the final _common_clean file
| Quadrant A | 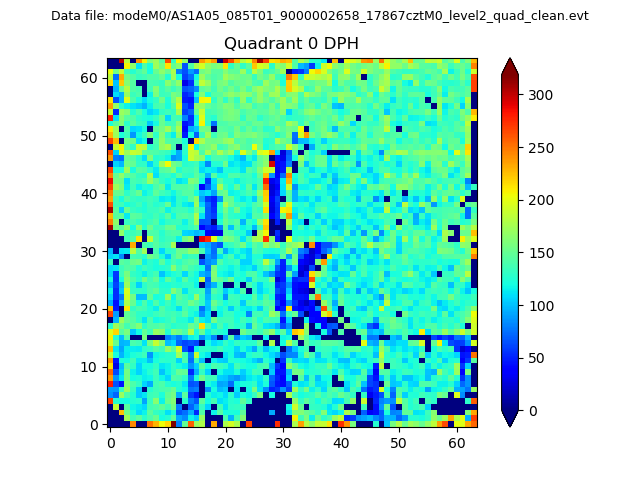 |
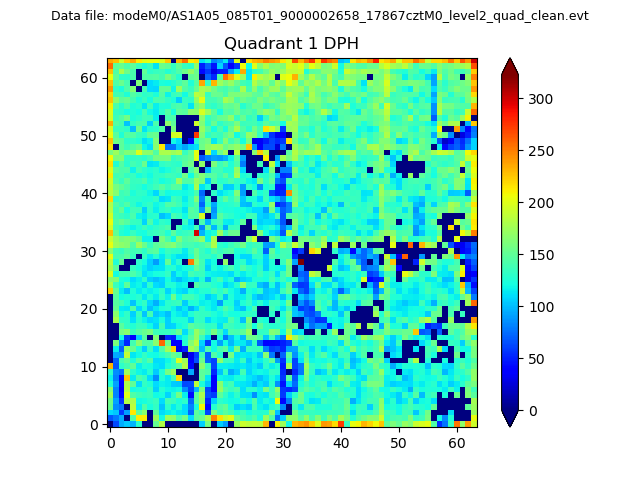 |
Quadrant B |
|---|---|---|---|
| Quadrant D | 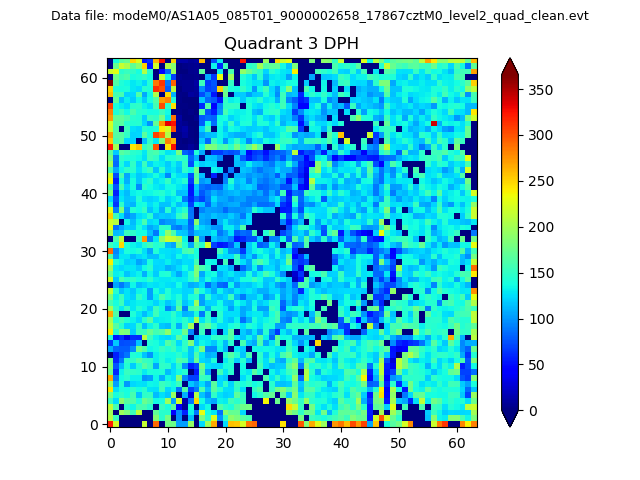 |
 |
Quadrant C |
| Plot type | Count rate plots | Images |
|---|---|---|
| Comparison with Poisson distribution Blue bars denote a histogram of data divided into 1 sec bins. Red curve is a Poisson curve with rate = median count rate of data. |
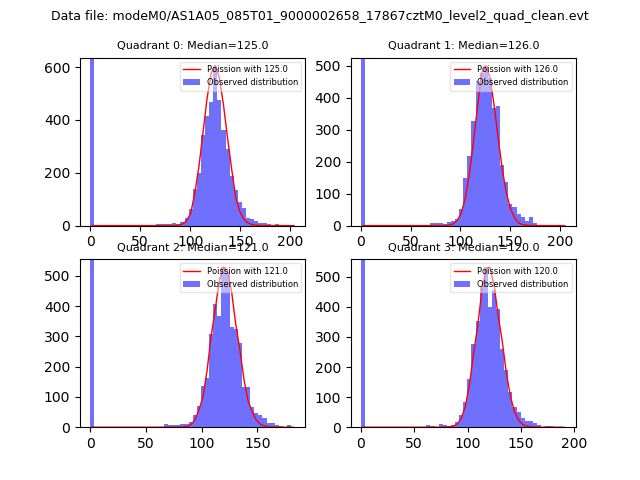 |
 |
| Quadrant-wise count rates Data is divided into 100 sec bins |
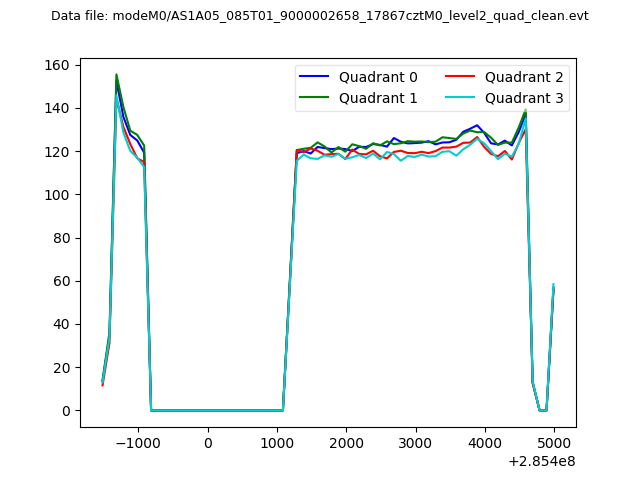 |
|
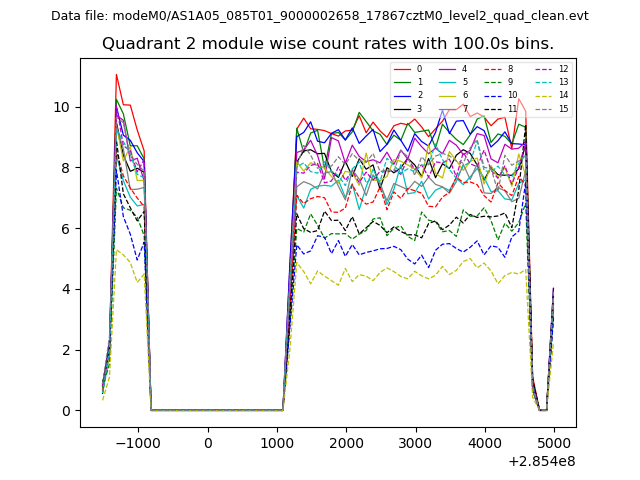
| Module-wise count rates for Quadrant A Data is divided into 100 sec bins |
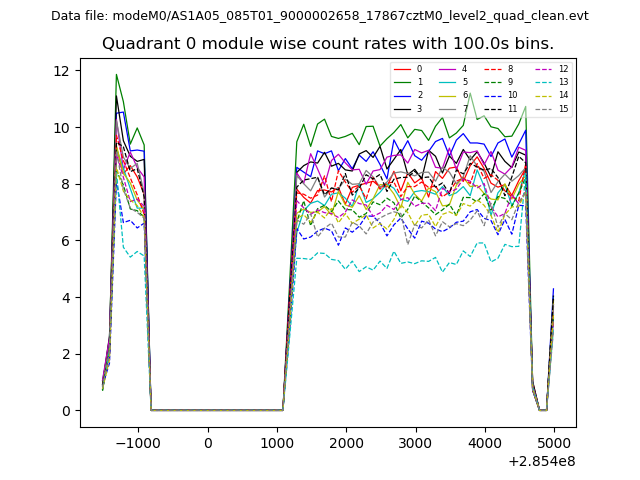 |
 |
| Module-wise count rates for Quadrant B Data is divided into 100 sec bins |
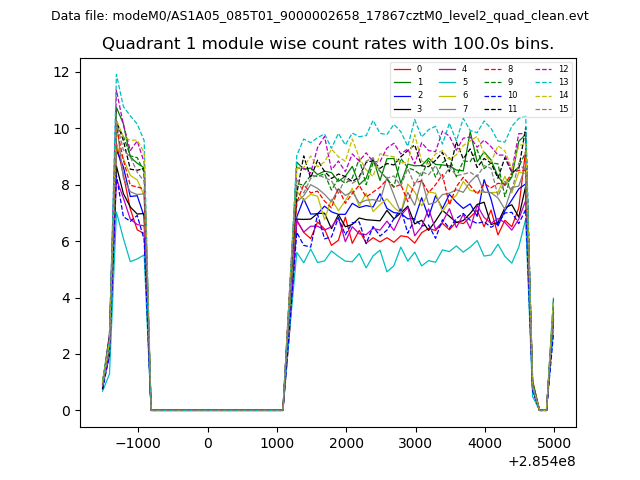 |
 |
| Module-wise count rates for Quadrant C Data is divided into 100 sec bins |
 |
 |
| Module-wise count rates for Quadrant D Data is divided into 100 sec bins |
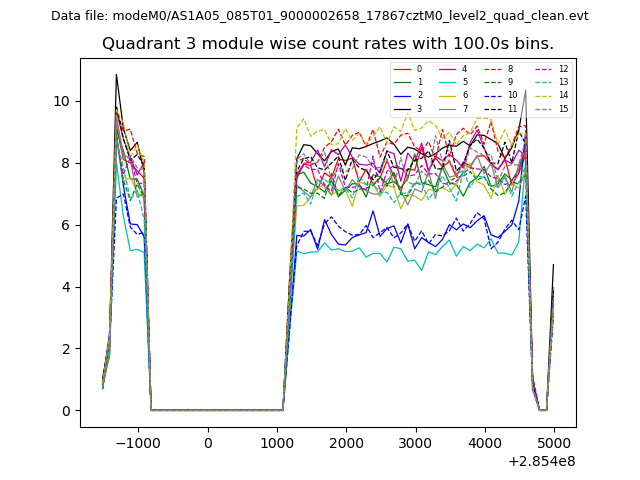 |
 |
| Parameter | Plot |
|---|---|
| CZT HV Monitor | 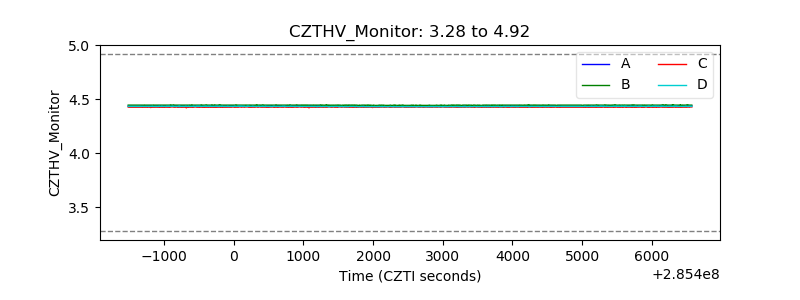 |
| D_VDD | 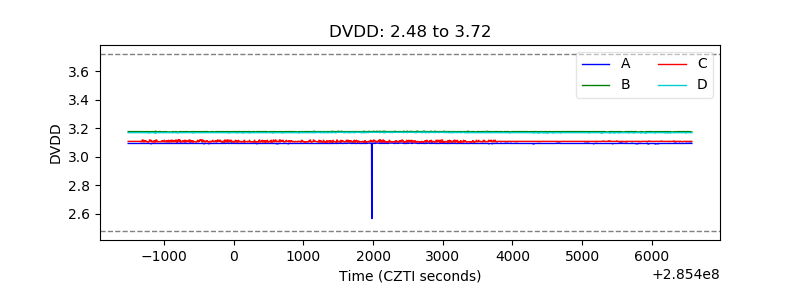 |
| Temperature 1 | 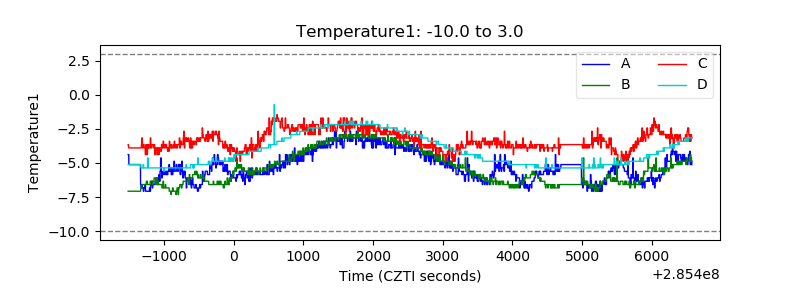 |
| Veto HV Monitor | 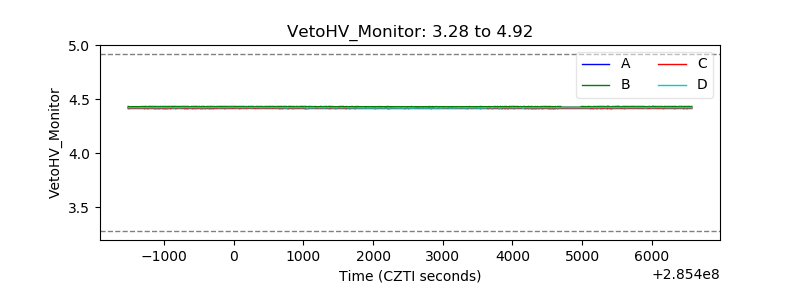 |
| Veto LLD | 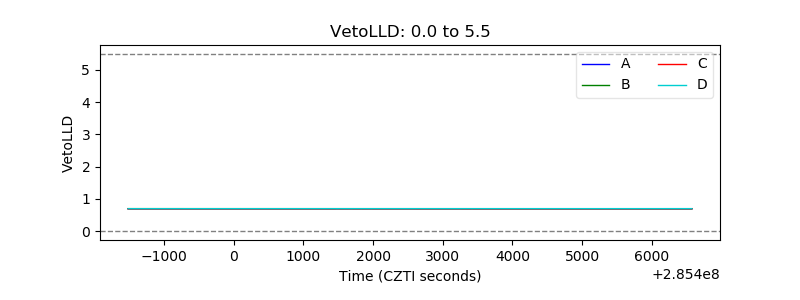 |
| Alpha Counter | 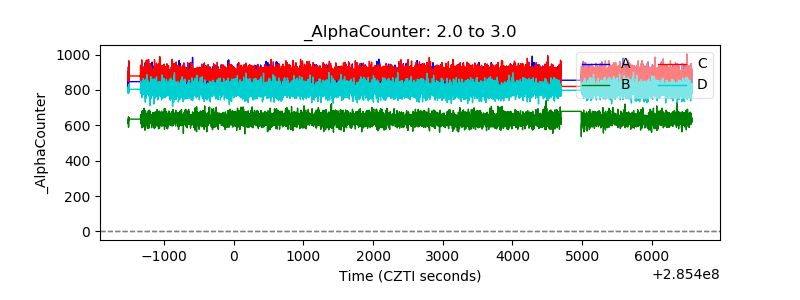 |
| _CPM_Rate | 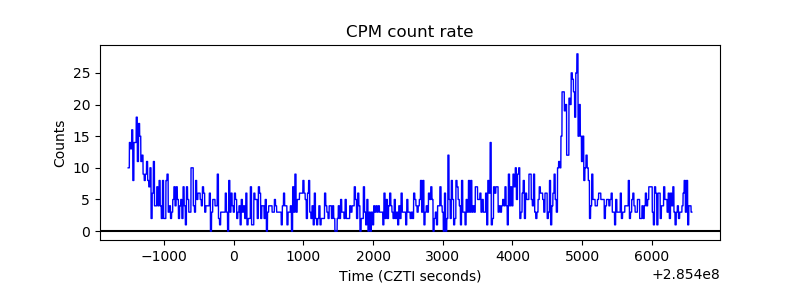 |
| CZT Counter |  |
| +2.5 Volts monitor | 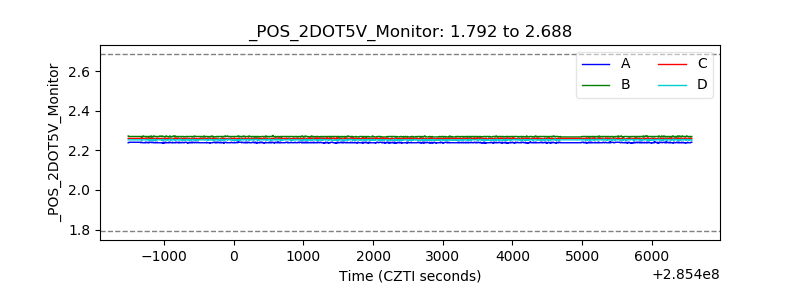 |
| +5 Volts monitor |  |
| _ROLL_ROT | 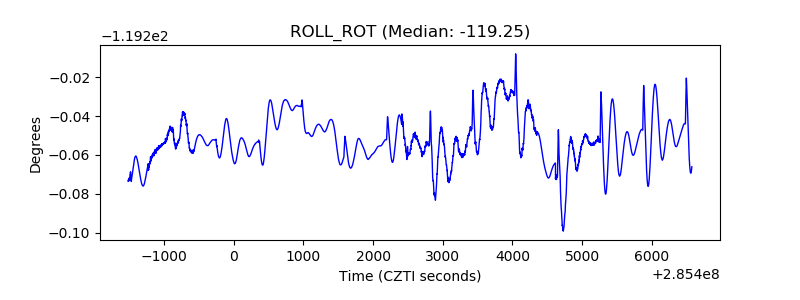 |
| _Roll_DEC | 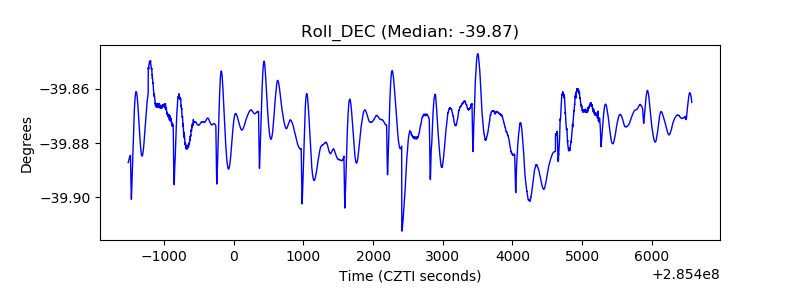 |
| _Roll_RA | 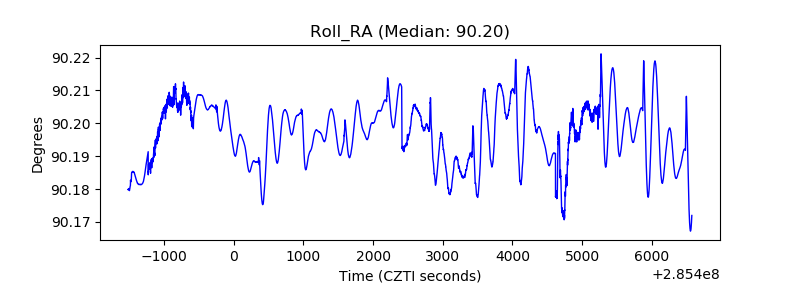 |
| Veto Counter | 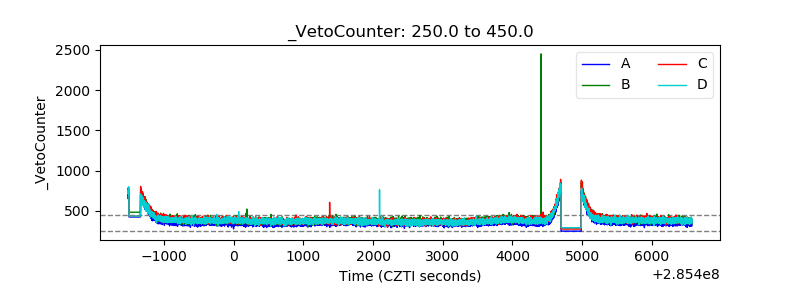 |