| Param | Original file | Final file |
|---|---|---|
| Filename | modeM0/AS1A05_085T01_9000002658_17869cztM0_level2.evt | modeM0/AS1A05_085T01_9000002658_17869cztM0_level2_quad_clean.evt |
| Size (bytes) | 615,553,920 | 105,192,000 |
| Size | 587.0 MB | 100.3 MB |
| Events in quadrant A | 4,556,116 | 650,070 |
| Events in quadrant B | 4,247,055 | 655,023 |
| Events in quadrant C | 4,299,667 | 635,575 |
| Events in quadrant D | 4,930,204 | 621,885 |
| Mode SS | |||
|---|---|---|---|
| Quadrant | BADHDUFLAG | Total packets | Discarded packets |
| A | 0 | 184 | 0 |
| B | 0 | 184 | 0 |
| C | 0 | 184 | 0 |
| D | 0 | 184 | 0 |
| Mode M9 | |||
|---|---|---|---|
| Quadrant | BADHDUFLAG | Total packets | Discarded packets |
| A | 0 | 7 | 0 |
| B | 0 | 7 | 0 |
| C | 0 | 7 | 0 |
| D | 0 | 7 | 0 |
| Mode M0 | |||
|---|---|---|---|
| Quadrant | BADHDUFLAG | Total packets | Discarded packets |
| A | 0 | 19501 | 2 |
| B | 0 | 18516 | 2 |
| C | 0 | 18593 | 2 |
| D | 0 | 20761 | 2 |
| Quadrant | Total seconds | Saturated seconds | Saturation percentage |
|---|---|---|---|
| A | 8971 | 207 | 2.307435% |
| B | 8971 | 234 | 2.608405% |
| C | 8972 | 251 | 2.797593% |
| D | 8972 | 391 | 4.358003% |
Noise dominated data is calculated using 1-second bins in cleaned event files. If a bin has >2000 counts, and if more than 50% of those come from <1% of pixels, then it is considered to be noise-dominated and hence unusable.
| Quadrant | # 1 sec bins | Bins with >0 counts | Bins with >2000 counts | High rate bins dominated by noise | Noise dominated (total time) | Noise dominated (detector-on time) | Marked lightcurve |
|---|---|---|---|---|---|---|---|
| A | 9726 | 8972 | 0 | 0 | 0.00% | 0.00% | 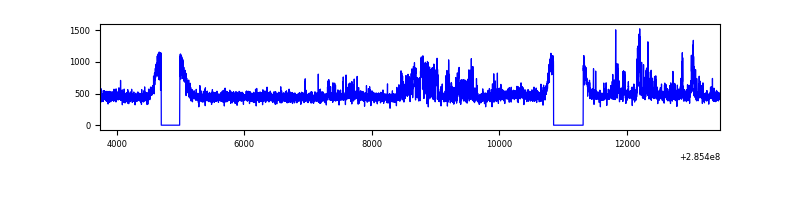 |
| B | 9726 | 8971 | 0 | 0 | 0.00% | 0.00% | 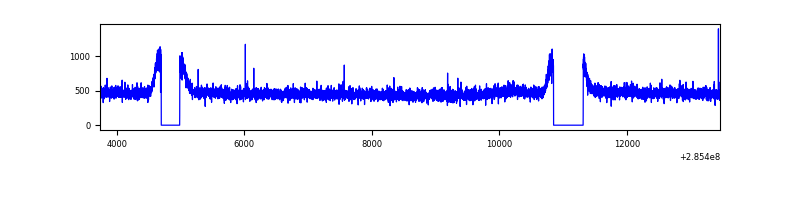 |
| C | 9727 | 8972 | 0 | 0 | 0.00% | 0.00% | 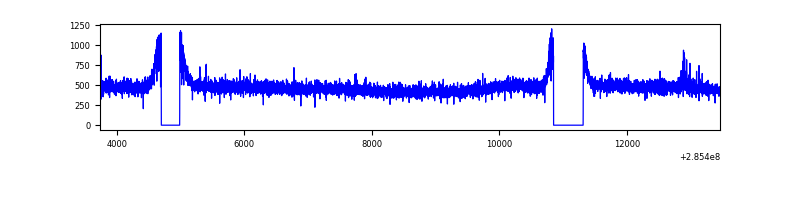 |
| D | 9727 | 8974 | 172 | 172 | 1.77% | 1.92% | 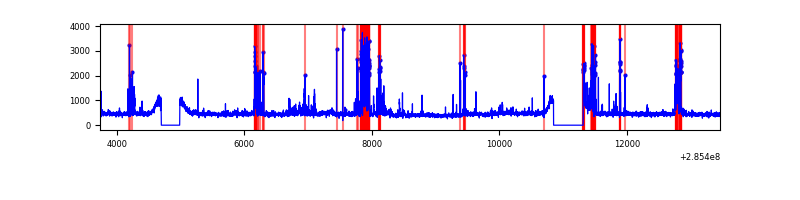 |
Top three noisy pixels from each quadrant. If the there are fewer than three noisy pixels in the level2.evt file, extra rows are filled as -1
| Pixel properties | Quadrant properties | ||||||
|---|---|---|---|---|---|---|---|
| Quadrant | DetID | PixID | Counts | Sigma | Mean | Median | Sigma |
| A | 6 | 16 | 386133 | 1744.04 | 1083 | 1056 | 220.8 |
| A | 15 | 174 | 9580 | 38.6 | 1083 | 1056 | 220.8 |
| A | 0 | 226 | 9472 | 38.11 | 1083 | 1056 | 220.8 |
| B | 12 | 111 | 26430 | 119.9 | 1082 | 1053 | 211.7 |
| B | 11 | 111 | 22869 | 103.07 | 1082 | 1053 | 211.7 |
| B | 14 | 111 | 19694 | 88.07 | 1082 | 1053 | 211.7 |
| C | 14 | 238 | 158241 | 635.67 | 1047 | 1052 | 247.3 |
| C | 5 | 218 | 27643 | 107.53 | 1047 | 1052 | 247.3 |
| C | 7 | 220 | 14452 | 54.19 | 1047 | 1052 | 247.3 |
| D | 7 | 238 | 740218 | 2847.31 | 1054 | 1022 | 259.6 |
| D | 12 | 110 | 78448 | 298.24 | 1054 | 1022 | 259.6 |
| D | 2 | 152 | 51883 | 195.91 | 1054 | 1022 | 259.6 |
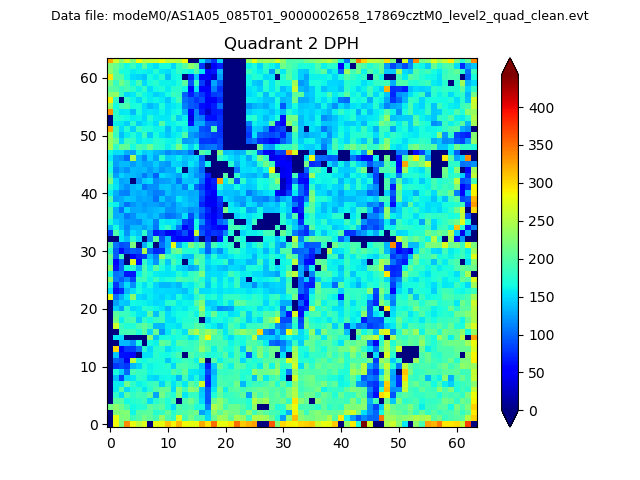
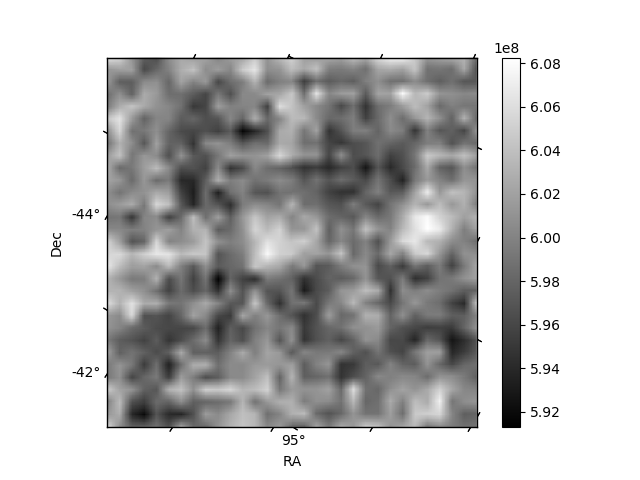
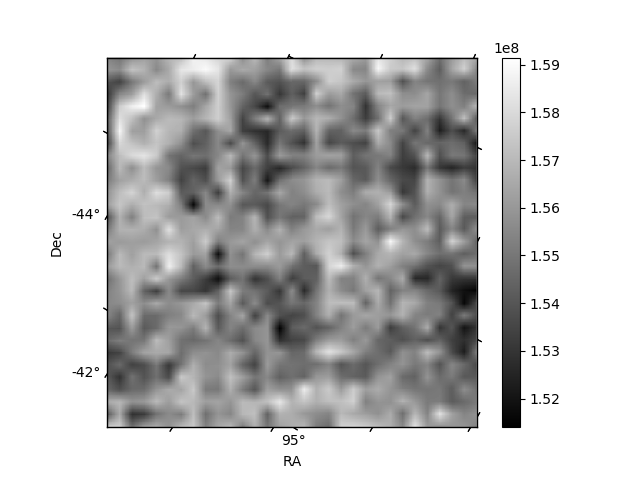
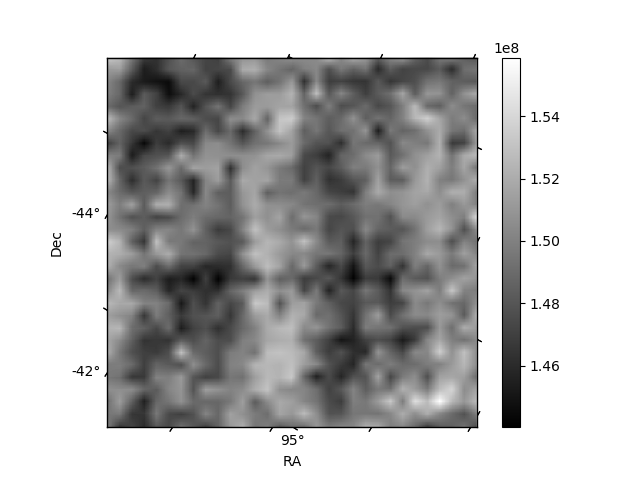
Histogram calculated using DETX and DETY for each event in the final _common_clean file
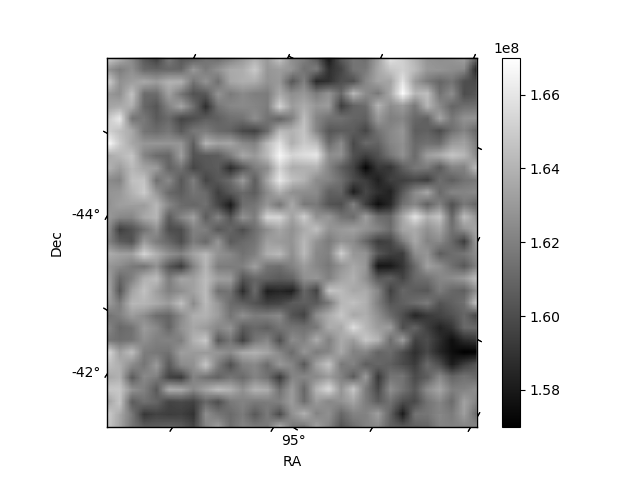
| Quadrant A | 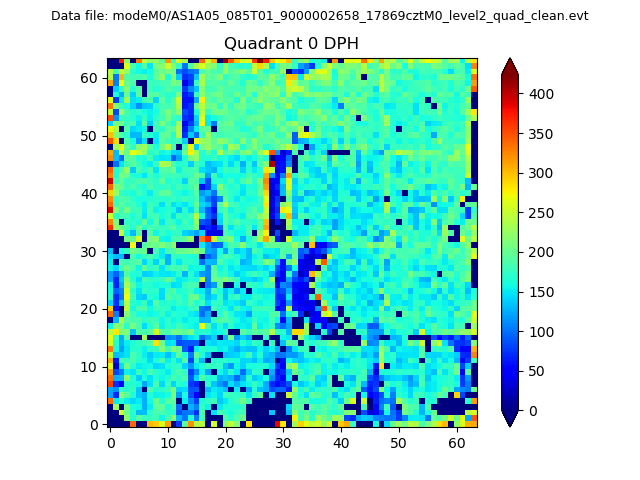 |
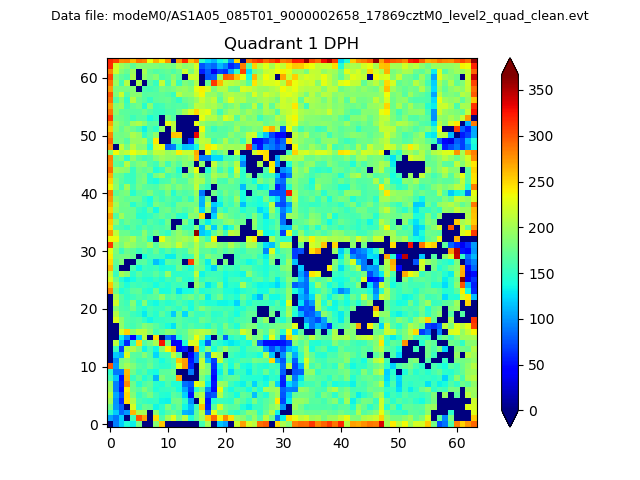 |
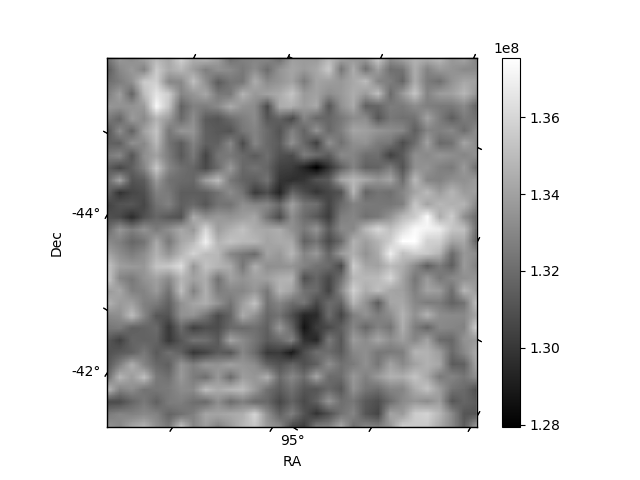
Quadrant B |
|---|---|---|---|
| Quadrant D | 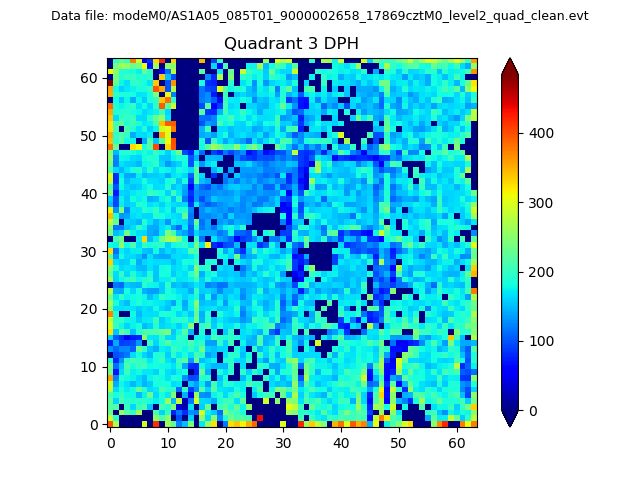 |
 |
Quadrant C |
| Plot type | Count rate plots | Images |
|---|---|---|
| Comparison with Poisson distribution Blue bars denote a histogram of data divided into 1 sec bins. Red curve is a Poisson curve with rate = median count rate of data. |
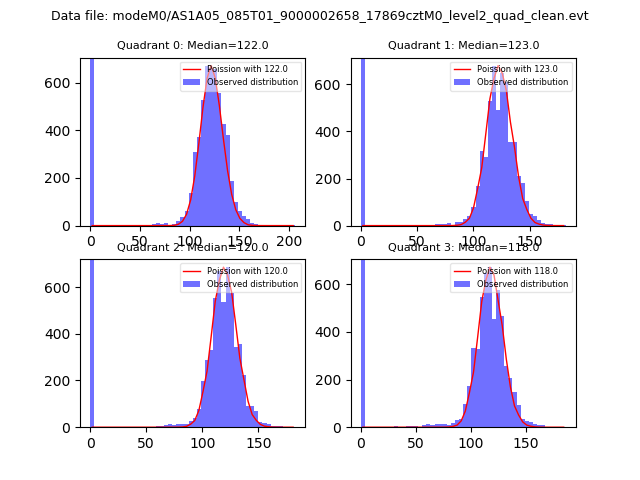 |
 |
| Quadrant-wise count rates Data is divided into 100 sec bins |
 |
|
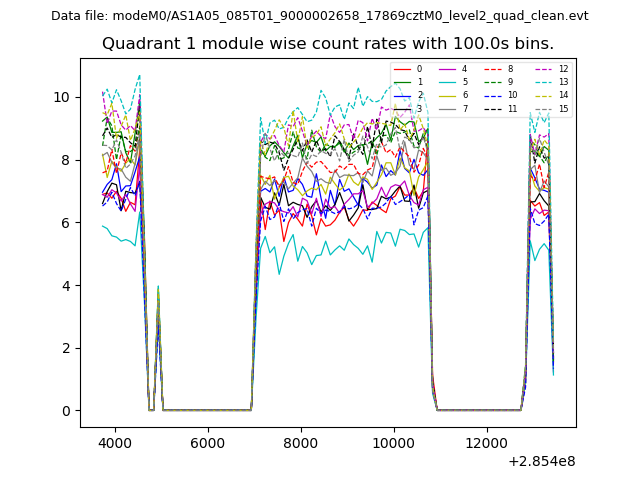
| Module-wise count rates for Quadrant A Data is divided into 100 sec bins |
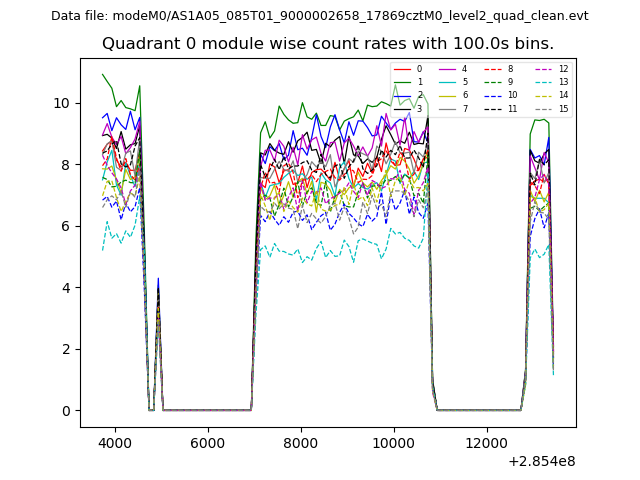 |
 |
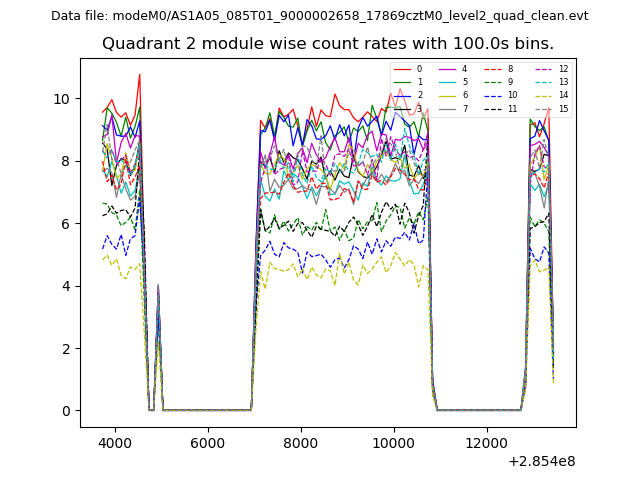
| Module-wise count rates for Quadrant B Data is divided into 100 sec bins |
 |
 |
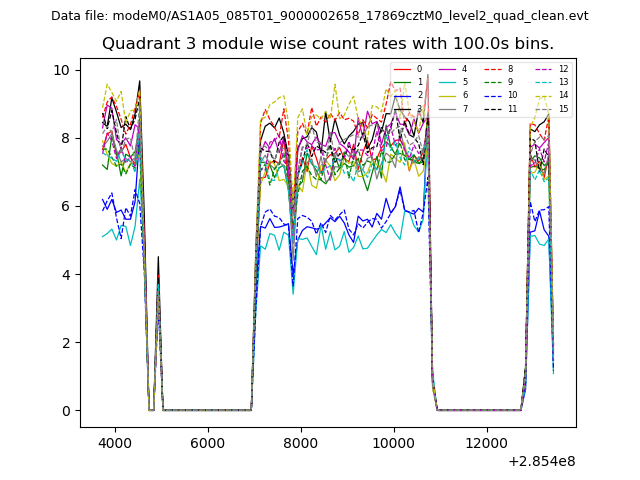
| Module-wise count rates for Quadrant C Data is divided into 100 sec bins |
 |
 |
| Module-wise count rates for Quadrant D Data is divided into 100 sec bins |
 |
 |
| Parameter | Plot |
|---|---|
| CZT HV Monitor | 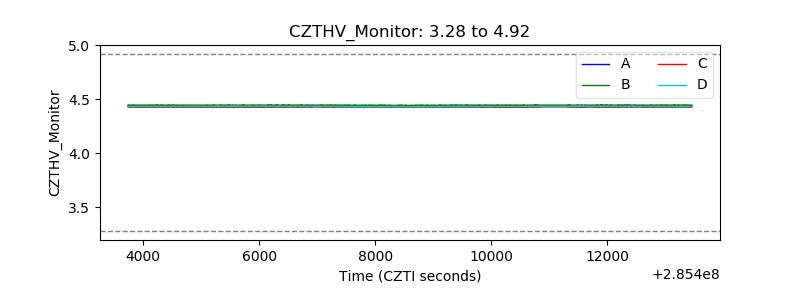 |
| D_VDD | 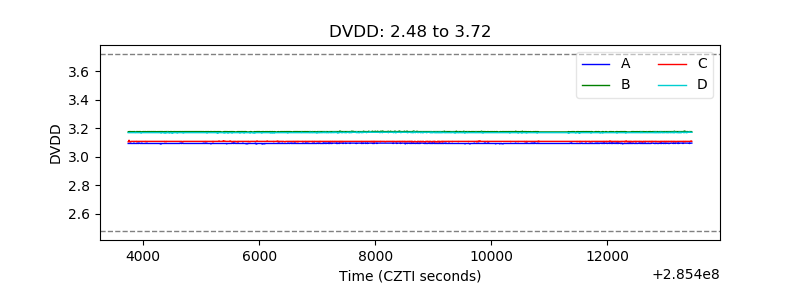 |
| Temperature 1 | 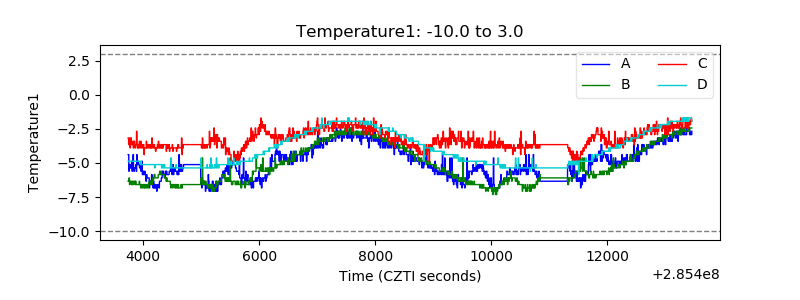 |
| Veto HV Monitor | 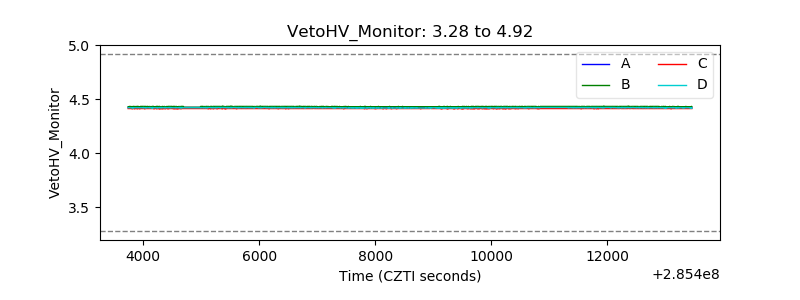 |
| Veto LLD | 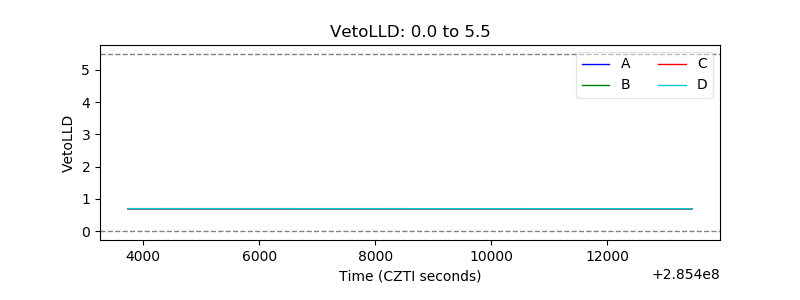 |
| Alpha Counter | 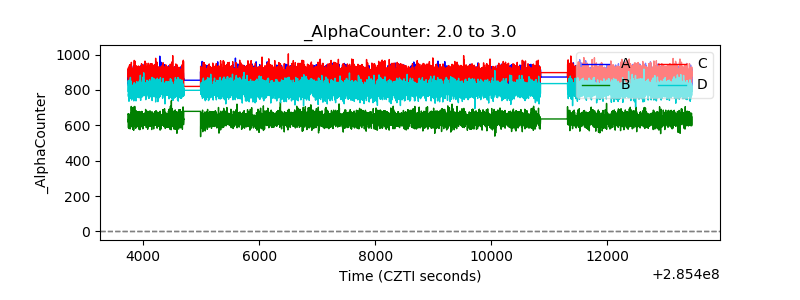 |
| _CPM_Rate | 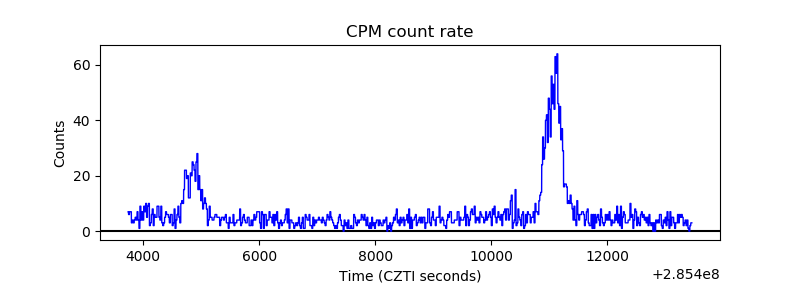 |
| CZT Counter | 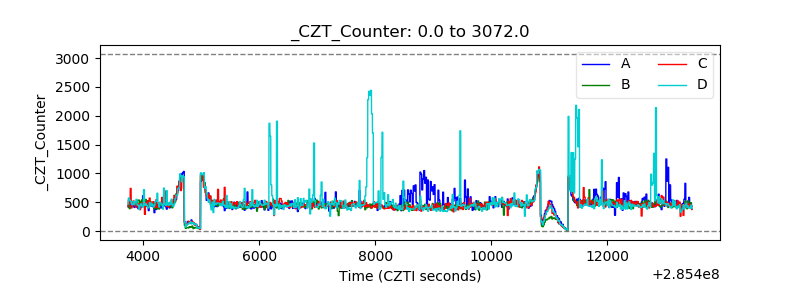 |
| +2.5 Volts monitor |  |
| +5 Volts monitor | 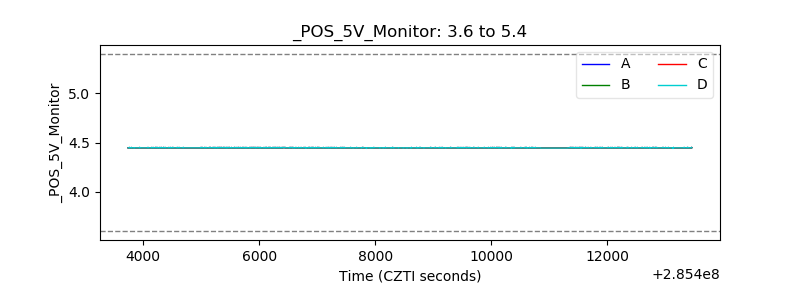 |
| _ROLL_ROT | 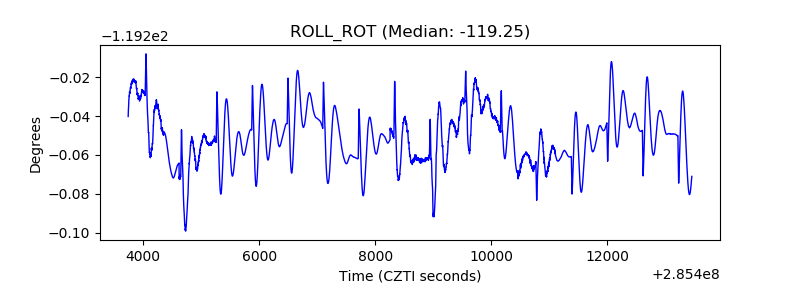 |
| _Roll_DEC | 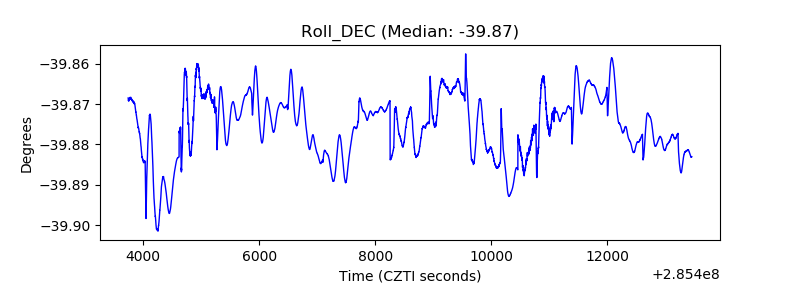 |
| _Roll_RA | 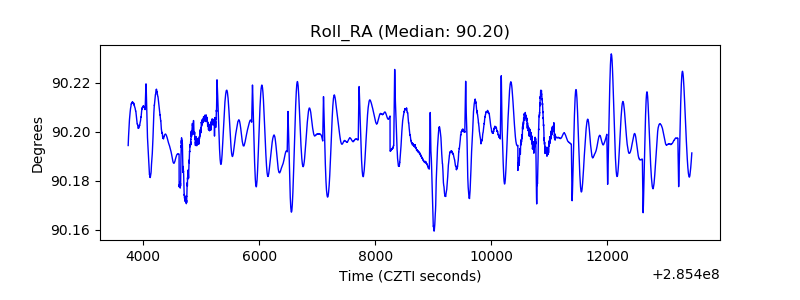 |
| Veto Counter | 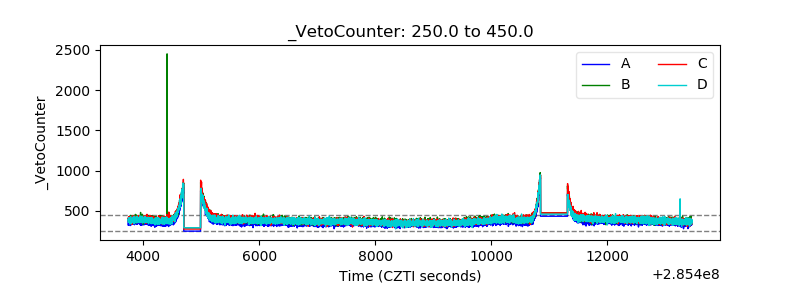 |