| Param | Original file | Final file |
|---|---|---|
| Filename | modeM0/AS1A05_085T01_9000002658_17870cztM0_level2.evt | modeM0/AS1A05_085T01_9000002658_17870cztM0_level2_quad_clean.evt |
| Size (bytes) | 666,483,840 | 149,978,880 |
| Size | 635.6 MB | 143.0 MB |
| Events in quadrant A | 4,841,472 | 968,843 |
| Events in quadrant B | 4,909,275 | 972,114 |
| Events in quadrant C | 4,878,201 | 941,415 |
| Events in quadrant D | 4,841,407 | 931,437 |
| Mode SS | |||
|---|---|---|---|
| Quadrant | BADHDUFLAG | Total packets | Discarded packets |
| A | 0 | 216 | 0 |
| B | 0 | 216 | 0 |
| C | 0 | 216 | 0 |
| D | 0 | 216 | 0 |
| Mode M9 | |||
|---|---|---|---|
| Quadrant | BADHDUFLAG | Total packets | Discarded packets |
| A | 0 | 15 | 0 |
| B | 0 | 15 | 0 |
| C | 0 | 15 | 0 |
| D | 0 | 15 | 0 |
| Mode M0 | |||
|---|---|---|---|
| Quadrant | BADHDUFLAG | Total packets | Discarded packets |
| A | 0 | 21429 | 2 |
| B | 0 | 21531 | 3 |
| C | 0 | 21527 | 2 |
| D | 0 | 21942 | 2 |
| Quadrant | Total seconds | Saturated seconds | Saturation percentage |
|---|---|---|---|
| A | 10517 | 113 | 1.074451% |
| B | 10517 | 137 | 1.302653% |
| C | 10517 | 142 | 1.350195% |
| D | 10517 | 99 | 0.941333% |
Noise dominated data is calculated using 1-second bins in cleaned event files. If a bin has >2000 counts, and if more than 50% of those come from <1% of pixels, then it is considered to be noise-dominated and hence unusable.
| Quadrant | # 1 sec bins | Bins with >0 counts | Bins with >2000 counts | High rate bins dominated by noise | Noise dominated (total time) | Noise dominated (detector-on time) | Marked lightcurve |
|---|---|---|---|---|---|---|---|
| A | 12027 | 10518 | 0 | 0 | 0.00% | 0.00% | 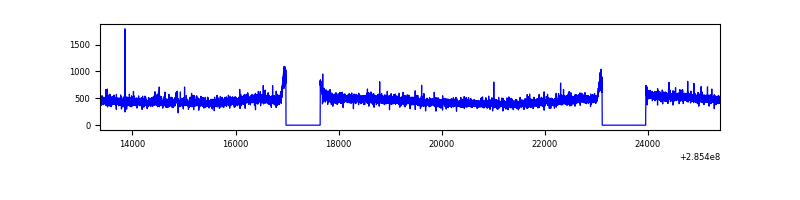 |
| B | 12027 | 10517 | 1 | 1 | 0.01% | 0.01% | 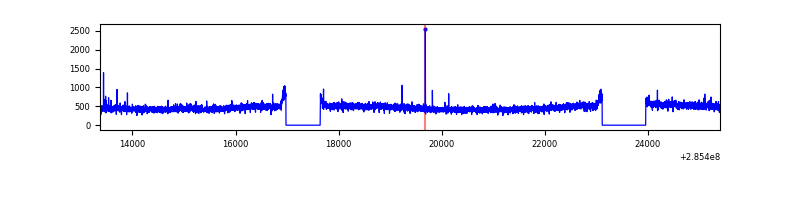 |
| C | 12027 | 10518 | 0 | 0 | 0.00% | 0.00% | 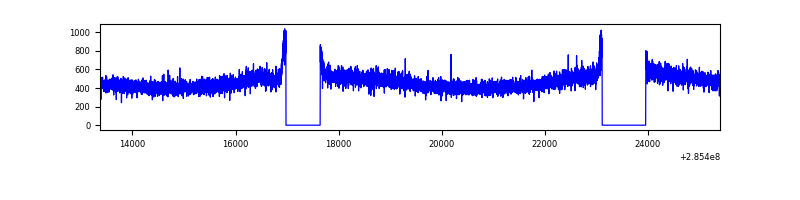 |
| D | 12027 | 10518 | 10 | 10 | 0.08% | 0.10% | 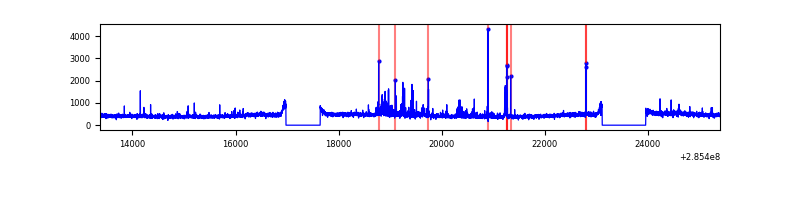 |
Top three noisy pixels from each quadrant. If the there are fewer than three noisy pixels in the level2.evt file, extra rows are filled as -1
| Pixel properties | Quadrant properties | ||||||
|---|---|---|---|---|---|---|---|
| Quadrant | DetID | PixID | Counts | Sigma | Mean | Median | Sigma |
| A | 6 | 16 | 37395 | 143.95 | 1249 | 1224 | 251.3 |
| A | 0 | 226 | 10542 | 37.08 | 1249 | 1224 | 251.3 |
| A | 3 | 137 | 9620 | 33.41 | 1249 | 1224 | 251.3 |
| B | 12 | 111 | 29373 | 117.16 | 1246 | 1212 | 240.4 |
| B | 11 | 111 | 25700 | 101.87 | 1246 | 1212 | 240.4 |
| B | 0 | 183 | 22902 | 90.23 | 1246 | 1212 | 240.4 |
| C | 14 | 238 | 182467 | 647.68 | 1192 | 1196 | 279.9 |
| C | 3 | 233 | 24861 | 84.55 | 1192 | 1196 | 279.9 |
| C | 5 | 218 | 24069 | 81.72 | 1192 | 1196 | 279.9 |
| D | 1 | 52 | 151656 | 509.15 | 1211 | 1174 | 295.6 |
| D | 2 | 234 | 46834 | 154.49 | 1211 | 1174 | 295.6 |
| D | 2 | 152 | 39990 | 131.33 | 1211 | 1174 | 295.6 |
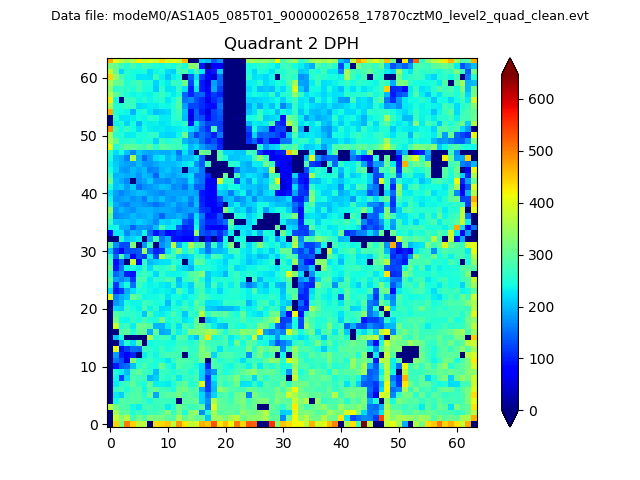
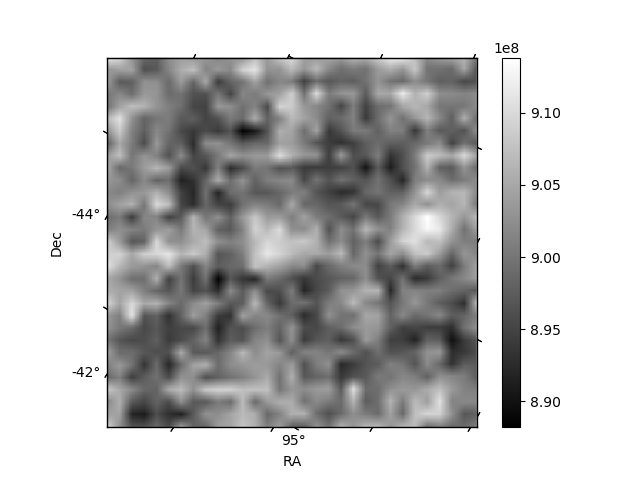
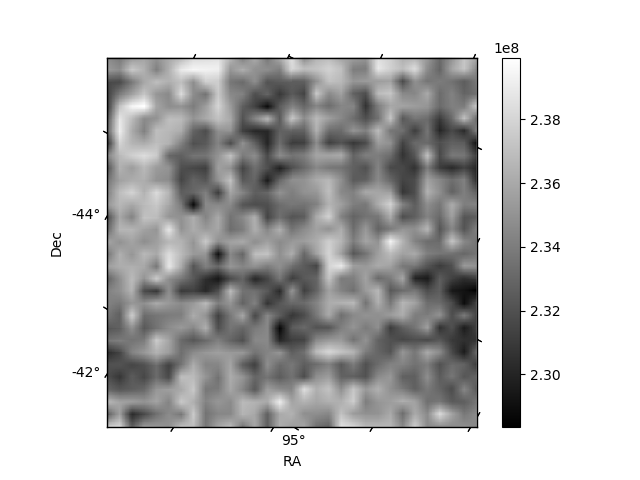
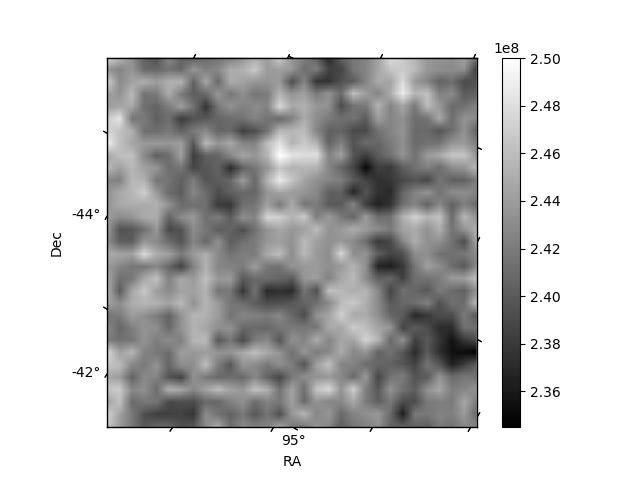
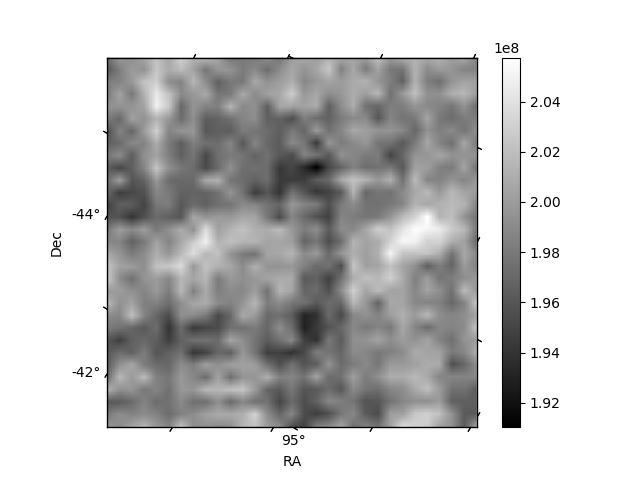
Histogram calculated using DETX and DETY for each event in the final _common_clean file
| Quadrant A | 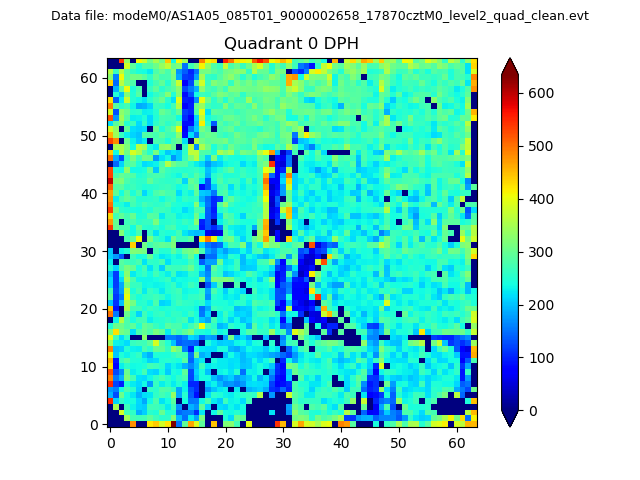 |
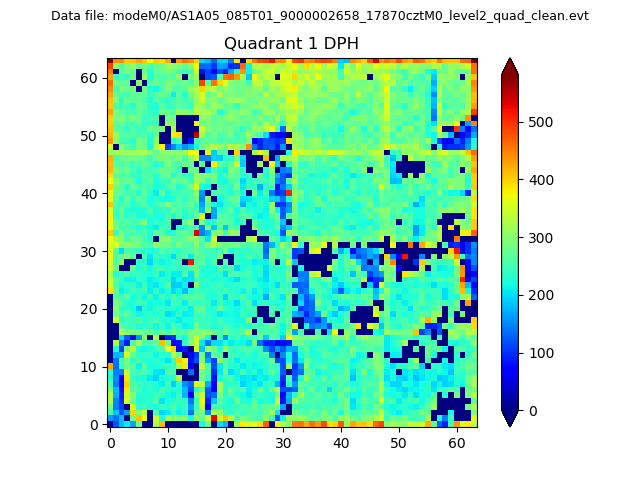 |
Quadrant B |
|---|---|---|---|
| Quadrant D | 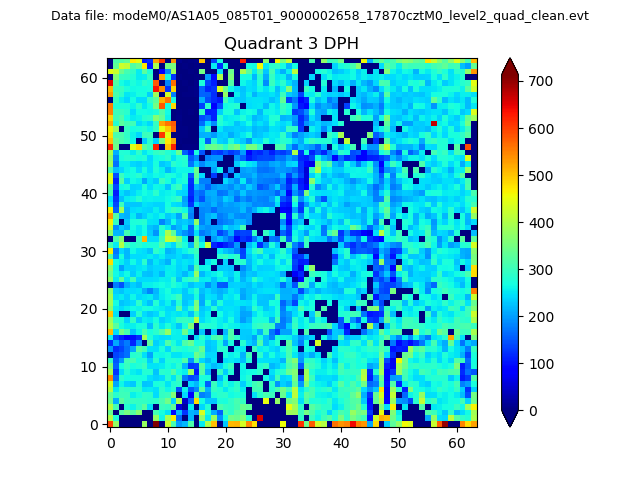 |
 |
Quadrant C |
| Plot type | Count rate plots | Images |
|---|---|---|
| Comparison with Poisson distribution Blue bars denote a histogram of data divided into 1 sec bins. Red curve is a Poisson curve with rate = median count rate of data. |
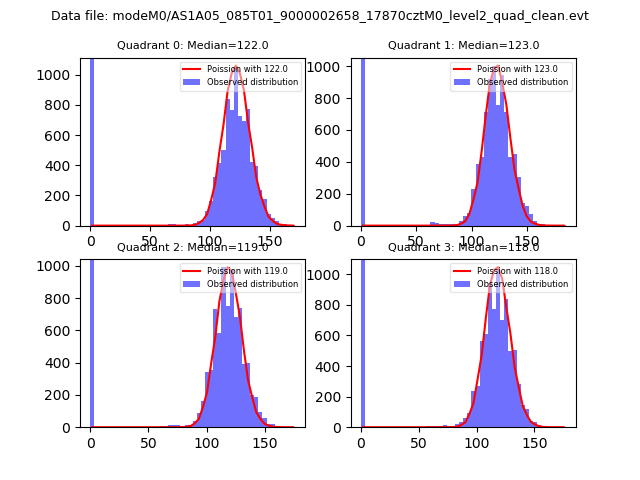 |
 |
| Quadrant-wise count rates Data is divided into 100 sec bins |
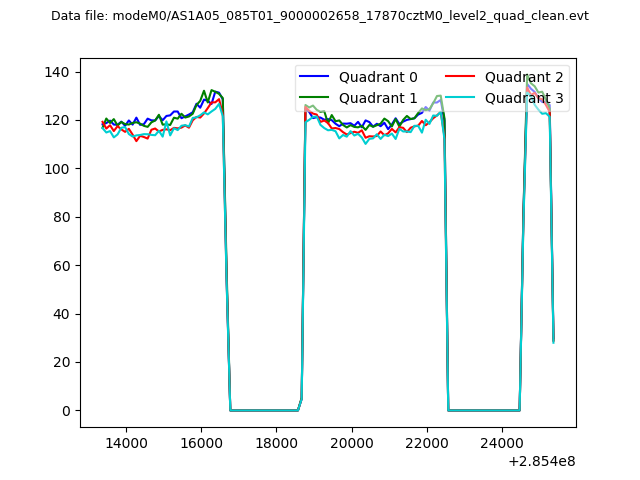 |
|
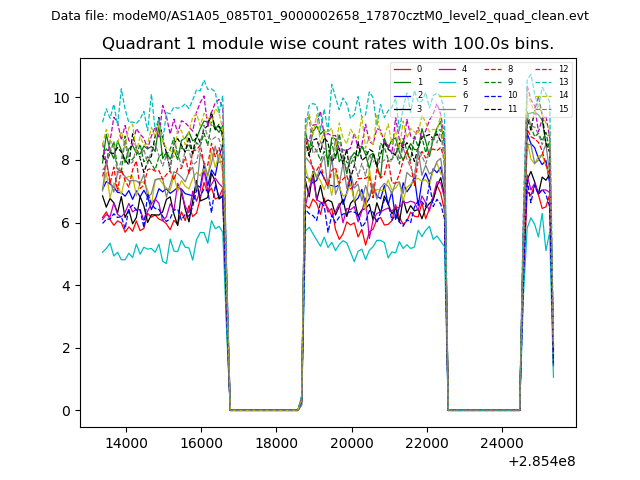
| Module-wise count rates for Quadrant A Data is divided into 100 sec bins |
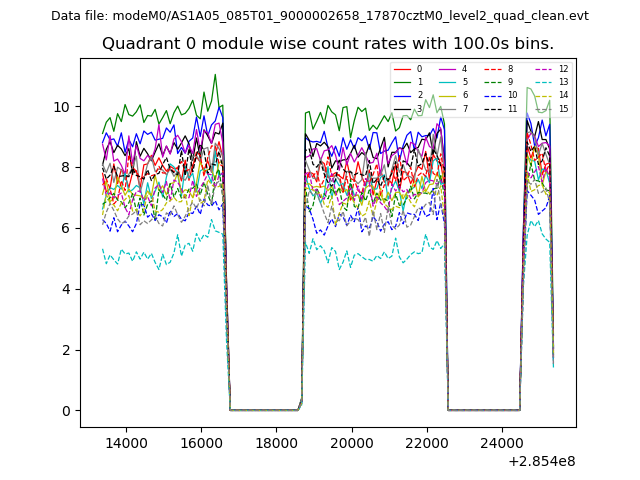 |
 |
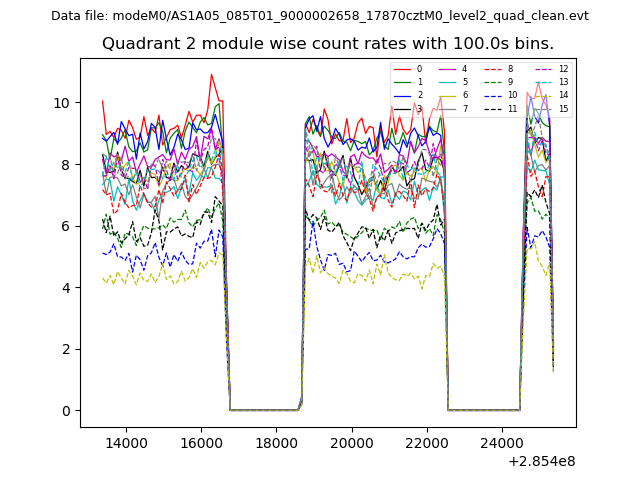
| Module-wise count rates for Quadrant B Data is divided into 100 sec bins |
 |
 |
| Module-wise count rates for Quadrant C Data is divided into 100 sec bins |
 |
 |
| Module-wise count rates for Quadrant D Data is divided into 100 sec bins |
 |
 |
| Parameter | Plot |
|---|---|
| CZT HV Monitor | 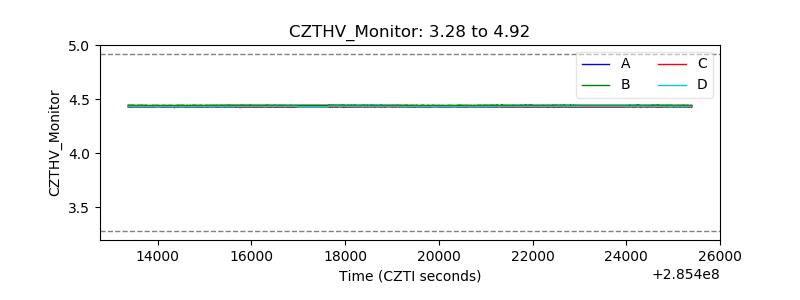 |
| D_VDD | 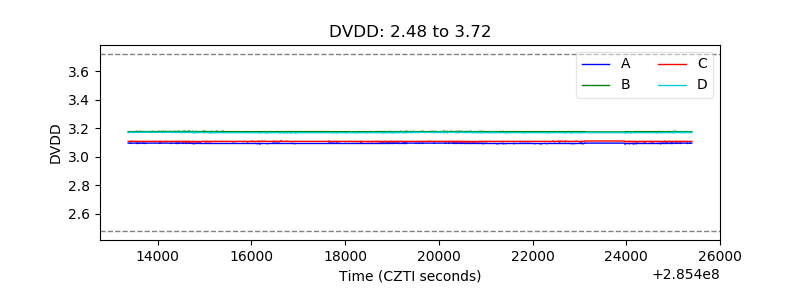 |
| Temperature 1 | 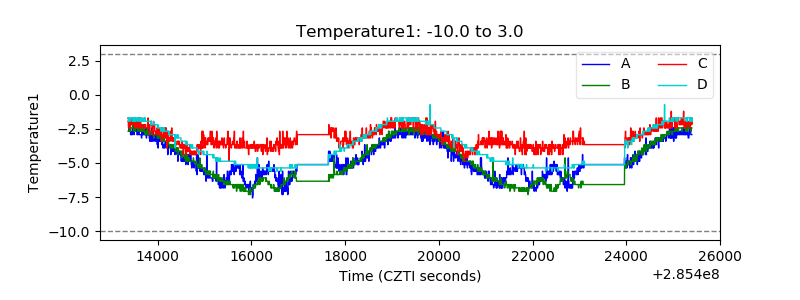 |
| Veto HV Monitor | 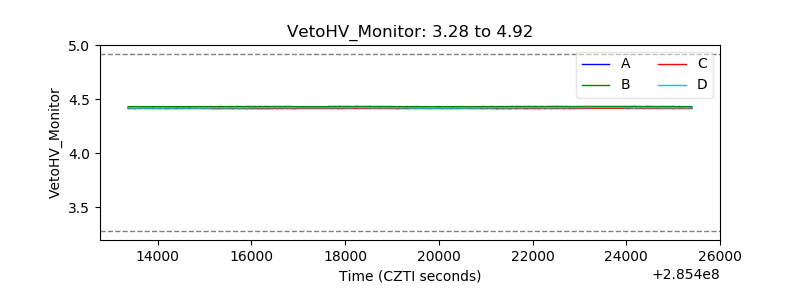 |
| Veto LLD | 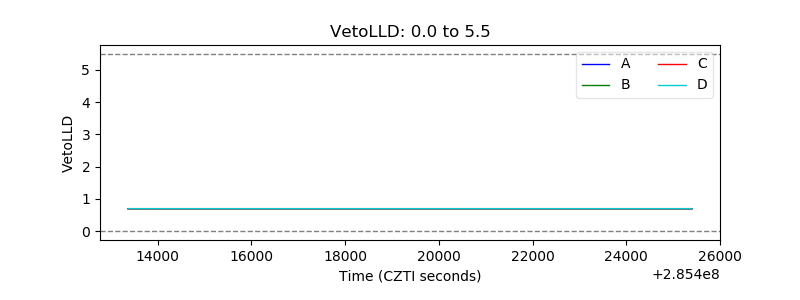 |
| Alpha Counter |  |
| _CPM_Rate | 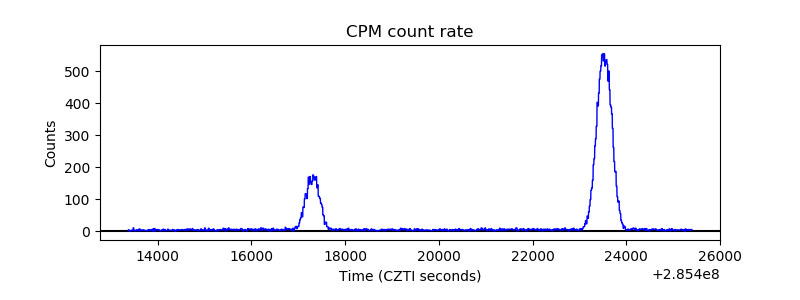 |
| CZT Counter | 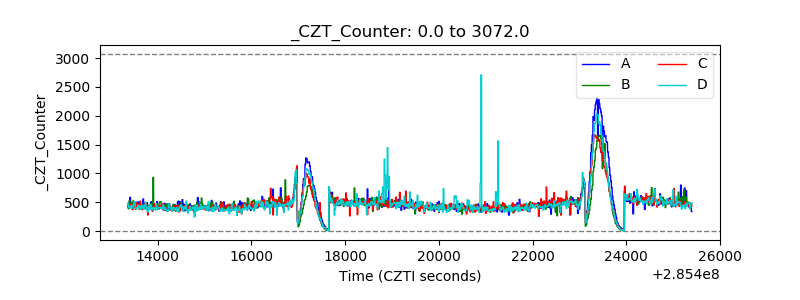 |
| +2.5 Volts monitor |  |
| +5 Volts monitor |  |
| _ROLL_ROT |  |
| _Roll_DEC | 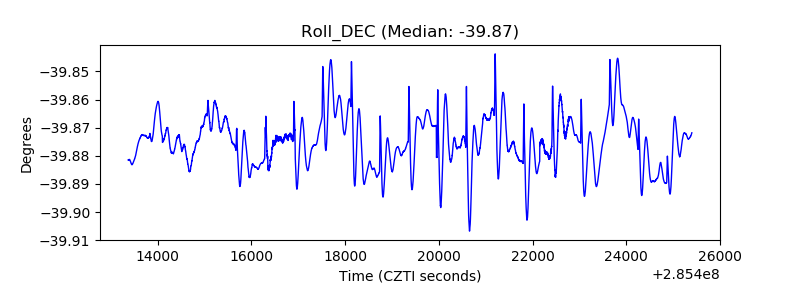 |
| _Roll_RA | 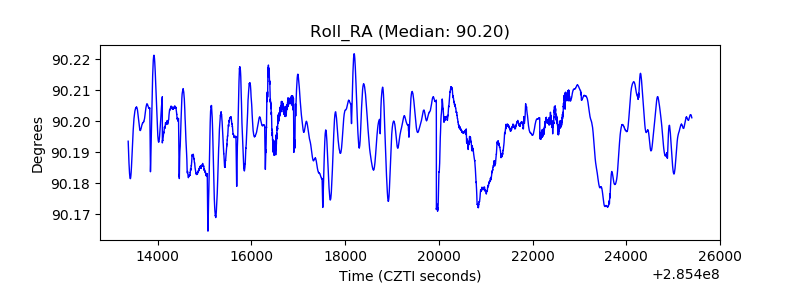 |
| Veto Counter | 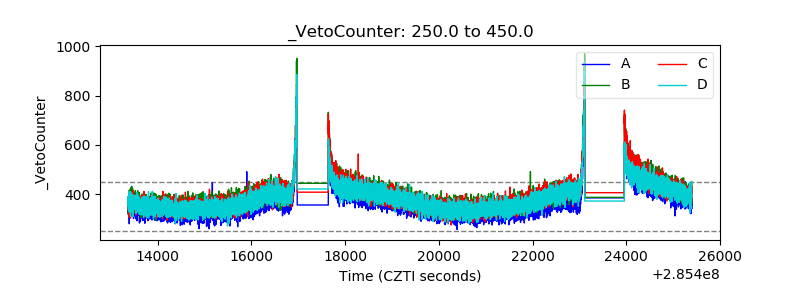 |