| Param | Original file | Final file |
|---|---|---|
| Filename | modeM0/AS1A05_085T01_9000002658_17873cztM0_level2.evt | modeM0/AS1A05_085T01_9000002658_17873cztM0_level2_quad_clean.evt |
| Size (bytes) | 462,876,480 | 109,716,480 |
| Size | 441.4 MB | 104.6 MB |
| Events in quadrant A | 3,159,297 | 741,320 |
| Events in quadrant B | 3,231,907 | 743,693 |
| Events in quadrant C | 3,115,861 | 701,723 |
| Events in quadrant D | 4,067,508 | 680,858 |
| Mode SS | |||
|---|---|---|---|
| Quadrant | BADHDUFLAG | Total packets | Discarded packets |
| A | 0 | 134 | 0 |
| B | 0 | 134 | 0 |
| C | 0 | 134 | 0 |
| D | 0 | 134 | 0 |
| Mode M9 | |||
|---|---|---|---|
| Quadrant | BADHDUFLAG | Total packets | Discarded packets |
| A | 0 | 11 | 0 |
| B | 0 | 11 | 0 |
| C | 0 | 11 | 0 |
| D | 0 | 11 | 0 |
| Mode M0 | |||
|---|---|---|---|
| Quadrant | BADHDUFLAG | Total packets | Discarded packets |
| A | 0 | 13692 | 1 |
| B | 0 | 13978 | 1 |
| C | 0 | 13605 | 1 |
| D | 0 | 16785 | 1 |
| Quadrant | Total seconds | Saturated seconds | Saturation percentage |
|---|---|---|---|
| A | 6523 | 65 | 0.996474% |
| B | 6524 | 67 | 1.026977% |
| C | 6524 | 69 | 1.057633% |
| D | 6523 | 349 | 5.350299% |
Noise dominated data is calculated using 1-second bins in cleaned event files. If a bin has >2000 counts, and if more than 50% of those come from <1% of pixels, then it is considered to be noise-dominated and hence unusable.
| Quadrant | # 1 sec bins | Bins with >0 counts | Bins with >2000 counts | High rate bins dominated by noise | Noise dominated (total time) | Noise dominated (detector-on time) | Marked lightcurve |
|---|---|---|---|---|---|---|---|
| A | 7663 | 6523 | 0 | 0 | 0.00% | 0.00% | 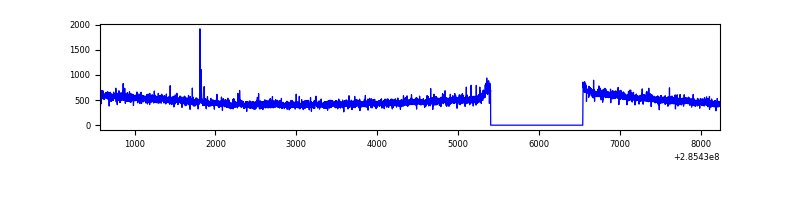 |
| B | 7664 | 6524 | 1 | 1 | 0.01% | 0.02% | 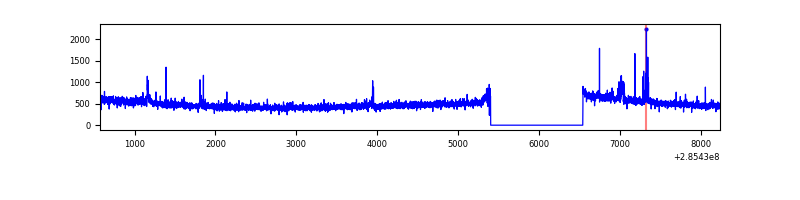 |
| C | 7664 | 6525 | 0 | 0 | 0.00% | 0.00% | 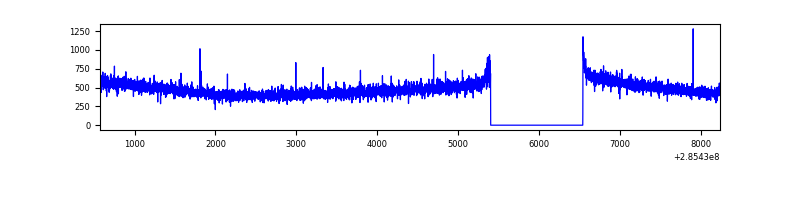 |
| D | 7663 | 6524 | 269 | 269 | 3.51% | 4.12% | 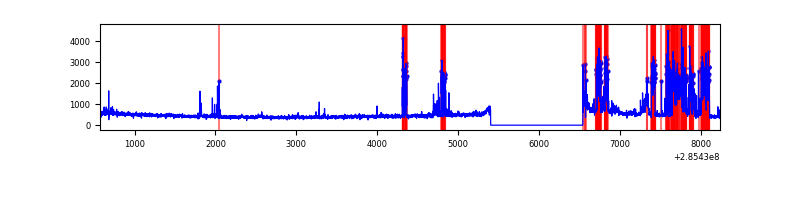 |
Top three noisy pixels from each quadrant. If the there are fewer than three noisy pixels in the level2.evt file, extra rows are filled as -1
| Pixel properties | Quadrant properties | ||||||
|---|---|---|---|---|---|---|---|
| Quadrant | DetID | PixID | Counts | Sigma | Mean | Median | Sigma |
| A | 6 | 16 | 44575 | 266.82 | 811 | 798 | 164.1 |
| A | 0 | 226 | 7232 | 39.22 | 811 | 798 | 164.1 |
| A | 3 | 137 | 6034 | 31.91 | 811 | 798 | 164.1 |
| B | 0 | 183 | 47792 | 308.86 | 805 | 785 | 152.2 |
| B | 0 | 190 | 18308 | 115.13 | 805 | 785 | 152.2 |
| B | 12 | 111 | 17975 | 112.95 | 805 | 785 | 152.2 |
| C | 14 | 238 | 120643 | 676.37 | 760 | 767 | 177.2 |
| C | 3 | 233 | 15058 | 80.63 | 760 | 767 | 177.2 |
| C | 5 | 218 | 13436 | 71.48 | 760 | 767 | 177.2 |
| D | 7 | 238 | 1154984 | 5939.37 | 759 | 740 | 194.3 |
| D | 2 | 234 | 32354 | 162.68 | 759 | 740 | 194.3 |
| D | 2 | 152 | 15833 | 77.66 | 759 | 740 | 194.3 |
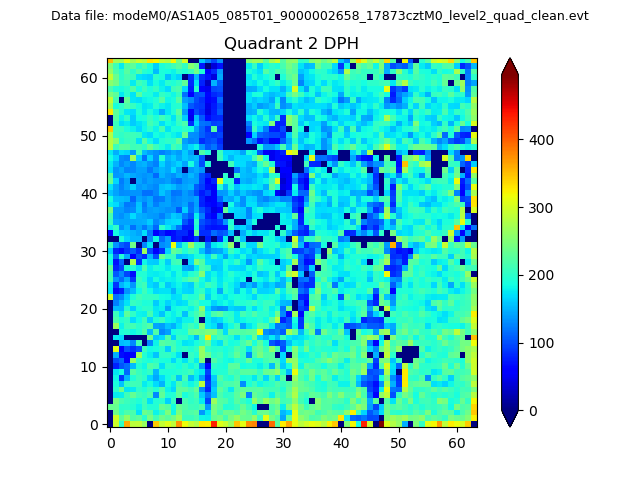
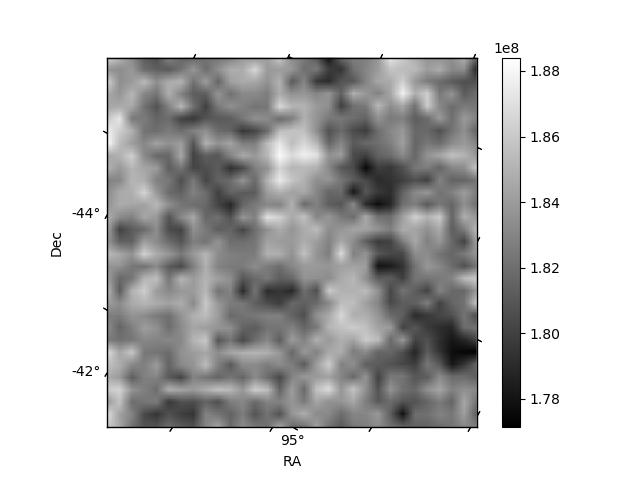
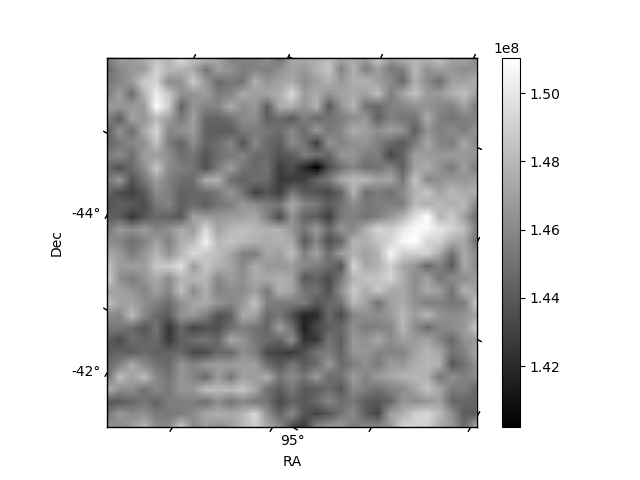
Histogram calculated using DETX and DETY for each event in the final _common_clean file
| Quadrant A | 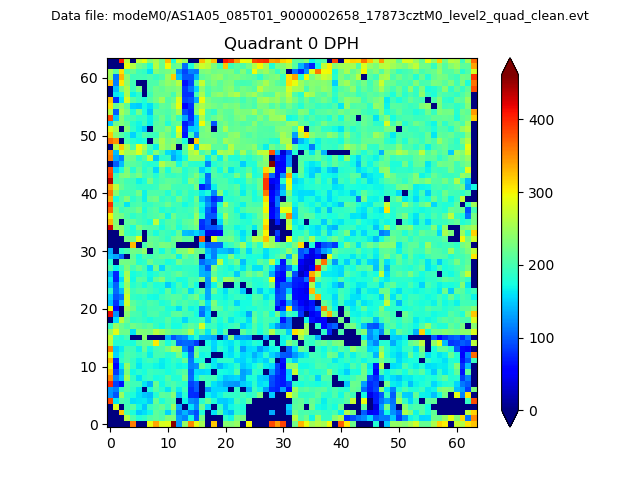 |
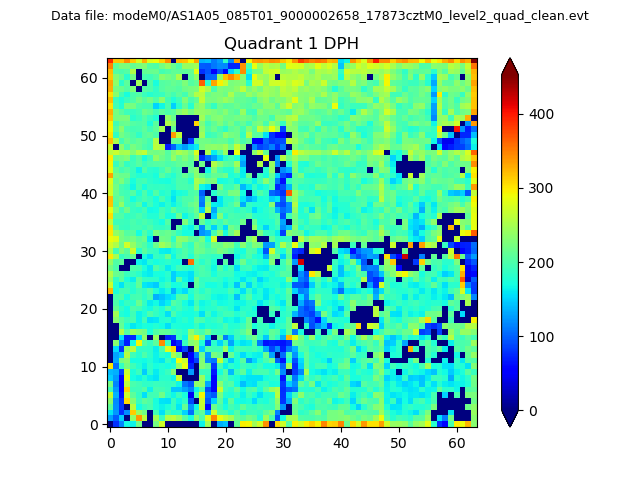 |
Quadrant B |
|---|---|---|---|
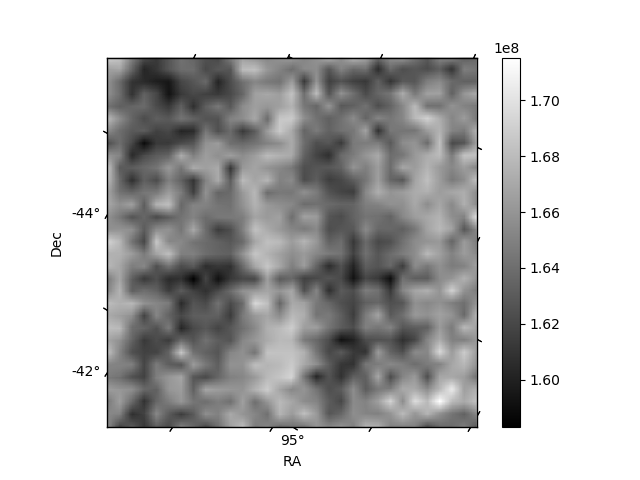
| Quadrant D | 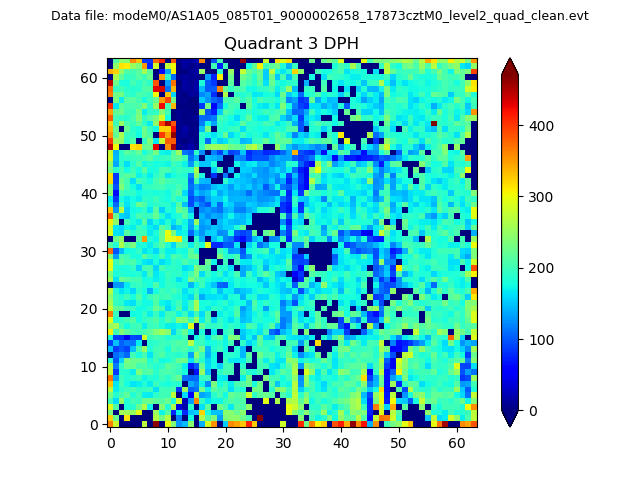 |
 |
Quadrant C |
| Plot type | Count rate plots | Images |
|---|---|---|
| Comparison with Poisson distribution Blue bars denote a histogram of data divided into 1 sec bins. Red curve is a Poisson curve with rate = median count rate of data. |
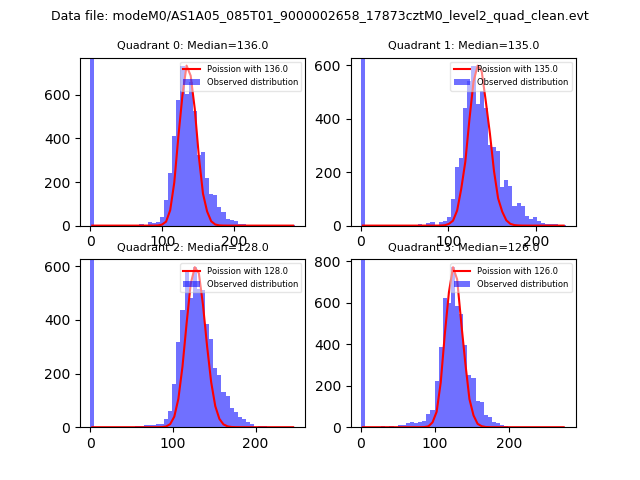 |
 |
| Quadrant-wise count rates Data is divided into 100 sec bins |
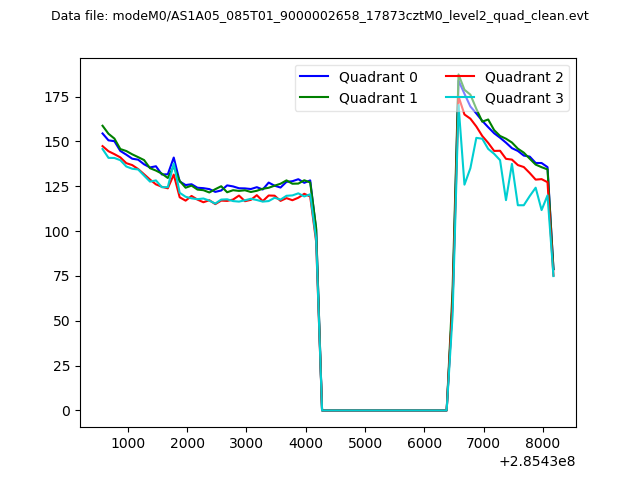 |
|
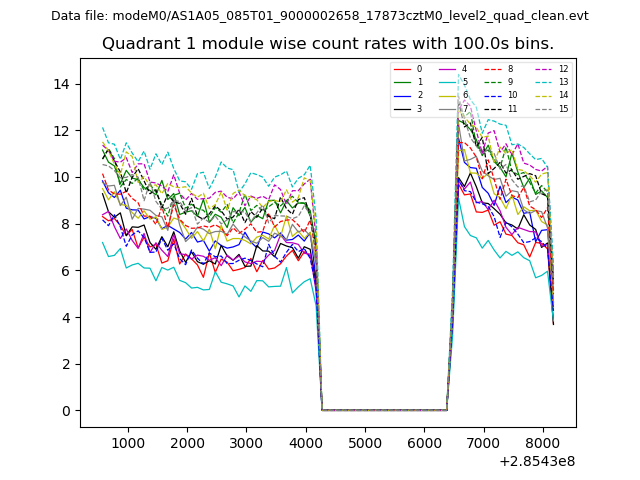
| Module-wise count rates for Quadrant A Data is divided into 100 sec bins |
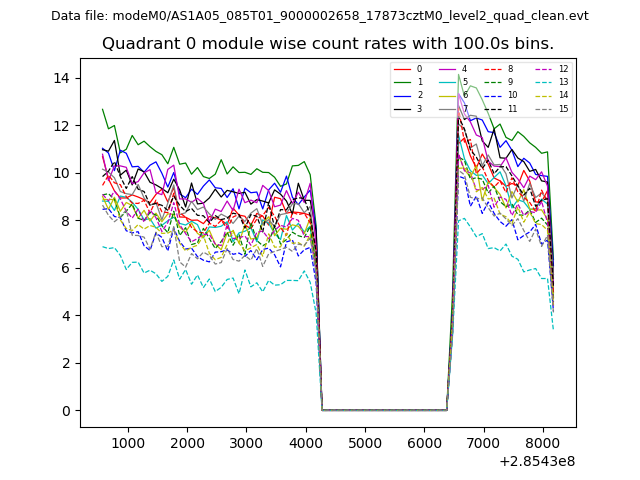 |
 |
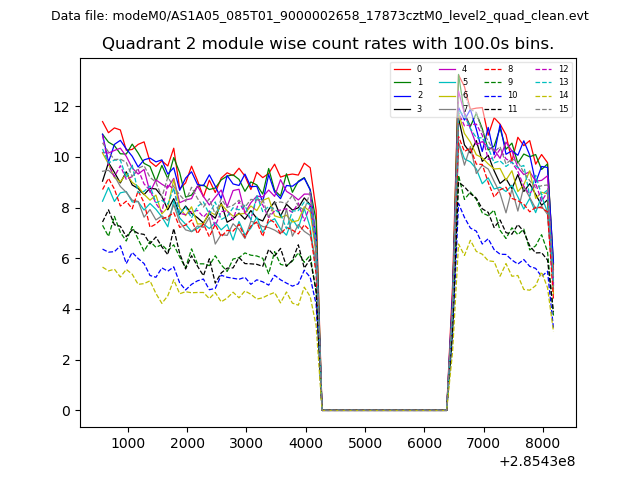
| Module-wise count rates for Quadrant B Data is divided into 100 sec bins |
 |
 |
| Module-wise count rates for Quadrant C Data is divided into 100 sec bins |
 |
 |
| Module-wise count rates for Quadrant D Data is divided into 100 sec bins |
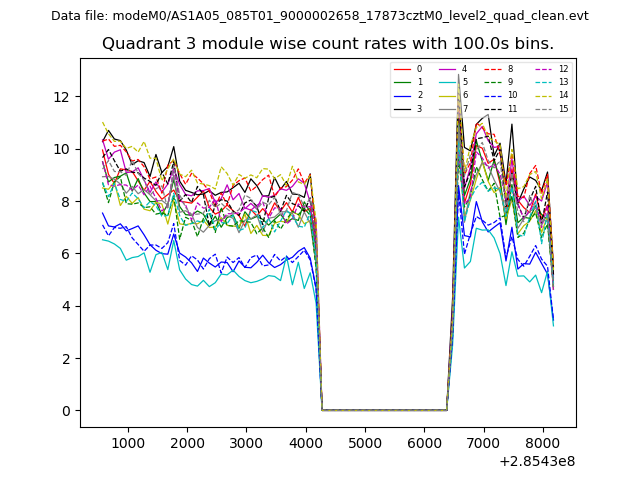 |
 |
| Parameter | Plot |
|---|---|
| CZT HV Monitor | 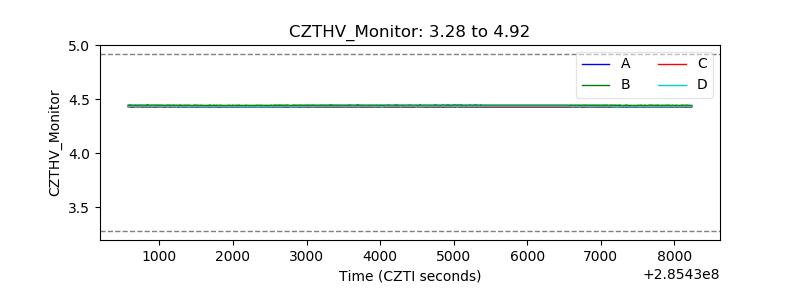 |
| D_VDD | 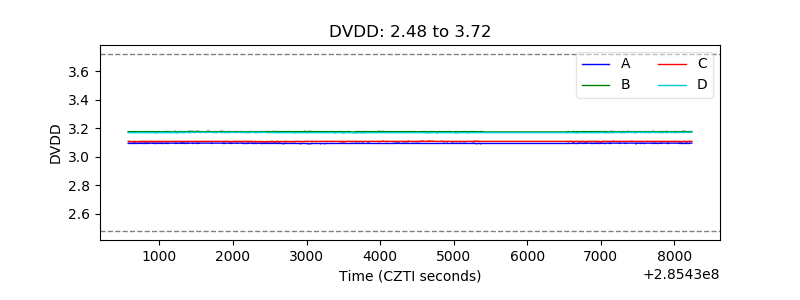 |
| Temperature 1 | 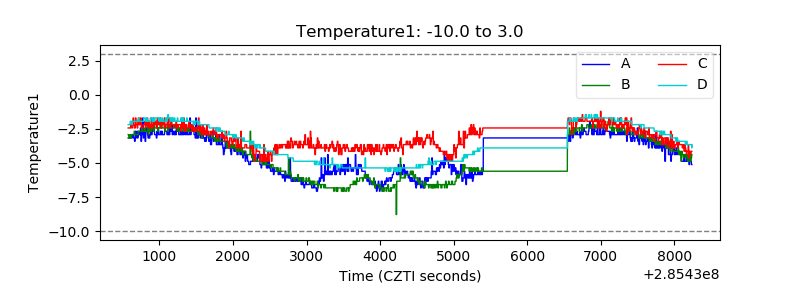 |
| Veto HV Monitor | 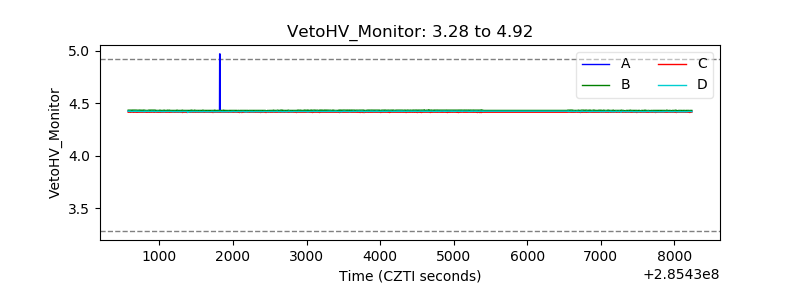 |
| Veto LLD | 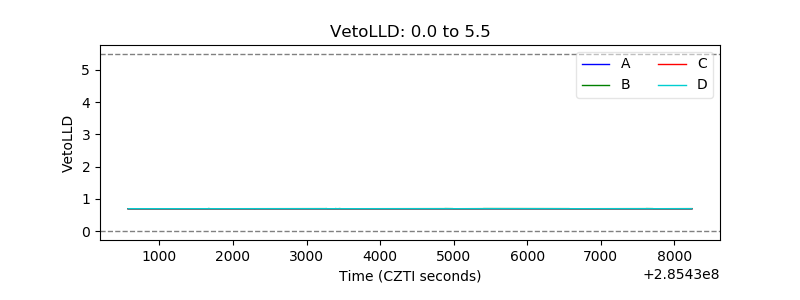 |
| Alpha Counter | 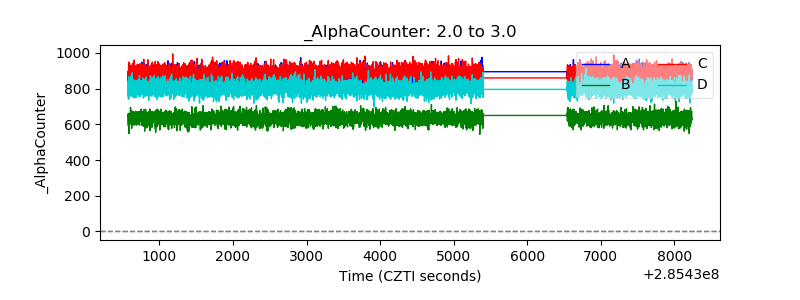 |
| _CPM_Rate | 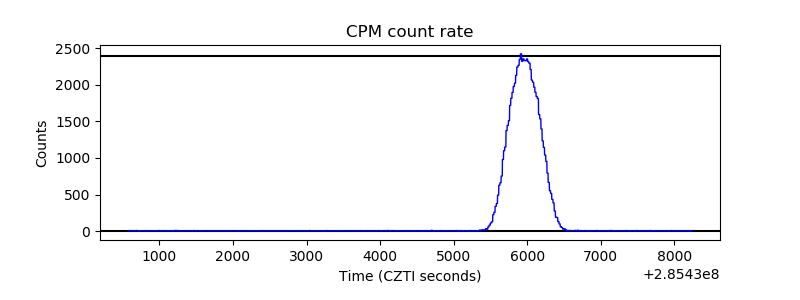 |
| CZT Counter | 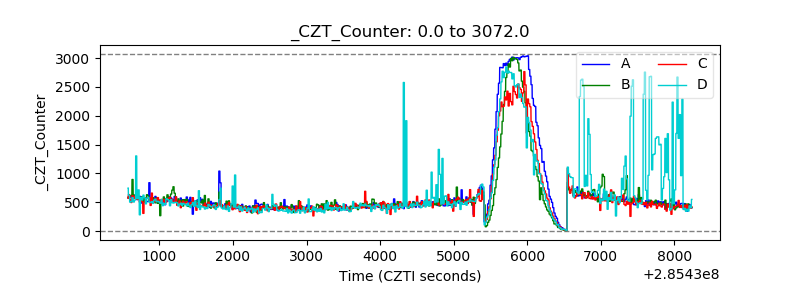 |
| +2.5 Volts monitor |  |
| +5 Volts monitor |  |
| _ROLL_ROT | 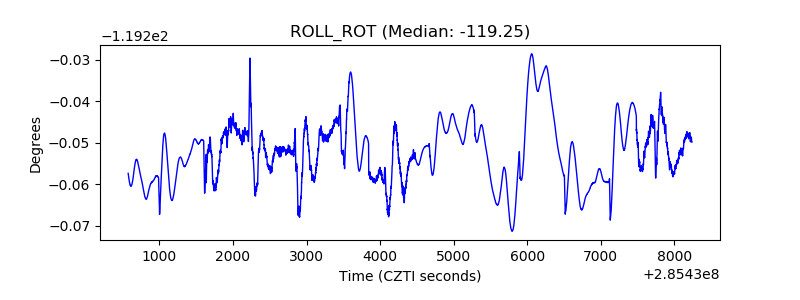 |
| _Roll_DEC | 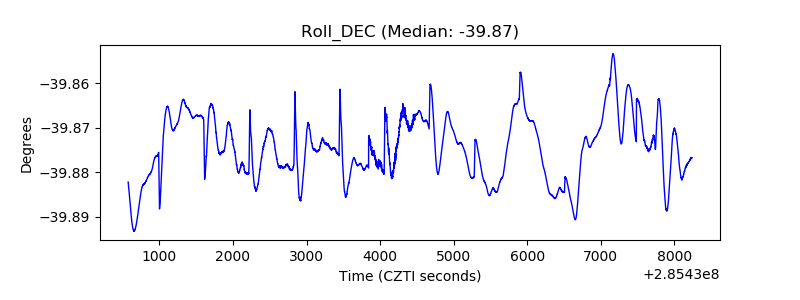 |
| _Roll_RA | 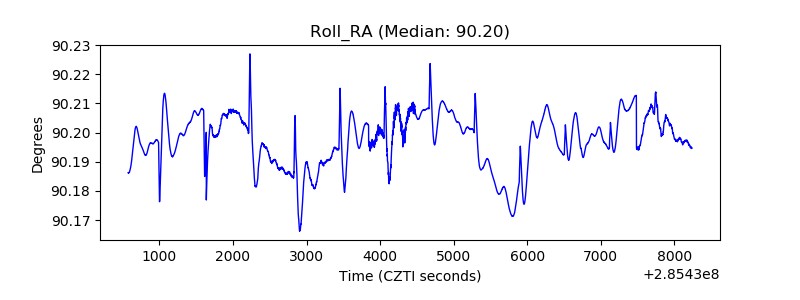 |
| Veto Counter | 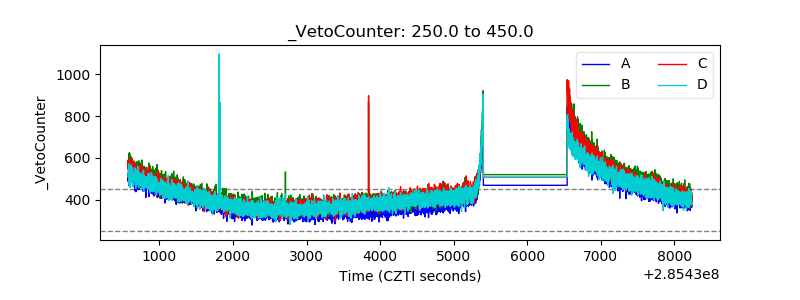 |