| Param | Original file | Final file |
|---|---|---|
| Filename | modeM0/AS1A05_085T01_9000002658_17875cztM0_level2.evt | modeM0/AS1A05_085T01_9000002658_17875cztM0_level2_quad_clean.evt |
| Size (bytes) | 134,064,000 | 42,848,640 |
| Size | 127.9 MB | 40.9 MB |
| Events in quadrant A | 980,642 | 297,176 |
| Events in quadrant B | 1,057,974 | 303,192 |
| Events in quadrant C | 962,724 | 282,104 |
| Events in quadrant D | 925,687 | 274,955 |
| Mode SS | |||
|---|---|---|---|
| Quadrant | BADHDUFLAG | Total packets | Discarded packets |
| A | 0 | 38 | 0 |
| B | 0 | 38 | 0 |
| C | 0 | 38 | 0 |
| D | 0 | 38 | 0 |
| Mode M0 | |||
|---|---|---|---|
| Quadrant | BADHDUFLAG | Total packets | Discarded packets |
| A | 0 | 4181 | 1 |
| B | 0 | 4388 | 1 |
| C | 0 | 4114 | 1 |
| D | 0 | 4071 | 1 |
| Quadrant | Total seconds | Saturated seconds | Saturation percentage |
|---|---|---|---|
| A | 1919 | 3 | 0.156331% |
| B | 1920 | 10 | 0.520833% |
| C | 1920 | 5 | 0.260417% |
| D | 1920 | 2 | 0.104167% |
Noise dominated data is calculated using 1-second bins in cleaned event files. If a bin has >2000 counts, and if more than 50% of those come from <1% of pixels, then it is considered to be noise-dominated and hence unusable.
| Quadrant | # 1 sec bins | Bins with >0 counts | Bins with >2000 counts | High rate bins dominated by noise | Noise dominated (total time) | Noise dominated (detector-on time) | Marked lightcurve |
|---|---|---|---|---|---|---|---|
| A | 1919 | 1919 | 0 | 0 | 0.00% | 0.00% |  |
| B | 1920 | 1920 | 1 | 1 | 0.05% | 0.05% | 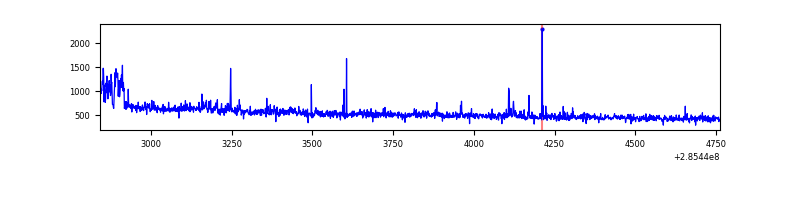 |
| C | 1920 | 1920 | 0 | 0 | 0.00% | 0.00% | 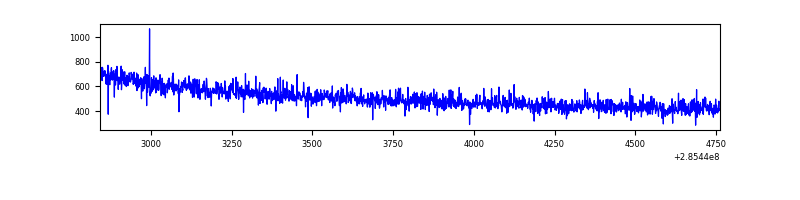 |
| D | 1920 | 1920 | 2 | 2 | 0.10% | 0.10% | 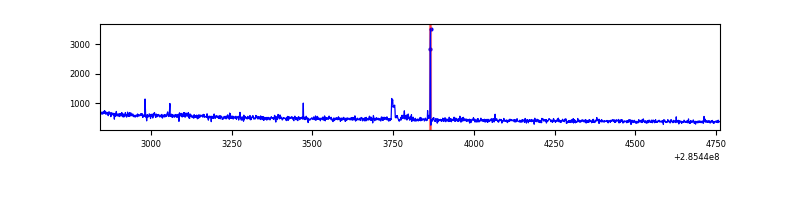 |
Top three noisy pixels from each quadrant. If the there are fewer than three noisy pixels in the level2.evt file, extra rows are filled as -1
| Pixel properties | Quadrant properties | ||||||
|---|---|---|---|---|---|---|---|
| Quadrant | DetID | PixID | Counts | Sigma | Mean | Median | Sigma |
| A | 0 | 226 | 2306 | 39.38 | 255 | 250 | 52.2 |
| A | 12 | 194 | 1841 | 30.47 | 255 | 250 | 52.2 |
| A | 3 | 137 | 1803 | 29.74 | 255 | 250 | 52.2 |
| B | 0 | 183 | 31586 | 626.24 | 255 | 250 | 50.0 |
| B | 4 | 171 | 8757 | 170.01 | 255 | 250 | 50.0 |
| B | 4 | 216 | 8250 | 159.88 | 255 | 250 | 50.0 |
| C | 14 | 238 | 37922 | 676.42 | 234 | 237 | 55.7 |
| C | 3 | 233 | 5184 | 88.8 | 234 | 237 | 55.7 |
| C | 9 | 160 | 1980 | 31.29 | 234 | 237 | 55.7 |
| D | 7 | 238 | 22055 | 353.04 | 235 | 228 | 61.8 |
| D | 2 | 234 | 8001 | 125.72 | 235 | 228 | 61.8 |
| D | 8 | 195 | 4415 | 67.72 | 235 | 228 | 61.8 |
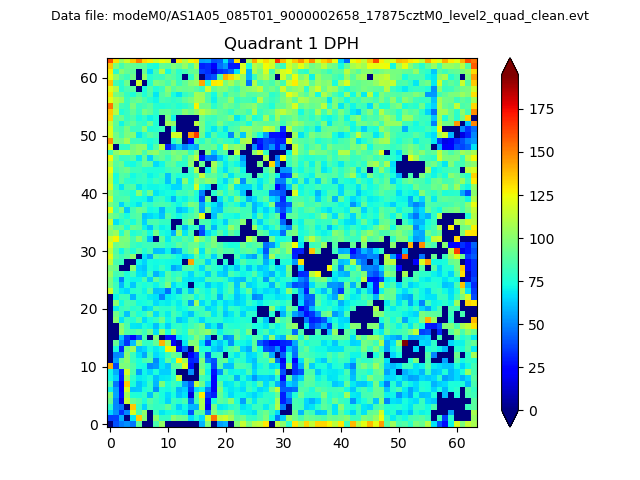
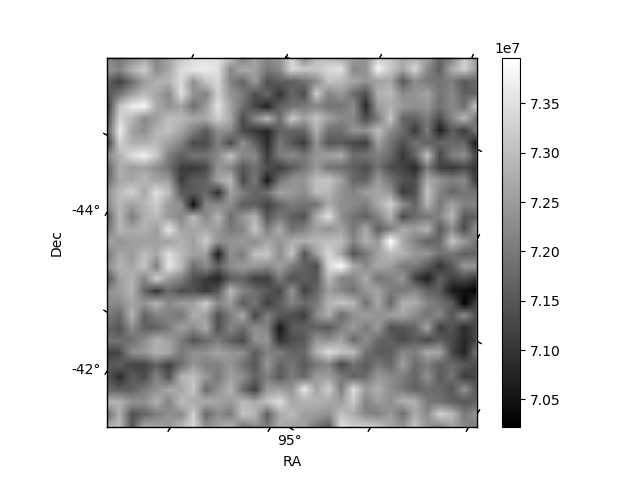
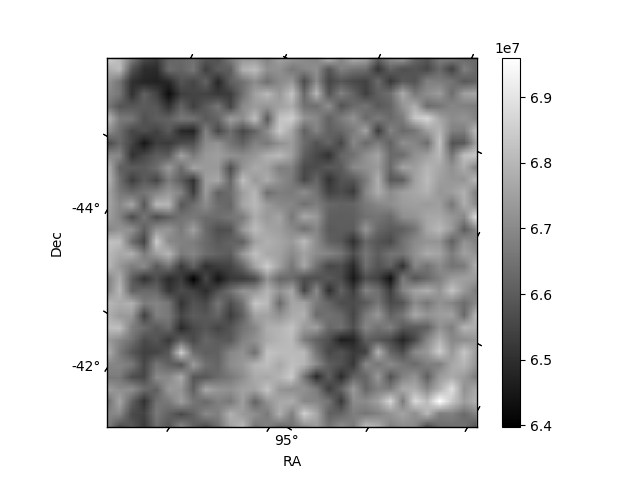
Histogram calculated using DETX and DETY for each event in the final _common_clean file
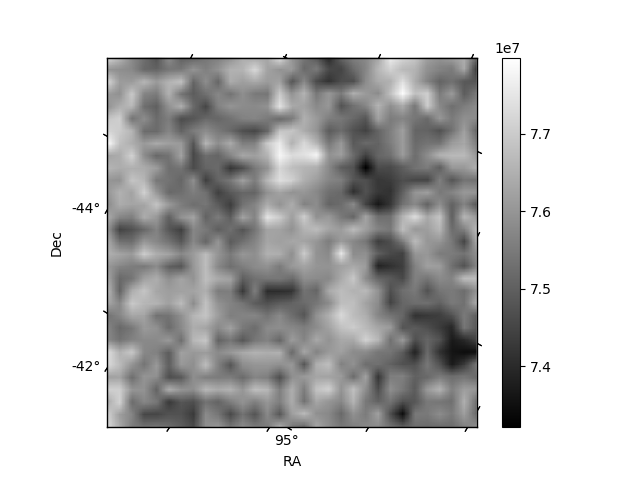
| Quadrant A |  |
 |
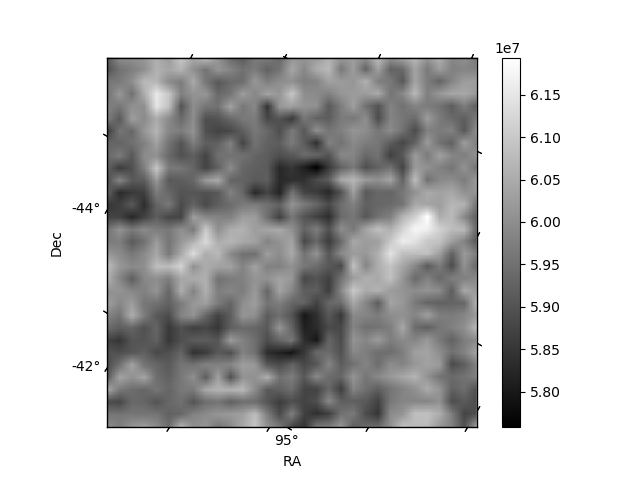
Quadrant B |
|---|---|---|---|
| Quadrant D |  |
 |
Quadrant C |
| Plot type | Count rate plots | Images |
|---|---|---|
| Comparison with Poisson distribution Blue bars denote a histogram of data divided into 1 sec bins. Red curve is a Poisson curve with rate = median count rate of data. |
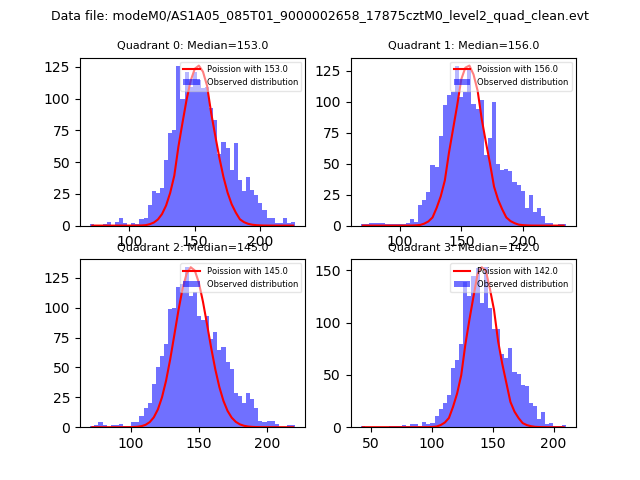 |
 |
| Quadrant-wise count rates Data is divided into 100 sec bins |
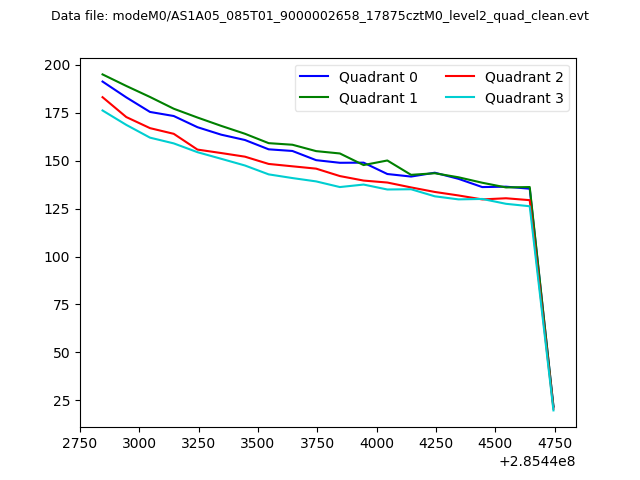 |
|
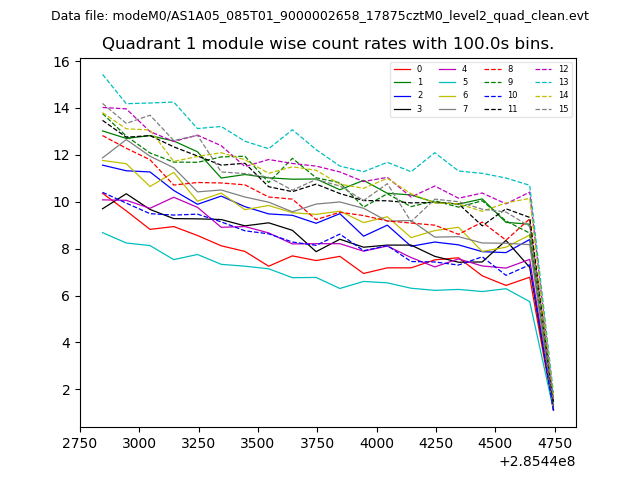
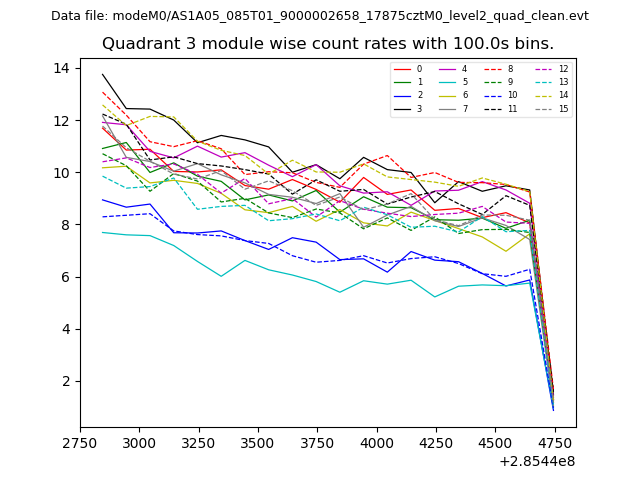
| Module-wise count rates for Quadrant A Data is divided into 100 sec bins |
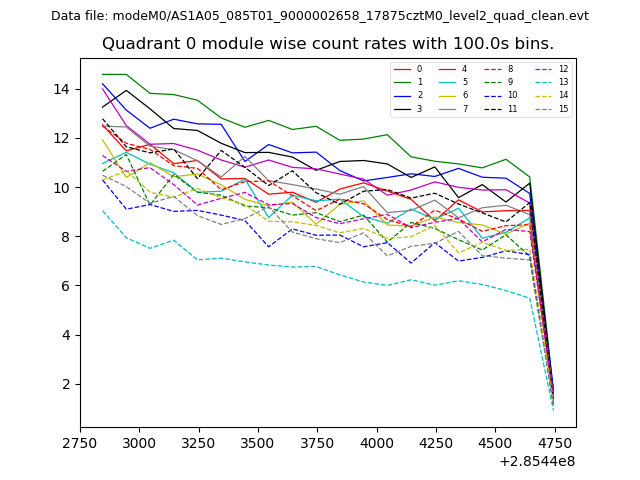 |
 |
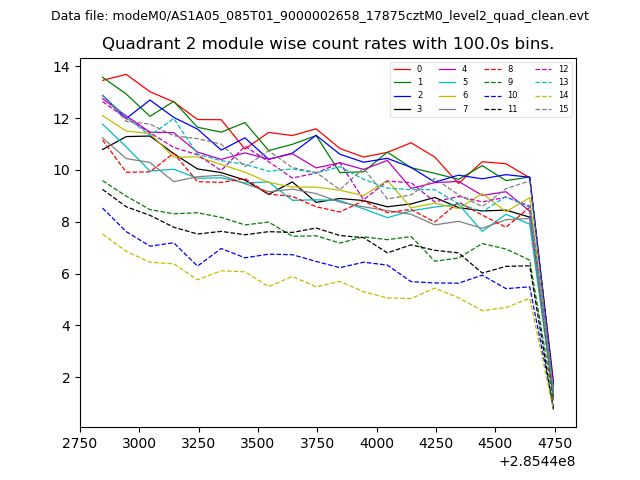
| Module-wise count rates for Quadrant B Data is divided into 100 sec bins |
 |
 |
| Module-wise count rates for Quadrant C Data is divided into 100 sec bins |
 |
 |
| Module-wise count rates for Quadrant D Data is divided into 100 sec bins |
 |
 |
| Parameter | Plot |
|---|---|
| CZT HV Monitor | 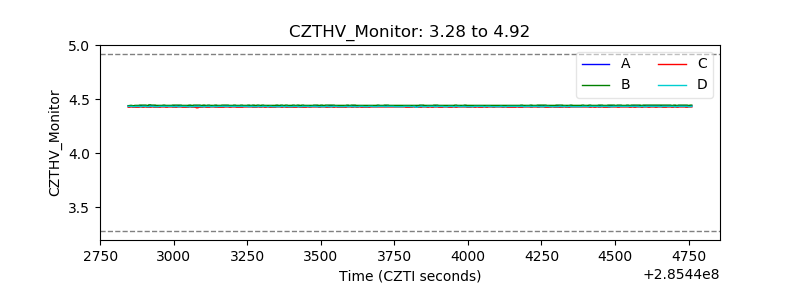 |
| D_VDD | 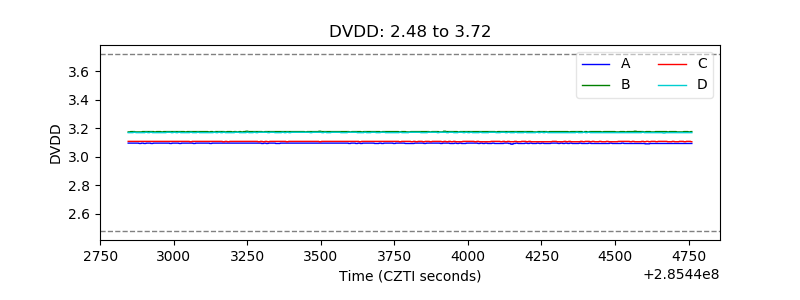 |
| Temperature 1 | 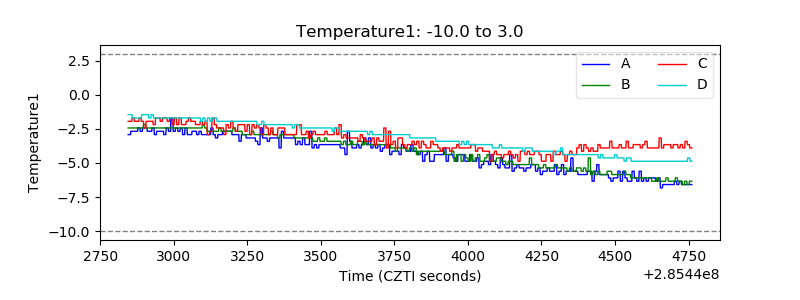 |
| Veto HV Monitor | 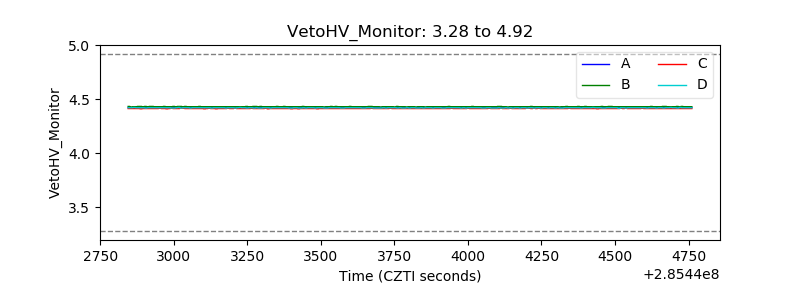 |
| Veto LLD | 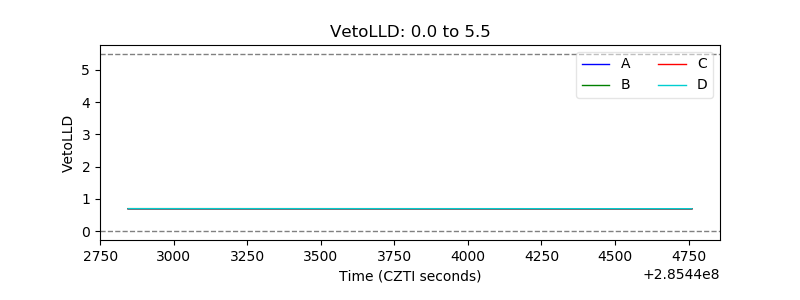 |
| Alpha Counter | 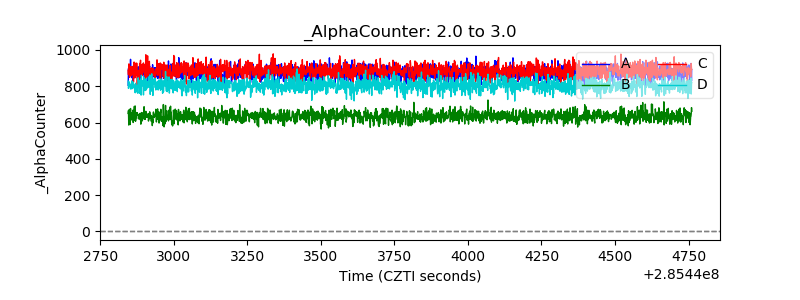 |
| _CPM_Rate | 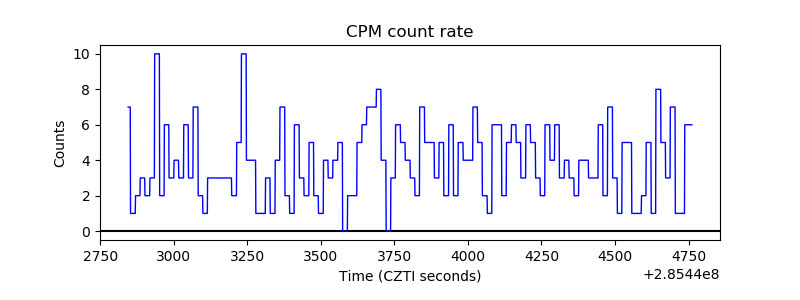 |
| CZT Counter |  |
| +2.5 Volts monitor |  |
| +5 Volts monitor |  |
| _ROLL_ROT | 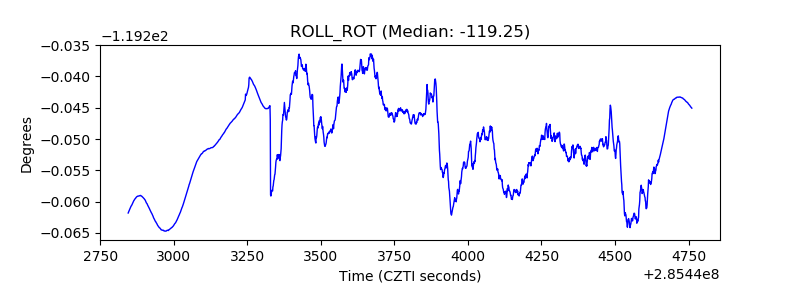 |
| _Roll_DEC |  |
| _Roll_RA | 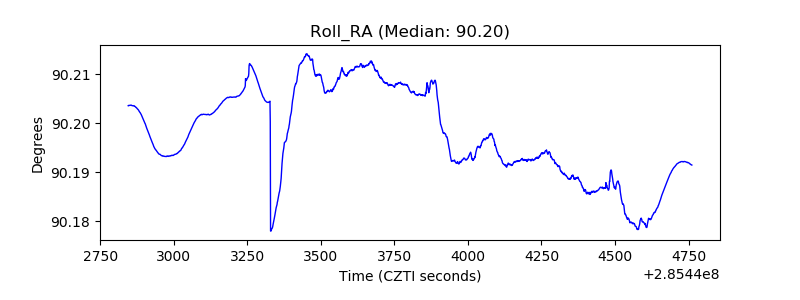 |
| Veto Counter | 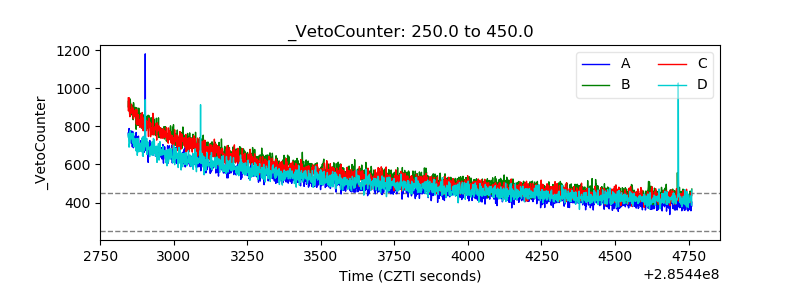 |