| Param | Original file | Final file |
|---|---|---|
| Filename | modeM0/AS1A05_101T06_9000002656_17841cztM0_level2.evt | modeM0/AS1A05_101T06_9000002656_17841cztM0_level2_quad_clean.evt |
| Size (bytes) | 175,904,640 | 32,014,080 |
| Size | 167.8 MB | 30.5 MB |
| Events in quadrant A | 1,212,263 | 202,604 |
| Events in quadrant B | 1,324,371 | 205,460 |
| Events in quadrant C | 1,214,074 | 197,813 |
| Events in quadrant D | 1,411,421 | 190,598 |
| Mode M9 | |||
|---|---|---|---|
| Quadrant | BADHDUFLAG | Total packets | Discarded packets |
| A | 0 | 8 | 0 |
| B | 0 | 8 | 0 |
| C | 0 | 8 | 0 |
| D | 0 | 8 | 0 |
| Mode SS | |||
|---|---|---|---|
| Quadrant | BADHDUFLAG | Total packets | Discarded packets |
| A | 0 | 52 | 0 |
| B | 0 | 52 | 0 |
| C | 0 | 52 | 0 |
| D | 0 | 52 | 0 |
| Mode M0 | |||
|---|---|---|---|
| Quadrant | BADHDUFLAG | Total packets | Discarded packets |
| A | 0 | 5003 | 1 |
| B | 0 | 5345 | 1 |
| C | 0 | 4984 | 1 |
| D | 0 | 5726 | 1 |
| Quadrant | Total seconds | Saturated seconds | Saturation percentage |
|---|---|---|---|
| A | 2390 | 38 | 1.589958% |
| B | 2390 | 45 | 1.882845% |
| C | 2390 | 40 | 1.673640% |
| D | 2389 | 75 | 3.139389% |
Noise dominated data is calculated using 1-second bins in cleaned event files. If a bin has >2000 counts, and if more than 50% of those come from <1% of pixels, then it is considered to be noise-dominated and hence unusable.
| Quadrant | # 1 sec bins | Bins with >0 counts | Bins with >2000 counts | High rate bins dominated by noise | Noise dominated (total time) | Noise dominated (detector-on time) | Marked lightcurve |
|---|---|---|---|---|---|---|---|
| A | 3245 | 2391 | 0 | 0 | 0.00% | 0.00% | 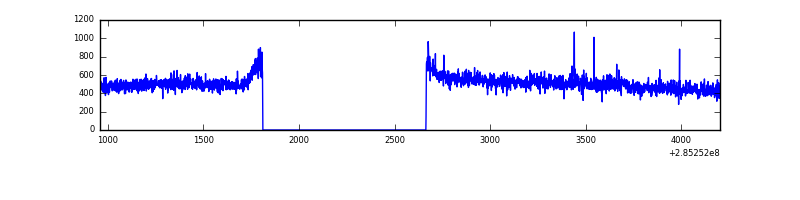 |
| B | 3245 | 2391 | 5 | 5 | 0.15% | 0.21% | 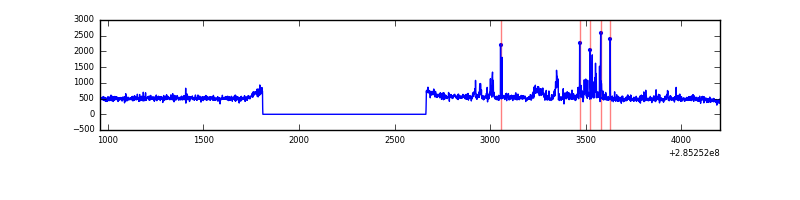 |
| C | 3245 | 2391 | 0 | 0 | 0.00% | 0.00% | 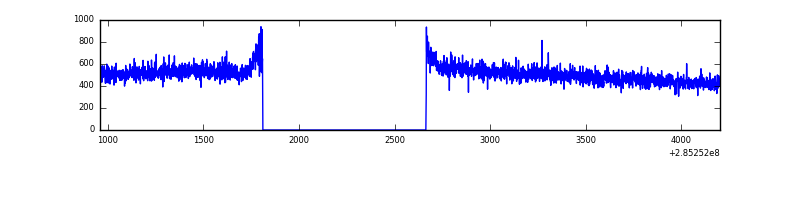 |
| D | 3244 | 2390 | 36 | 36 | 1.11% | 1.51% | 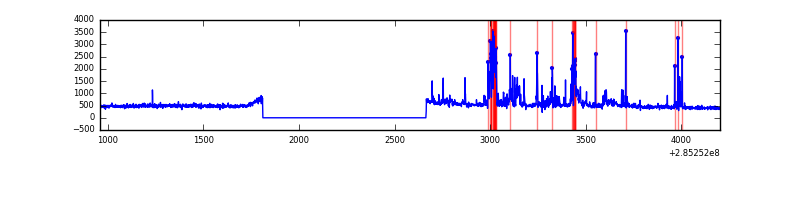 |
Top three noisy pixels from each quadrant. If the there are fewer than three noisy pixels in the level2.evt file, extra rows are filled as -1
| Pixel properties | Quadrant properties | ||||||
|---|---|---|---|---|---|---|---|
| Quadrant | DetID | PixID | Counts | Sigma | Mean | Median | Sigma |
| A | 15 | 174 | 4860 | 69.98 | 313 | 306 | 65.1 |
| A | 0 | 226 | 2848 | 39.06 | 313 | 306 | 65.1 |
| A | 3 | 137 | 2378 | 31.84 | 313 | 306 | 65.1 |
| B | 7 | 220 | 36136 | 580.04 | 309 | 301 | 61.8 |
| B | 4 | 216 | 20934 | 333.97 | 309 | 301 | 61.8 |
| B | 0 | 189 | 20186 | 321.86 | 309 | 301 | 61.8 |
| C | 14 | 238 | 45598 | 637.19 | 296 | 297 | 71.1 |
| C | 3 | 233 | 6408 | 85.96 | 296 | 297 | 71.1 |
| C | 5 | 218 | 3459 | 44.48 | 296 | 297 | 71.1 |
| D | 7 | 238 | 159015 | 2082.63 | 301 | 293 | 76.2 |
| D | 10 | 70 | 77077 | 1007.5 | 301 | 293 | 76.2 |
| D | 7 | 38 | 12845 | 164.7 | 301 | 293 | 76.2 |
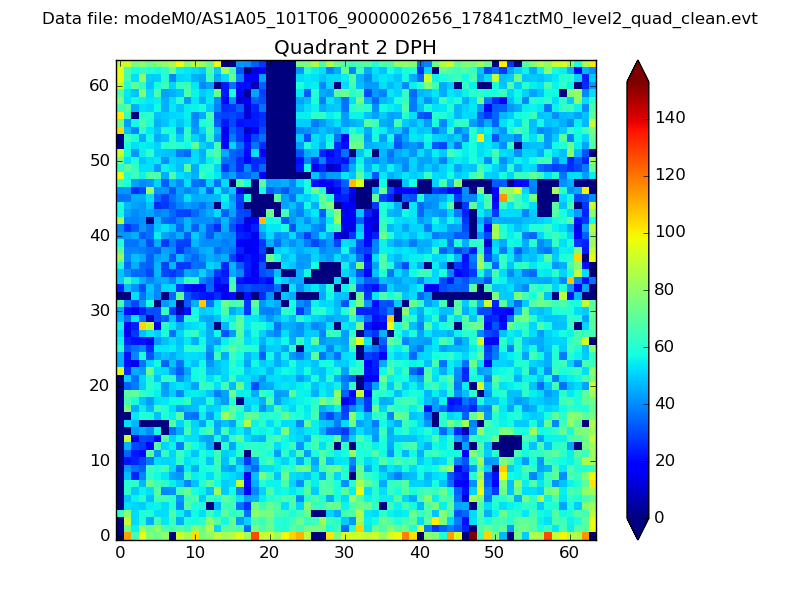
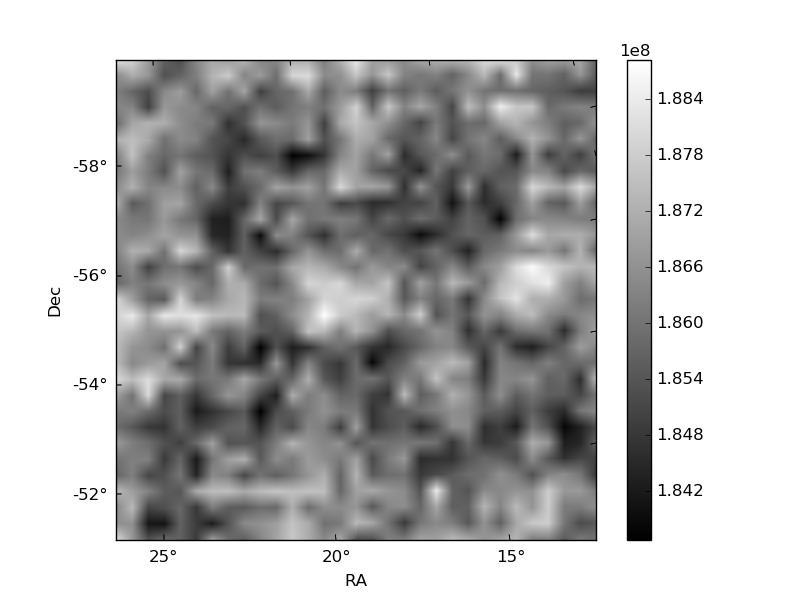
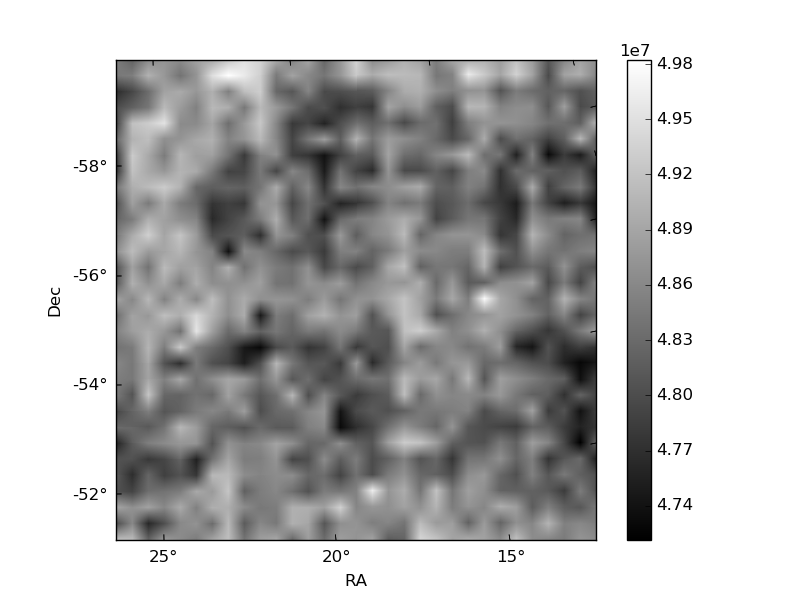
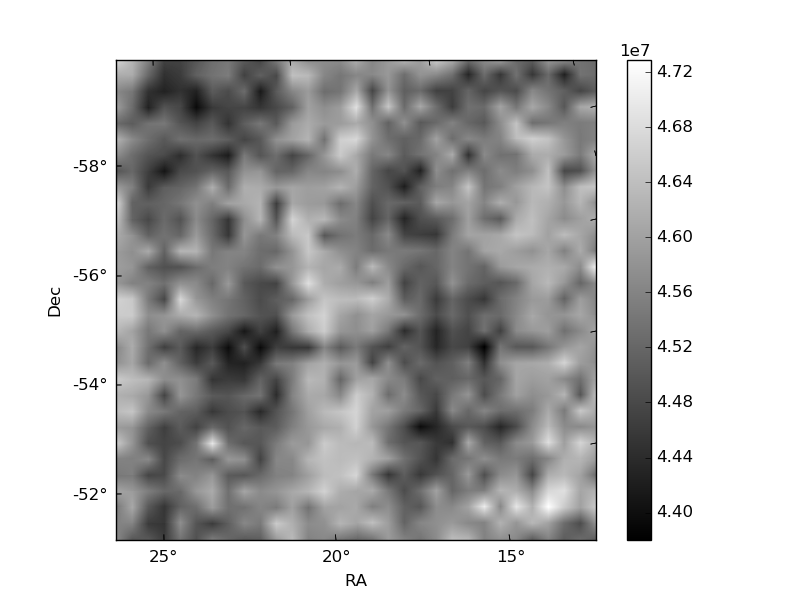
Histogram calculated using DETX and DETY for each event in the final _common_clean file
| Quadrant A | 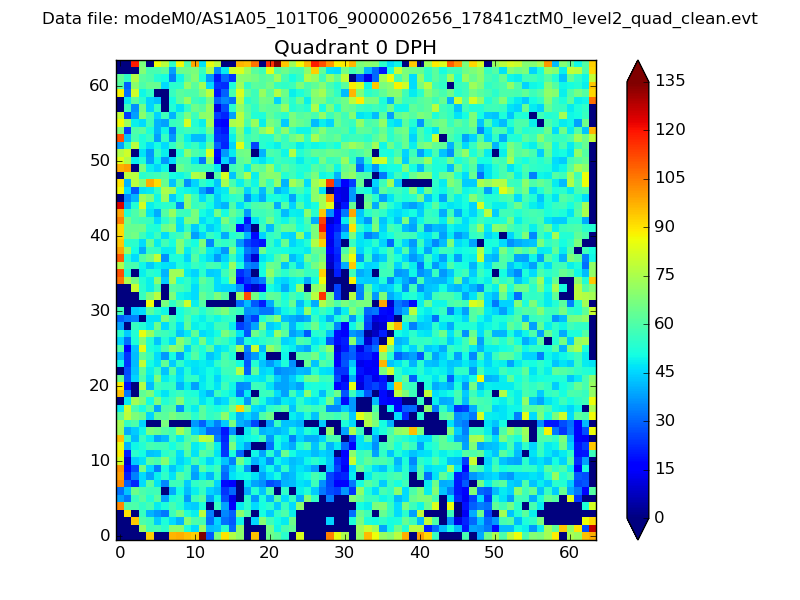 |
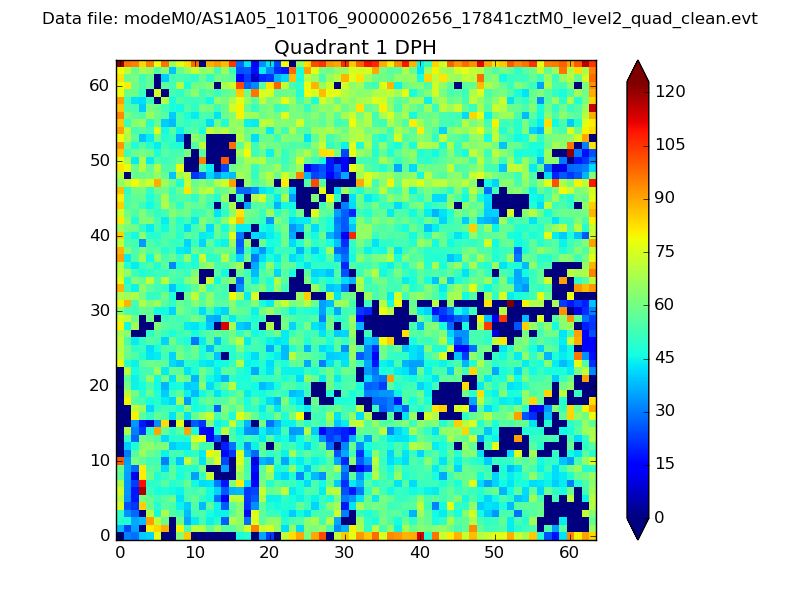 |
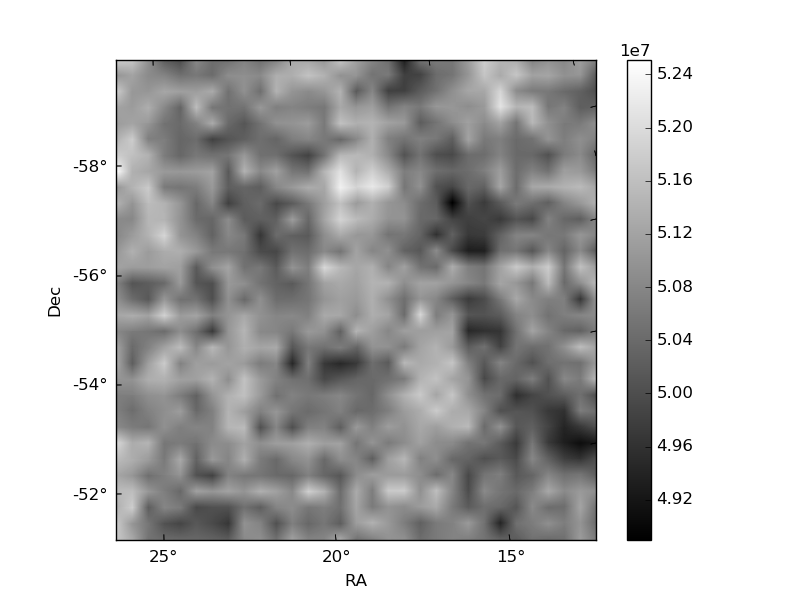
Quadrant B |
|---|---|---|---|
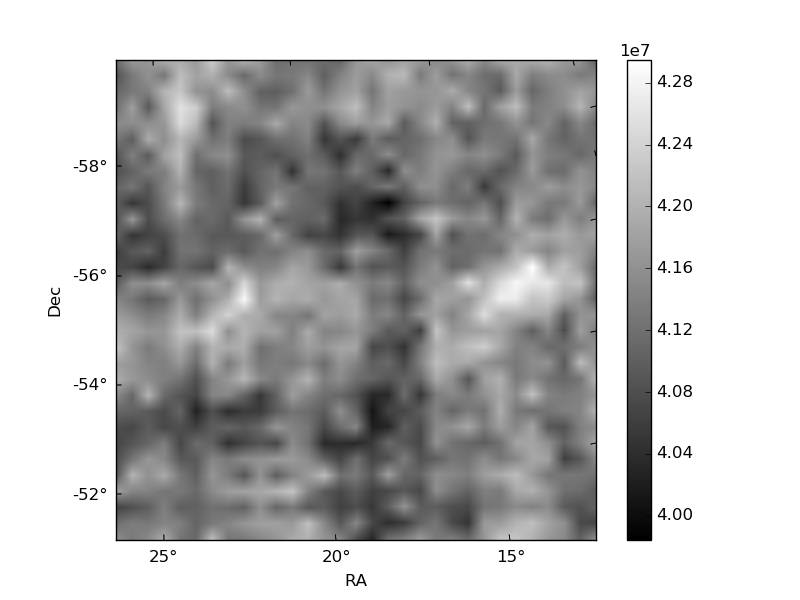
| Quadrant D | 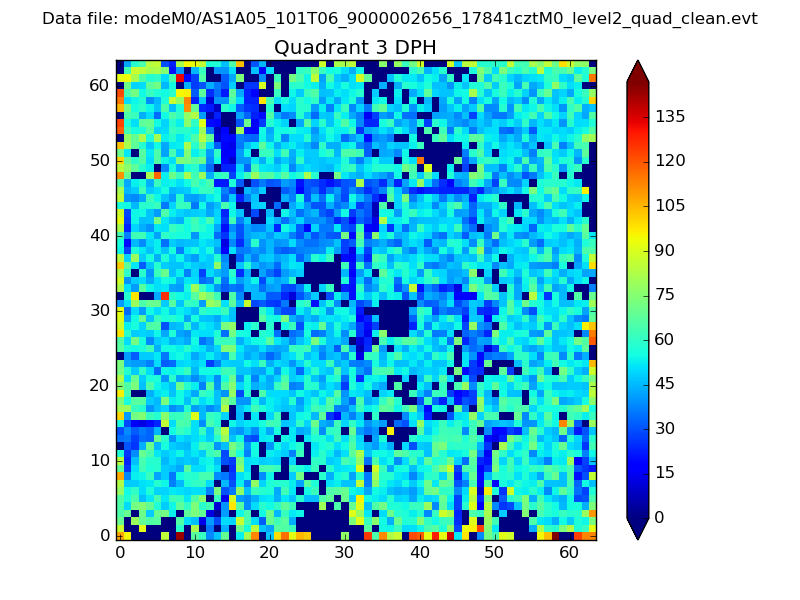 |
 |
Quadrant C |
| Plot type | Count rate plots | Images |
|---|---|---|
| Comparison with Poisson distribution Blue bars denote a histogram of data divided into 1 sec bins. Red curve is a Poisson curve with rate = median count rate of data. |
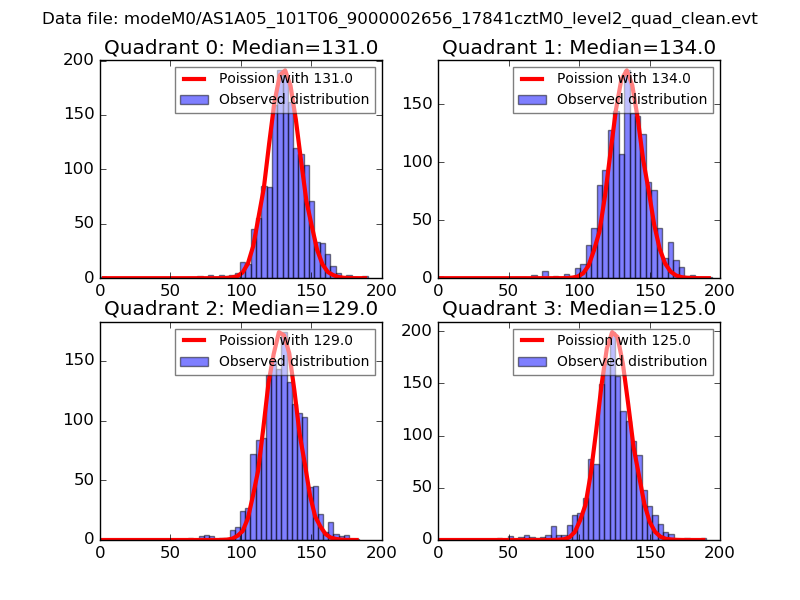 |
 |
| Quadrant-wise count rates Data is divided into 100 sec bins |
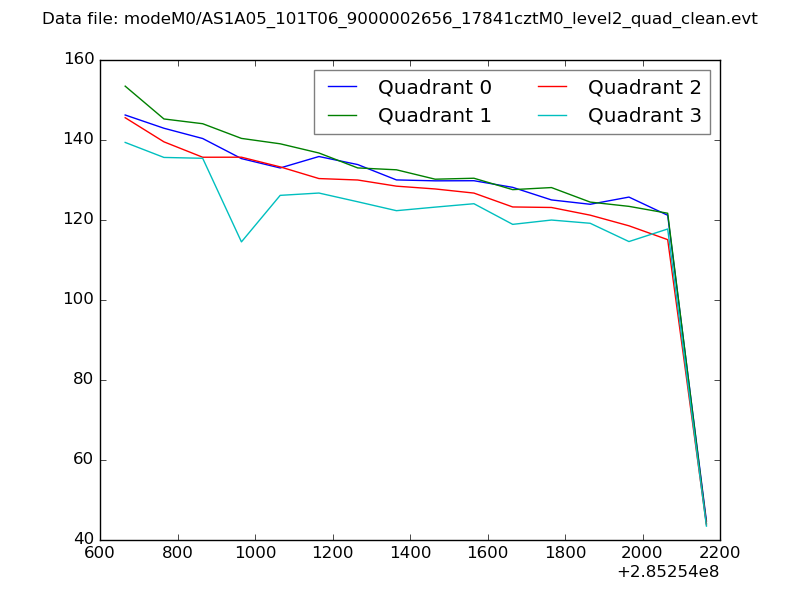 |
|
| Module-wise count rates for Quadrant A Data is divided into 100 sec bins |
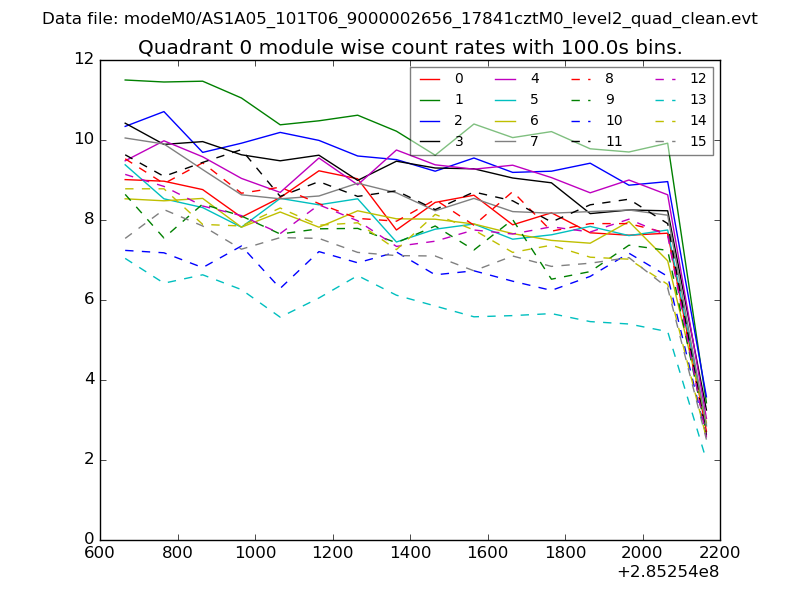 |
 |
| Module-wise count rates for Quadrant B Data is divided into 100 sec bins |
 |
 |
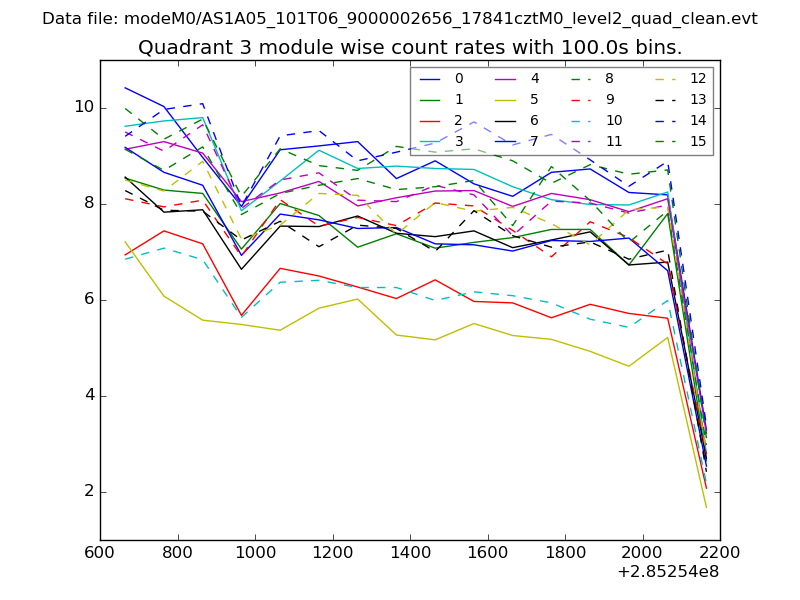
| Module-wise count rates for Quadrant C Data is divided into 100 sec bins |
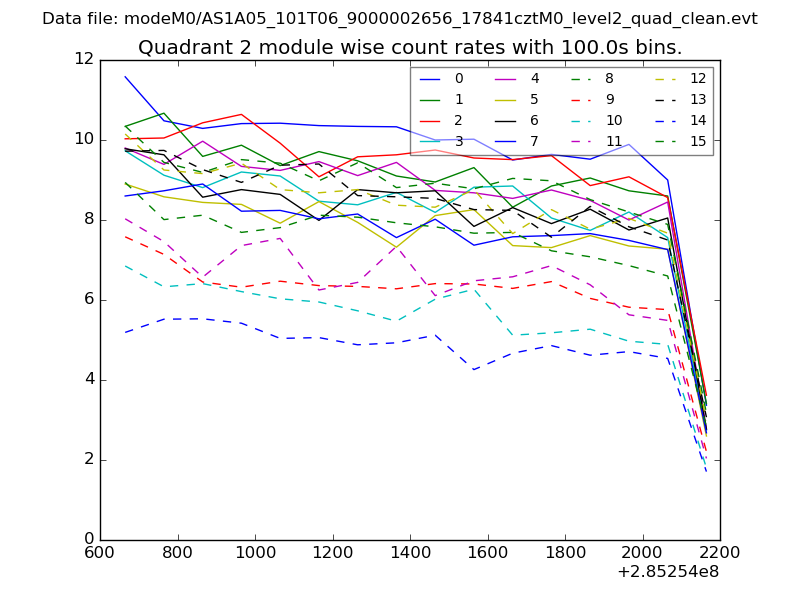 |
 |
| Module-wise count rates for Quadrant D Data is divided into 100 sec bins |
 |
 |
| Parameter | Plot |
|---|---|
| CZT HV Monitor | 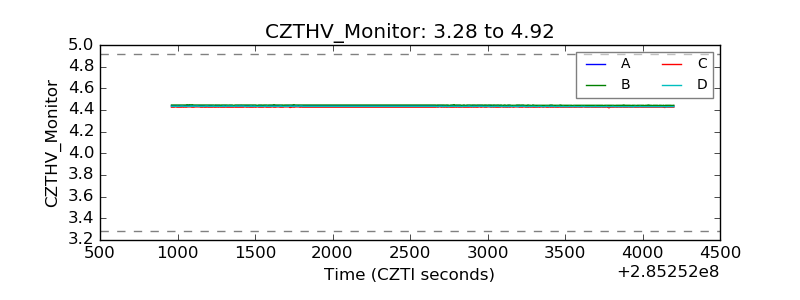 |
| D_VDD | 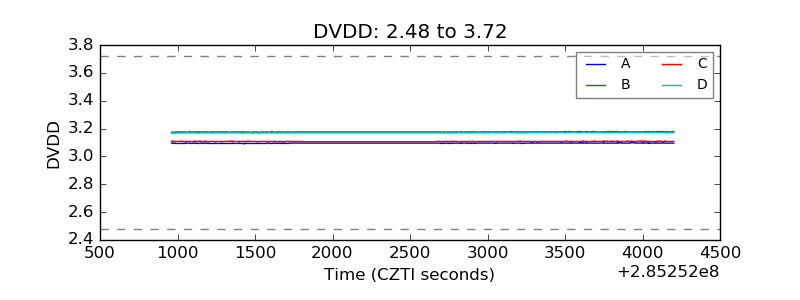 |
| Temperature 1 | 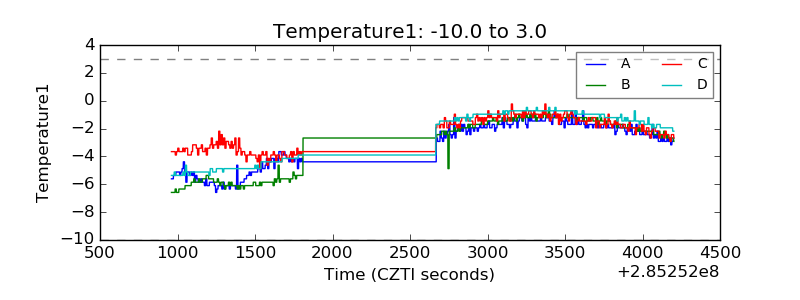 |
| Veto HV Monitor | 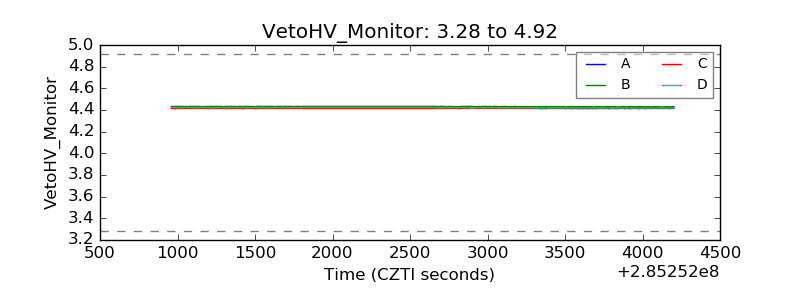 |
| Veto LLD | 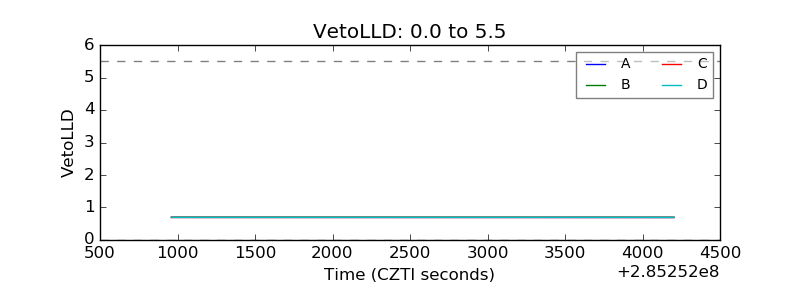 |
| Alpha Counter |  |
| _CPM_Rate | 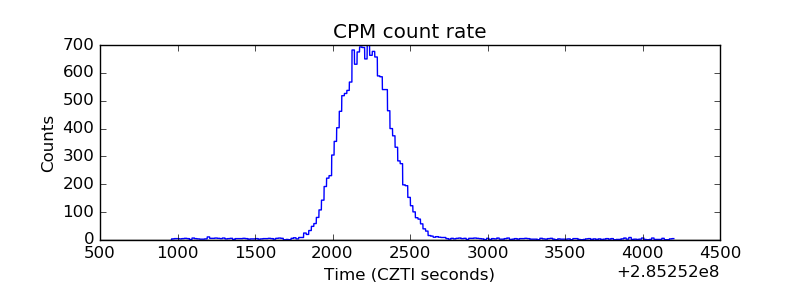 |
| CZT Counter | 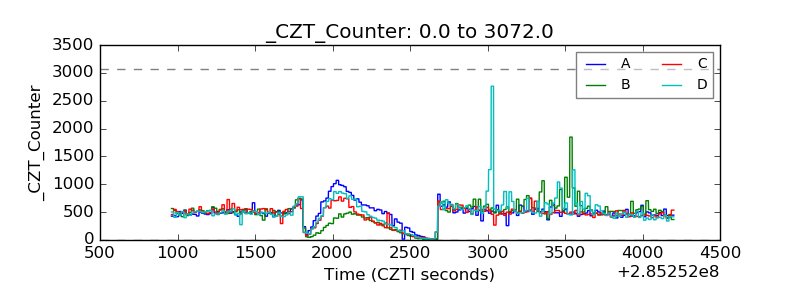 |
| +2.5 Volts monitor |  |
| +5 Volts monitor |  |
| _ROLL_ROT | 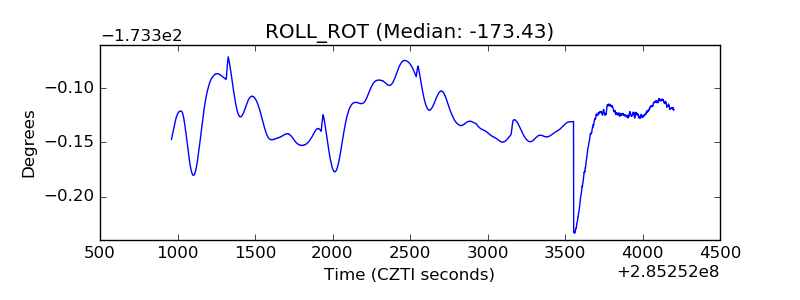 |
| _Roll_DEC | 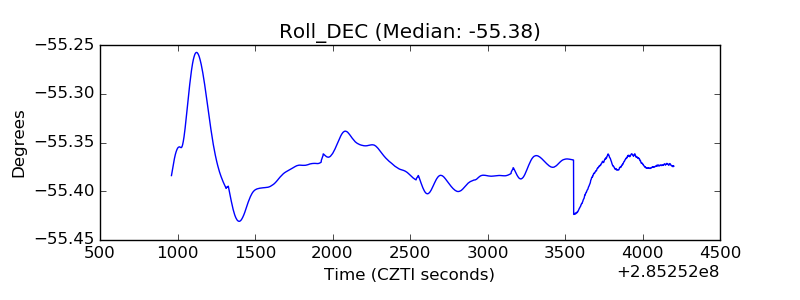 |
| _Roll_RA | 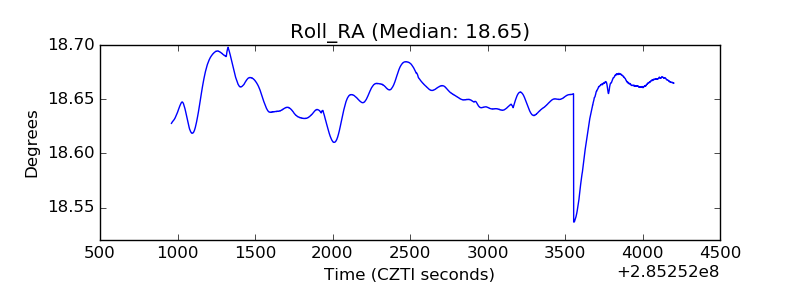 |
| Veto Counter | 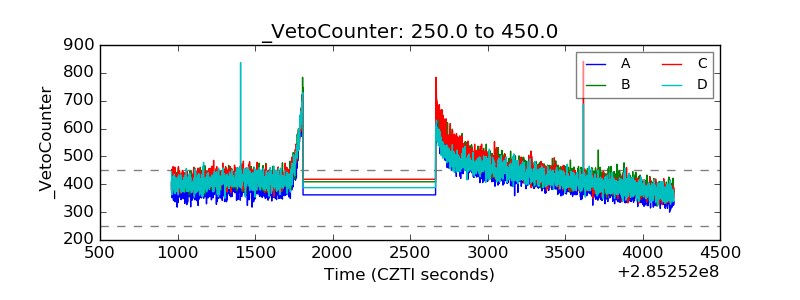 |