| Param | Original file | Final file |
|---|---|---|
| Filename | modeM0/AS1A05_101T06_9000002656_17842cztM0_level2.evt | modeM0/AS1A05_101T06_9000002656_17842cztM0_level2_quad_clean.evt |
| Size (bytes) | 462,574,080 | 92,963,520 |
| Size | 441.1 MB | 88.7 MB |
| Events in quadrant A | 3,047,798 | 602,487 |
| Events in quadrant B | 3,962,221 | 605,997 |
| Events in quadrant C | 3,045,244 | 580,786 |
| Events in quadrant D | 3,506,559 | 567,135 |
| Mode M9 | |||
|---|---|---|---|
| Quadrant | BADHDUFLAG | Total packets | Discarded packets |
| A | 0 | 10 | 0 |
| B | 0 | 10 | 0 |
| C | 0 | 10 | 0 |
| D | 0 | 10 | 0 |
| Mode SS | |||
|---|---|---|---|
| Quadrant | BADHDUFLAG | Total packets | Discarded packets |
| A | 0 | 134 | 0 |
| B | 0 | 134 | 0 |
| C | 0 | 134 | 0 |
| D | 0 | 134 | 0 |
| Mode M0 | |||
|---|---|---|---|
| Quadrant | BADHDUFLAG | Total packets | Discarded packets |
| A | 0 | 13526 | 1 |
| B | 0 | 16255 | 1 |
| C | 0 | 13446 | 1 |
| D | 0 | 15113 | 1 |
| Quadrant | Total seconds | Saturated seconds | Saturation percentage |
|---|---|---|---|
| A | 6578 | 39 | 0.592885% |
| B | 6579 | 205 | 3.115975% |
| C | 6579 | 48 | 0.729594% |
| D | 6579 | 135 | 2.051984% |
Noise dominated data is calculated using 1-second bins in cleaned event files. If a bin has >2000 counts, and if more than 50% of those come from <1% of pixels, then it is considered to be noise-dominated and hence unusable.
| Quadrant | # 1 sec bins | Bins with >0 counts | Bins with >2000 counts | High rate bins dominated by noise | Noise dominated (total time) | Noise dominated (detector-on time) | Marked lightcurve |
|---|---|---|---|---|---|---|---|
| A | 7593 | 6579 | 1 | 1 | 0.01% | 0.02% | 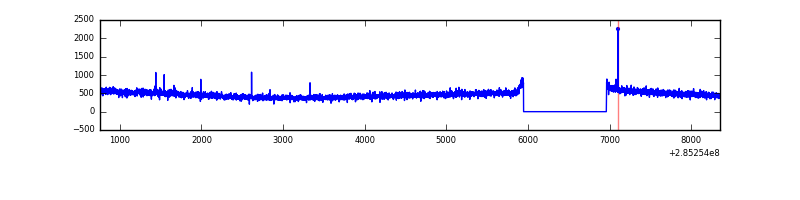 |
| B | 7594 | 6580 | 75 | 75 | 0.99% | 1.14% | 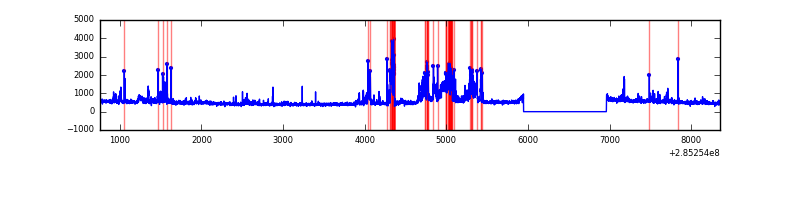 |
| C | 7594 | 6580 | 0 | 0 | 0.00% | 0.00% | 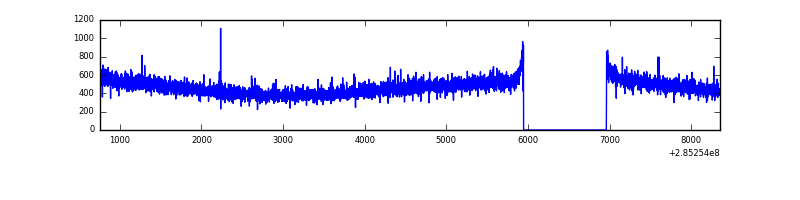 |
| D | 7594 | 6580 | 88 | 88 | 1.16% | 1.34% | 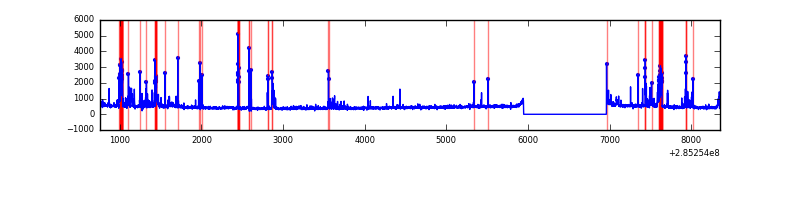 |
Top three noisy pixels from each quadrant. If the there are fewer than three noisy pixels in the level2.evt file, extra rows are filled as -1
| Pixel properties | Quadrant properties | ||||||
|---|---|---|---|---|---|---|---|
| Quadrant | DetID | PixID | Counts | Sigma | Mean | Median | Sigma |
| A | 15 | 174 | 10181 | 58.59 | 790 | 775 | 160.5 |
| A | 0 | 226 | 7091 | 39.34 | 790 | 775 | 160.5 |
| A | 3 | 137 | 5800 | 31.3 | 790 | 775 | 160.5 |
| B | 15 | 222 | 669321 | 4510.07 | 782 | 762 | 148.2 |
| B | 7 | 220 | 63094 | 420.49 | 782 | 762 | 148.2 |
| B | 0 | 189 | 30367 | 199.71 | 782 | 762 | 148.2 |
| C | 14 | 238 | 115265 | 657.19 | 745 | 747 | 174.3 |
| C | 3 | 233 | 13555 | 73.5 | 745 | 747 | 174.3 |
| C | 5 | 218 | 9955 | 52.84 | 745 | 747 | 174.3 |
| D | 7 | 238 | 430028 | 2241.91 | 750 | 729 | 191.5 |
| D | 10 | 70 | 92685 | 480.22 | 750 | 729 | 191.5 |
| D | 7 | 223 | 48127 | 247.52 | 750 | 729 | 191.5 |
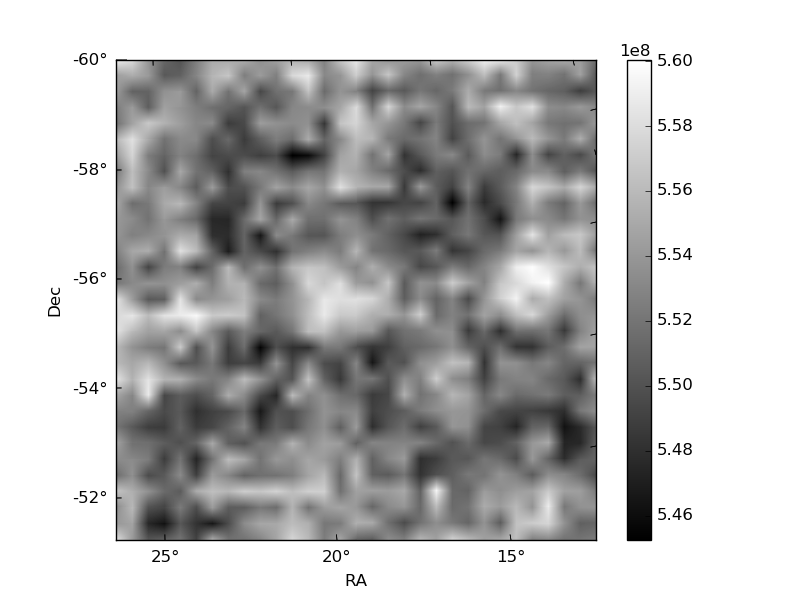
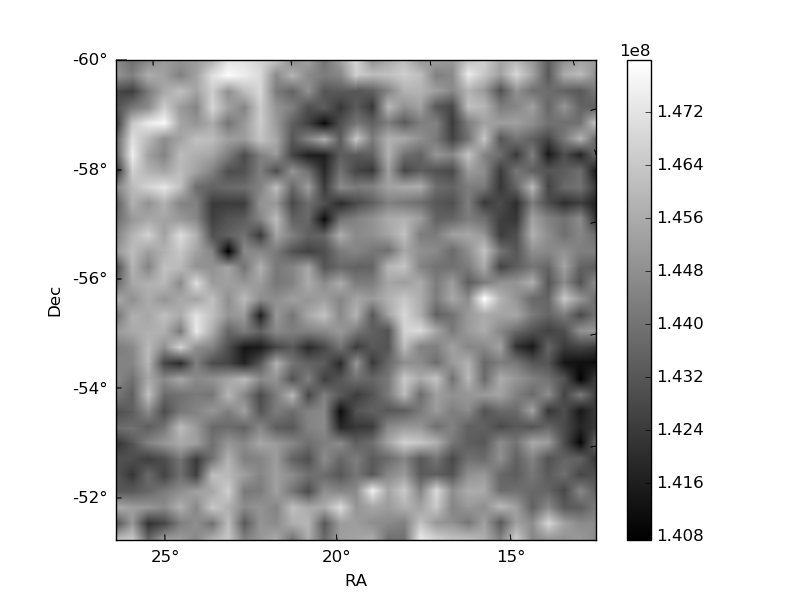
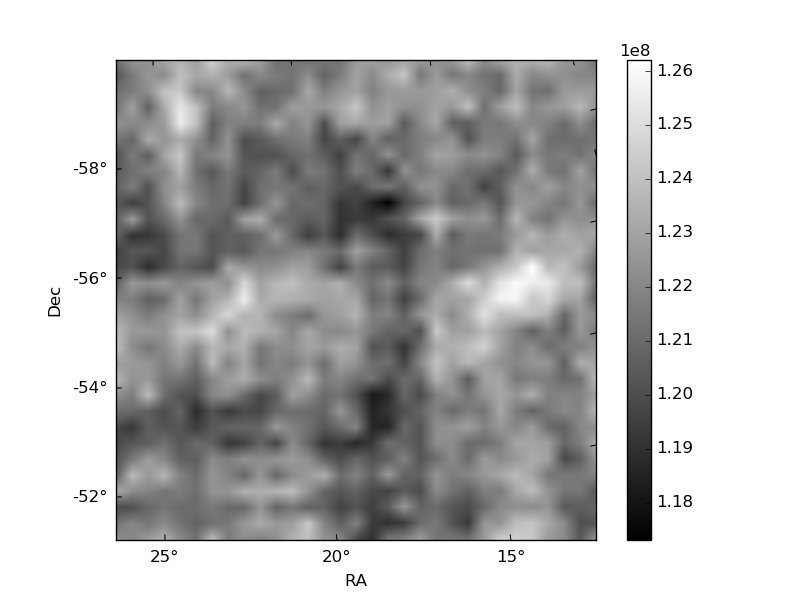
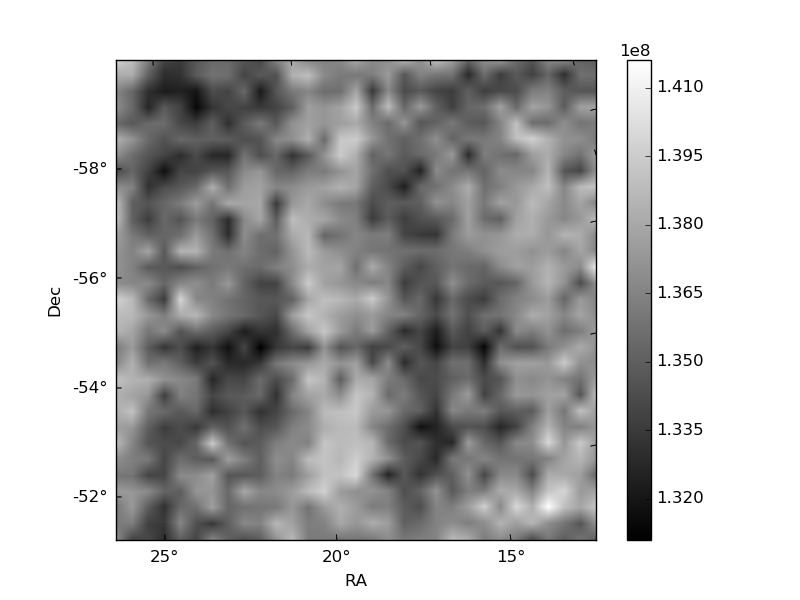
Histogram calculated using DETX and DETY for each event in the final _common_clean file
| Quadrant A | 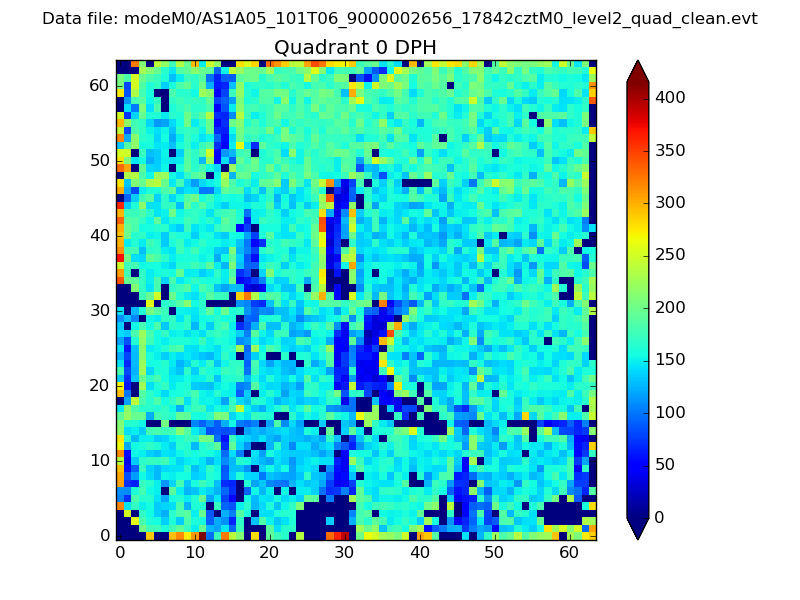 |
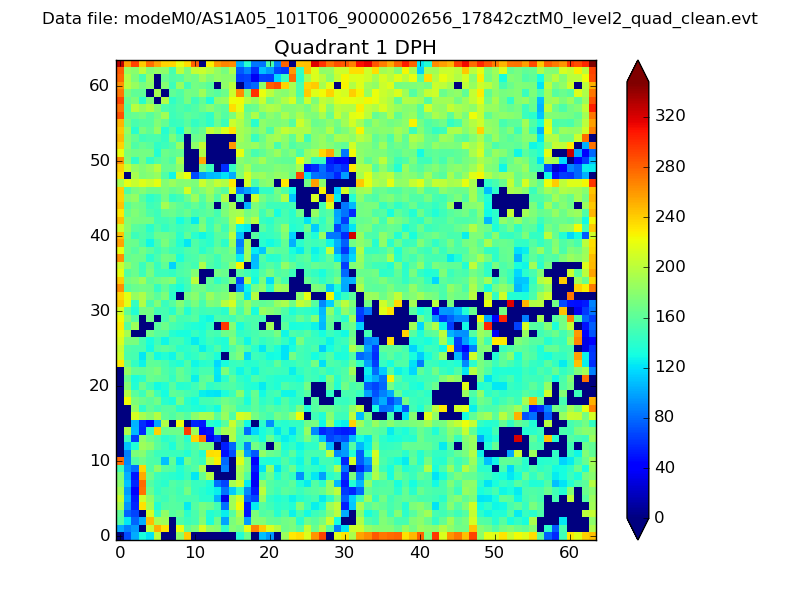 |
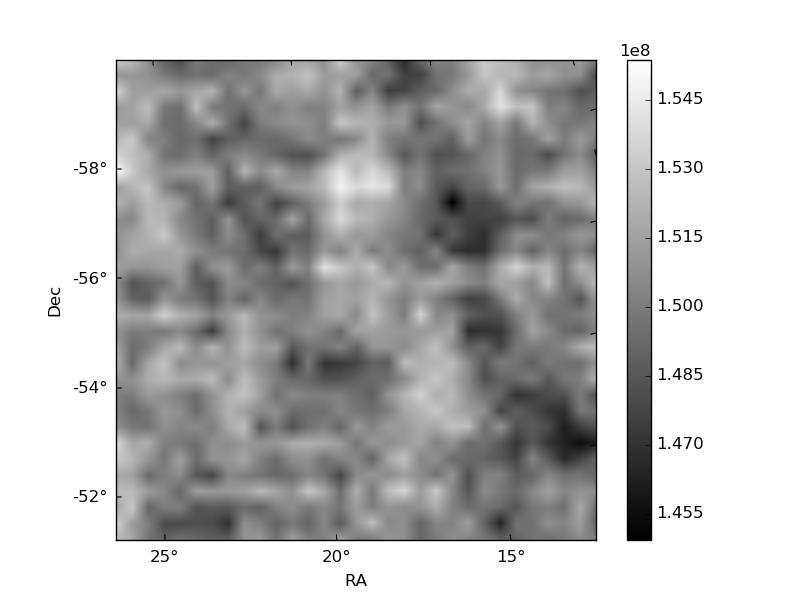
Quadrant B |
|---|---|---|---|
| Quadrant D | 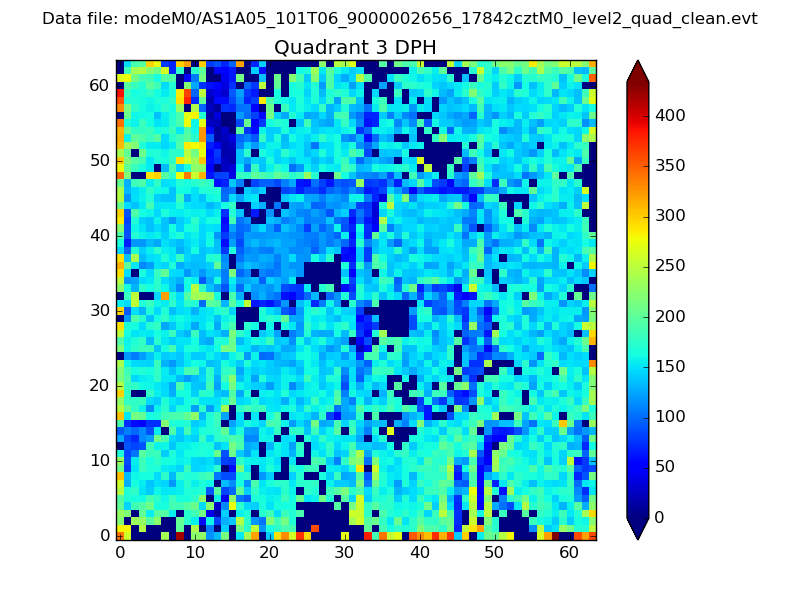 |
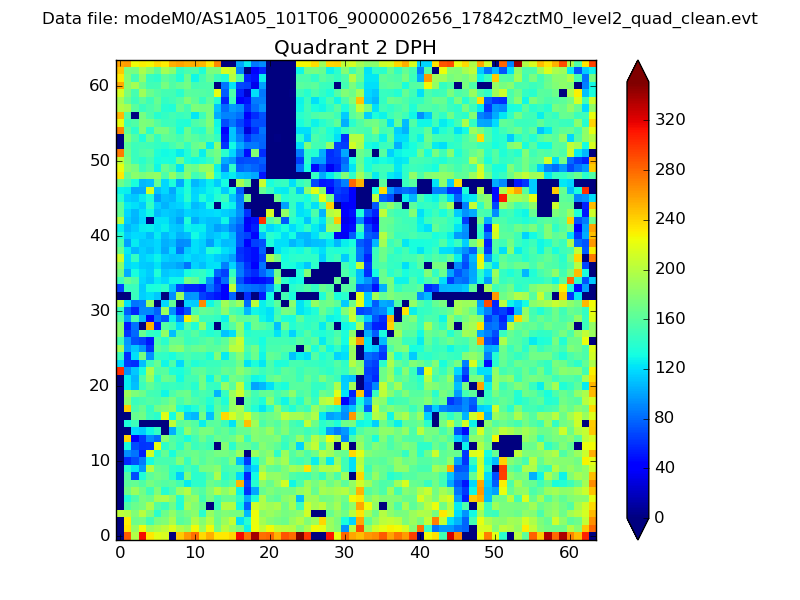 |
Quadrant C |
| Plot type | Count rate plots | Images |
|---|---|---|
| Comparison with Poisson distribution Blue bars denote a histogram of data divided into 1 sec bins. Red curve is a Poisson curve with rate = median count rate of data. |
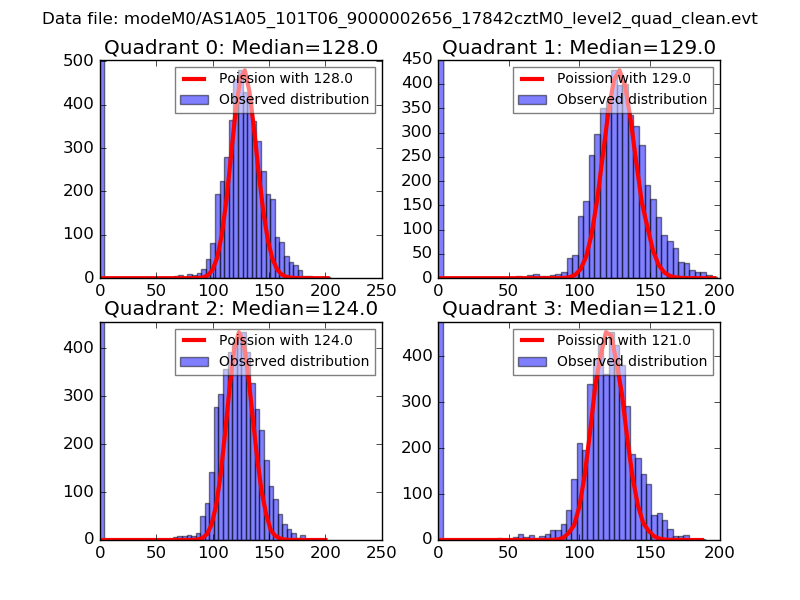 |
 |
| Quadrant-wise count rates Data is divided into 100 sec bins |
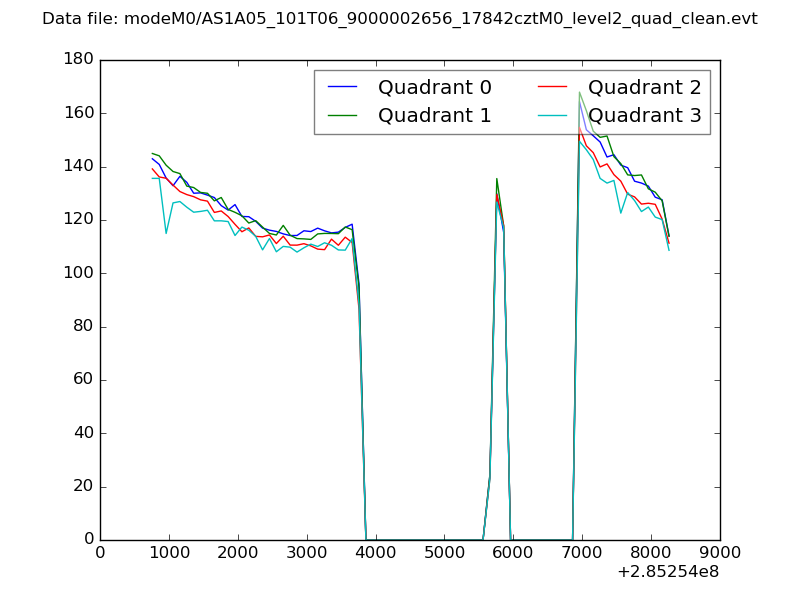 |
|
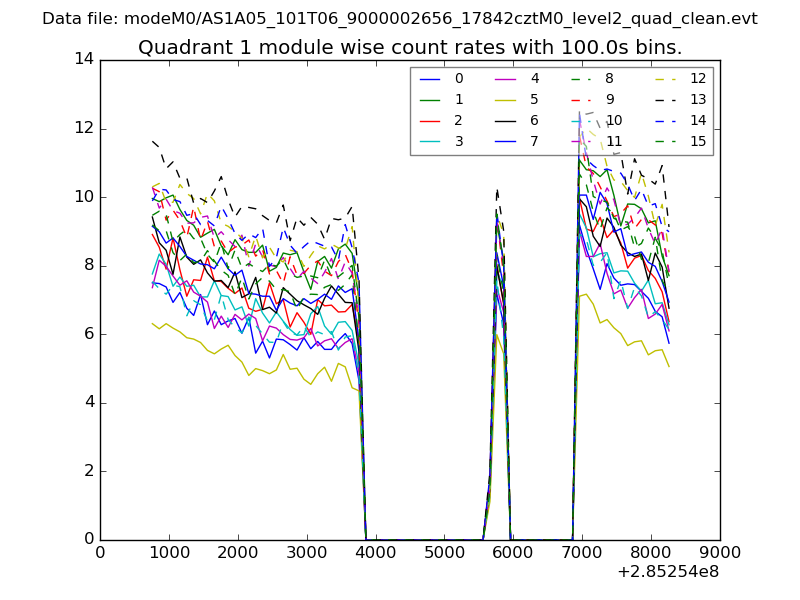
| Module-wise count rates for Quadrant A Data is divided into 100 sec bins |
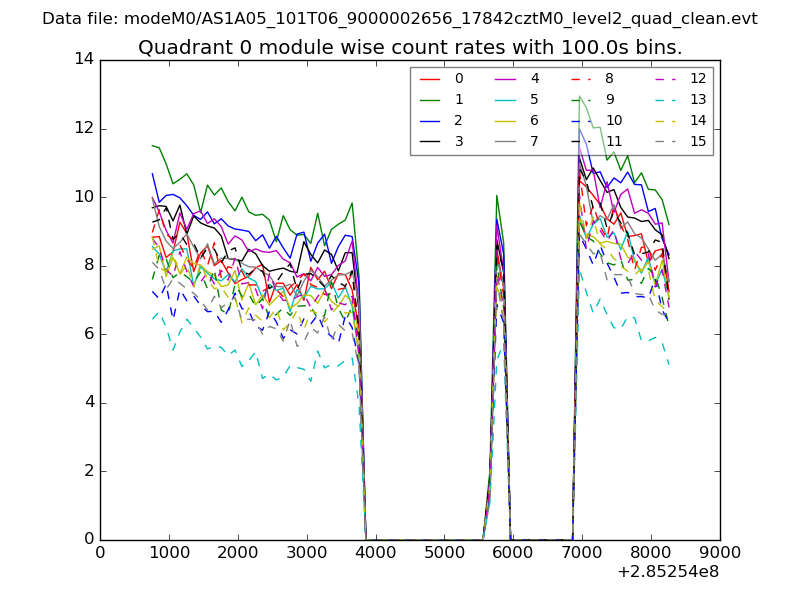 |
 |
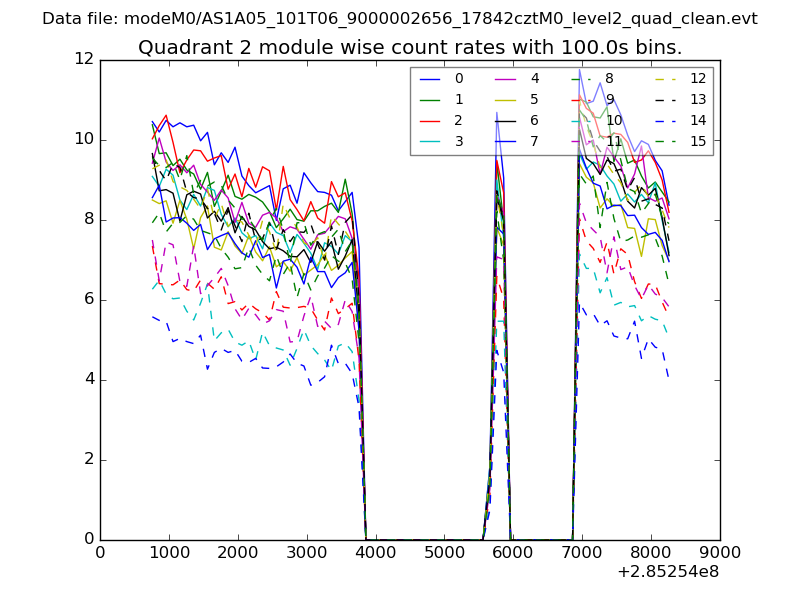
| Module-wise count rates for Quadrant B Data is divided into 100 sec bins |
 |
 |
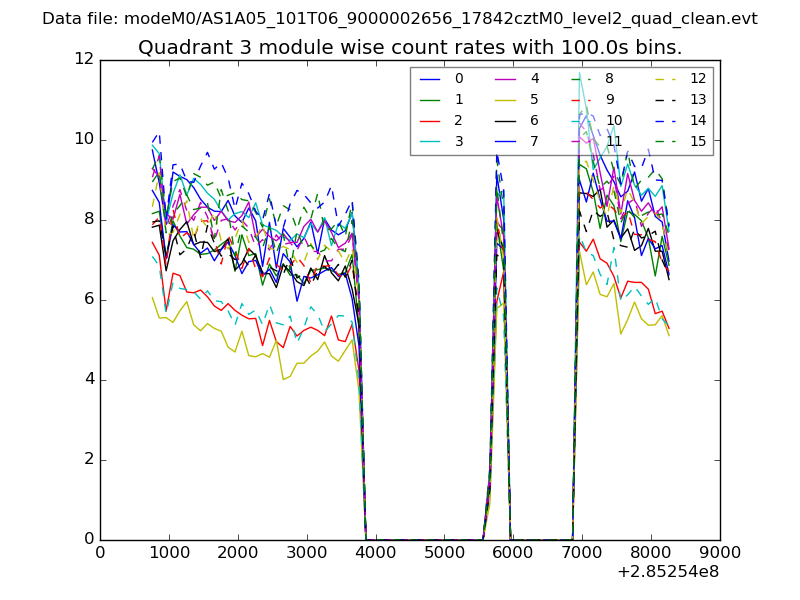
| Module-wise count rates for Quadrant C Data is divided into 100 sec bins |
 |
 |
| Module-wise count rates for Quadrant D Data is divided into 100 sec bins |
 |
 |
| Parameter | Plot |
|---|---|
| CZT HV Monitor | 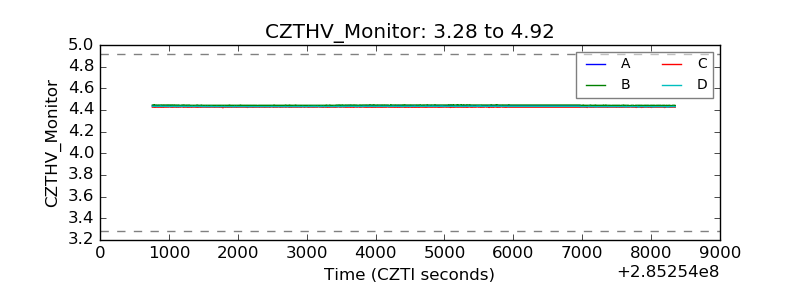 |
| D_VDD | 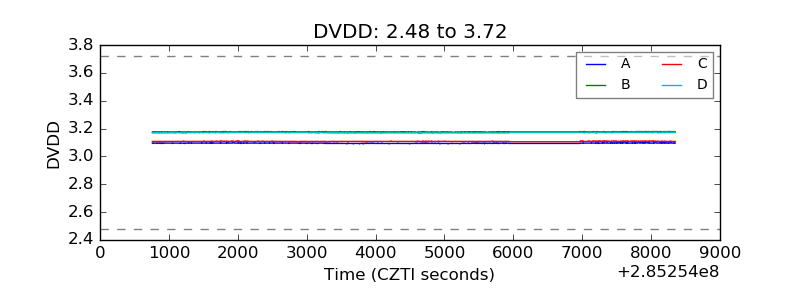 |
| Temperature 1 | 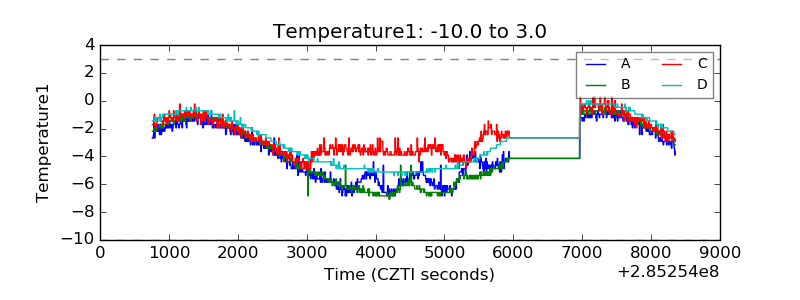 |
| Veto HV Monitor | 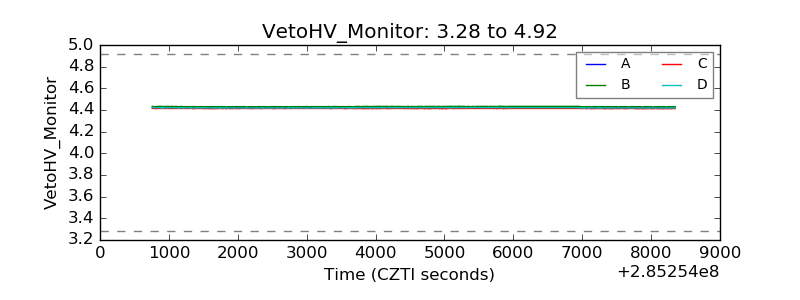 |
| Veto LLD | 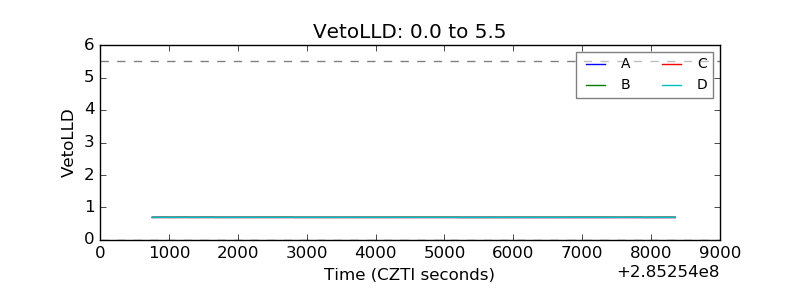 |
| Alpha Counter | 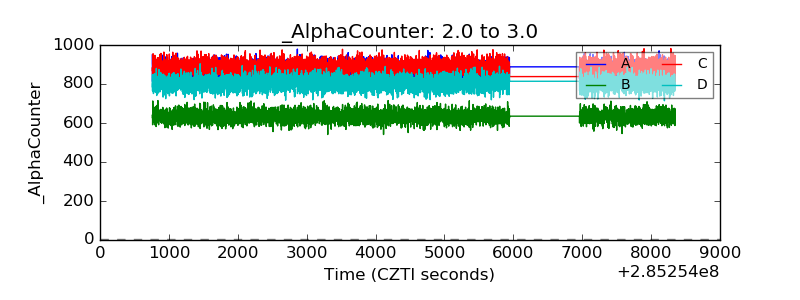 |
| _CPM_Rate | 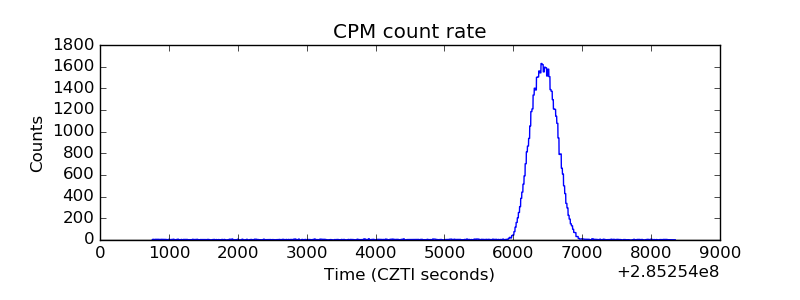 |
| CZT Counter | 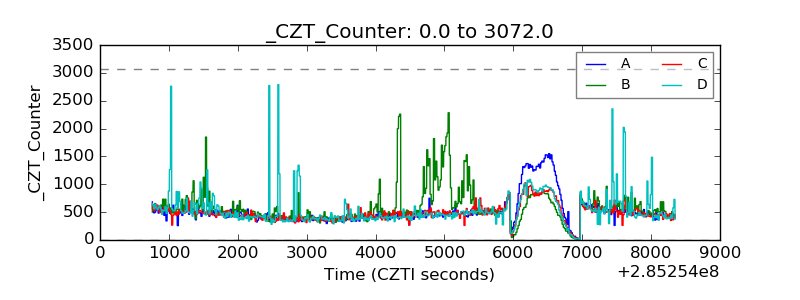 |
| +2.5 Volts monitor |  |
| +5 Volts monitor |  |
| _ROLL_ROT | 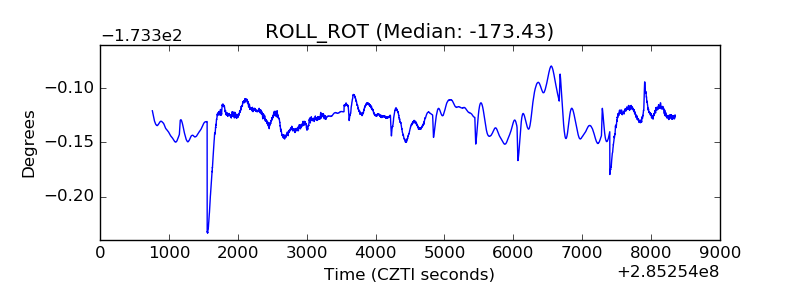 |
| _Roll_DEC | 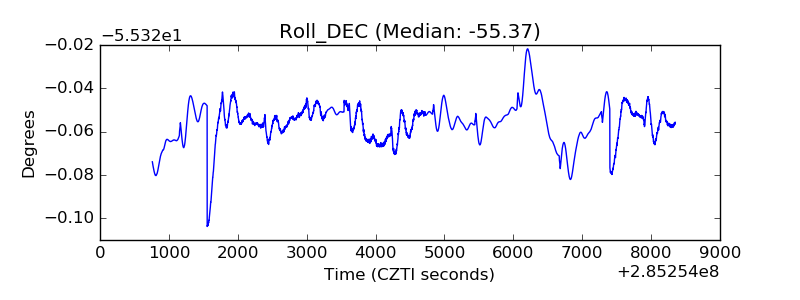 |
| _Roll_RA | 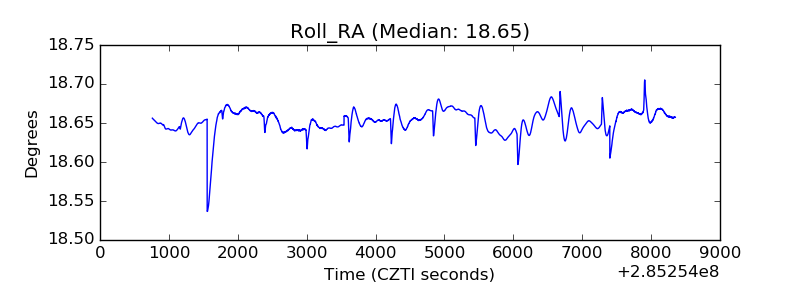 |
| Veto Counter | 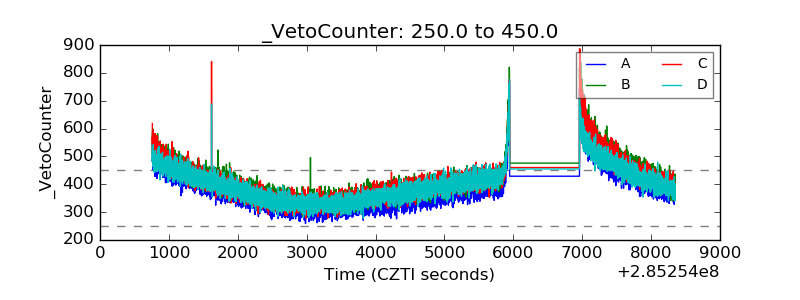 |