| Param | Original file | Final file |
|---|---|---|
| Filename | modeM0/AS1A05_101T06_9000002656_17845cztM0_level2.evt | modeM0/AS1A05_101T06_9000002656_17845cztM0_level2_quad_clean.evt |
| Size (bytes) | 390,021,120 | 83,344,320 |
| Size | 372.0 MB | 79.5 MB |
| Events in quadrant A | 2,748,586 | 542,343 |
| Events in quadrant B | 3,056,535 | 553,915 |
| Events in quadrant C | 2,721,065 | 522,592 |
| Events in quadrant D | 2,898,225 | 506,941 |
| Mode M9 | |||
|---|---|---|---|
| Quadrant | BADHDUFLAG | Total packets | Discarded packets |
| A | 0 | 13 | 0 |
| B | 0 | 13 | 0 |
| C | 0 | 13 | 0 |
| D | 0 | 13 | 0 |
| Mode SS | |||
|---|---|---|---|
| Quadrant | BADHDUFLAG | Total packets | Discarded packets |
| A | 0 | 116 | 0 |
| B | 0 | 116 | 0 |
| C | 0 | 116 | 0 |
| D | 0 | 116 | 0 |
| Mode M0 | |||
|---|---|---|---|
| Quadrant | BADHDUFLAG | Total packets | Discarded packets |
| A | 0 | 11903 | 1 |
| B | 0 | 12710 | 1 |
| C | 0 | 11730 | 1 |
| D | 0 | 12533 | 1 |
| Quadrant | Total seconds | Saturated seconds | Saturation percentage |
|---|---|---|---|
| A | 5693 | 36 | 0.632356% |
| B | 5693 | 62 | 1.089057% |
| C | 5693 | 67 | 1.176884% |
| D | 5693 | 39 | 0.685052% |
Noise dominated data is calculated using 1-second bins in cleaned event files. If a bin has >2000 counts, and if more than 50% of those come from <1% of pixels, then it is considered to be noise-dominated and hence unusable.
| Quadrant | # 1 sec bins | Bins with >0 counts | Bins with >2000 counts | High rate bins dominated by noise | Noise dominated (total time) | Noise dominated (detector-on time) | Marked lightcurve |
|---|---|---|---|---|---|---|---|
| A | 6944 | 5695 | 4 | 4 | 0.06% | 0.07% | 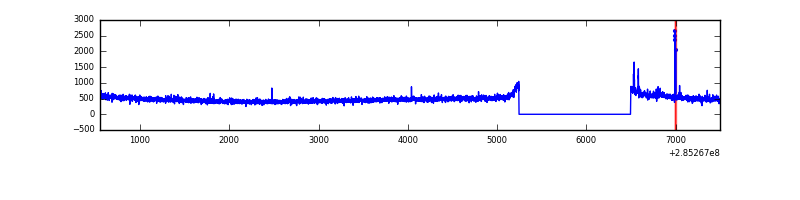 |
| B | 6944 | 5695 | 11 | 11 | 0.16% | 0.19% | 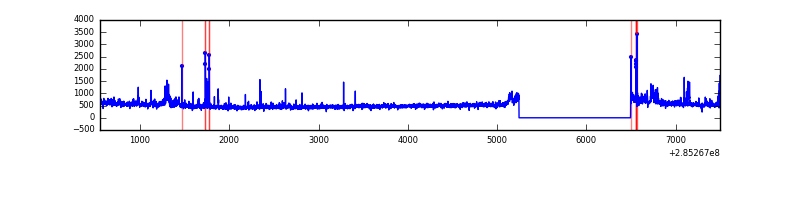 |
| C | 6944 | 5695 | 0 | 0 | 0.00% | 0.00% | 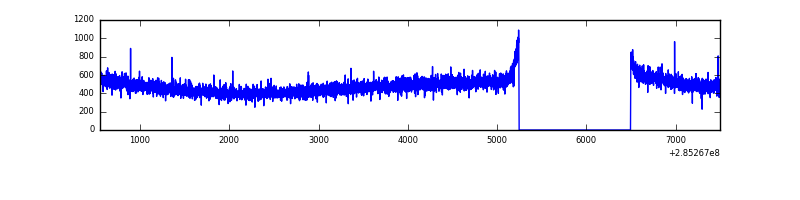 |
| D | 6944 | 5695 | 22 | 22 | 0.32% | 0.39% | 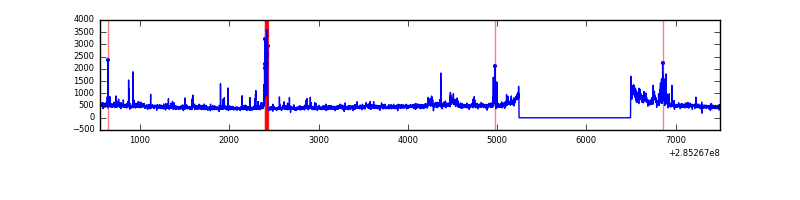 |
Top three noisy pixels from each quadrant. If the there are fewer than three noisy pixels in the level2.evt file, extra rows are filled as -1
| Pixel properties | Quadrant properties | ||||||
|---|---|---|---|---|---|---|---|
| Quadrant | DetID | PixID | Counts | Sigma | Mean | Median | Sigma |
| A | 15 | 174 | 29898 | 205.69 | 704 | 689 | 142.0 |
| A | 14 | 238 | 7088 | 45.06 | 704 | 689 | 142.0 |
| A | 0 | 226 | 6211 | 38.89 | 704 | 689 | 142.0 |
| B | 15 | 35 | 87592 | 652.59 | 710 | 696 | 133.2 |
| B | 0 | 189 | 52608 | 389.86 | 710 | 696 | 133.2 |
| B | 0 | 244 | 28964 | 212.29 | 710 | 696 | 133.2 |
| C | 14 | 238 | 106076 | 676.78 | 668 | 671 | 155.7 |
| C | 3 | 233 | 6087 | 34.77 | 668 | 671 | 155.7 |
| C | 13 | 61 | 4860 | 26.89 | 668 | 671 | 155.7 |
| D | 7 | 238 | 265747 | 1608.3 | 671 | 650 | 164.8 |
| D | 2 | 234 | 25785 | 152.49 | 671 | 650 | 164.8 |
| D | 15 | 0 | 16490 | 96.1 | 671 | 650 | 164.8 |
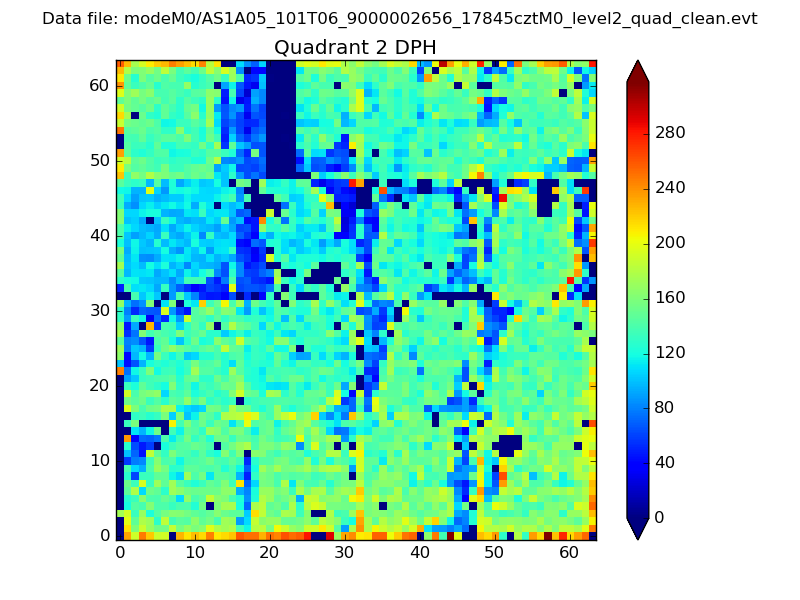
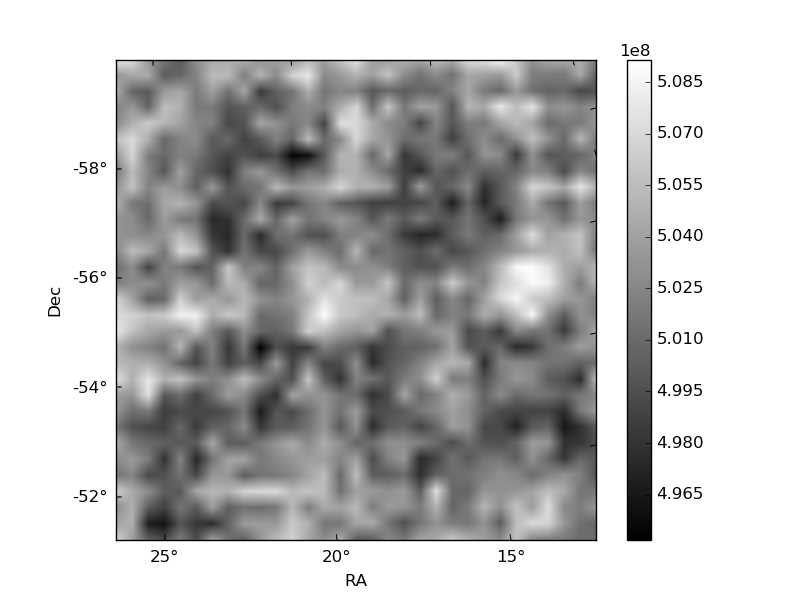
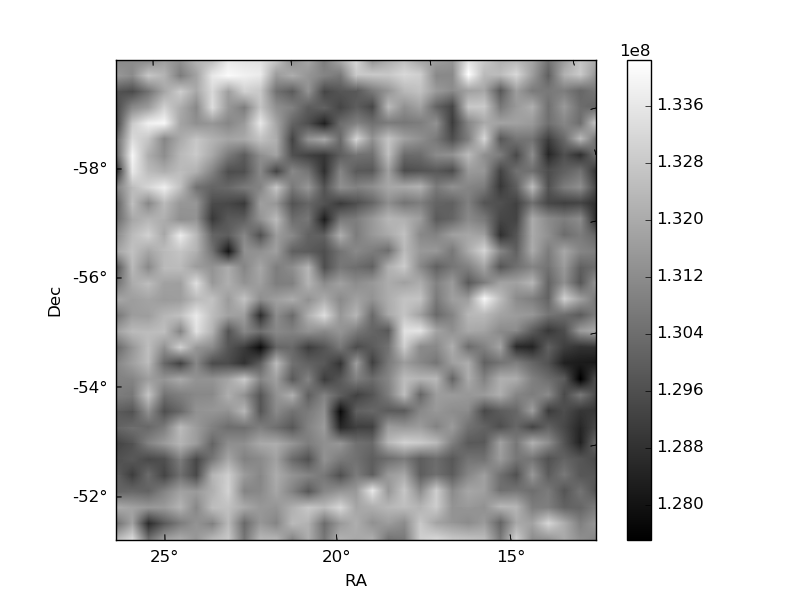
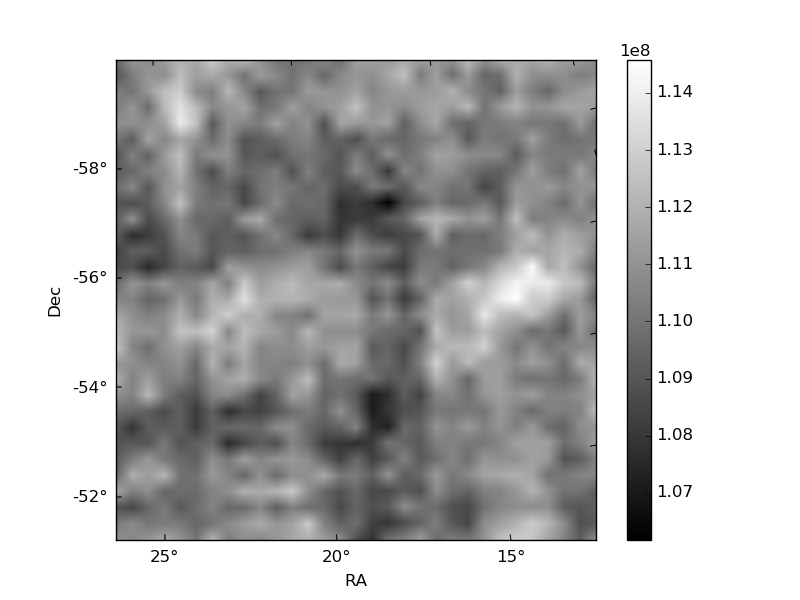
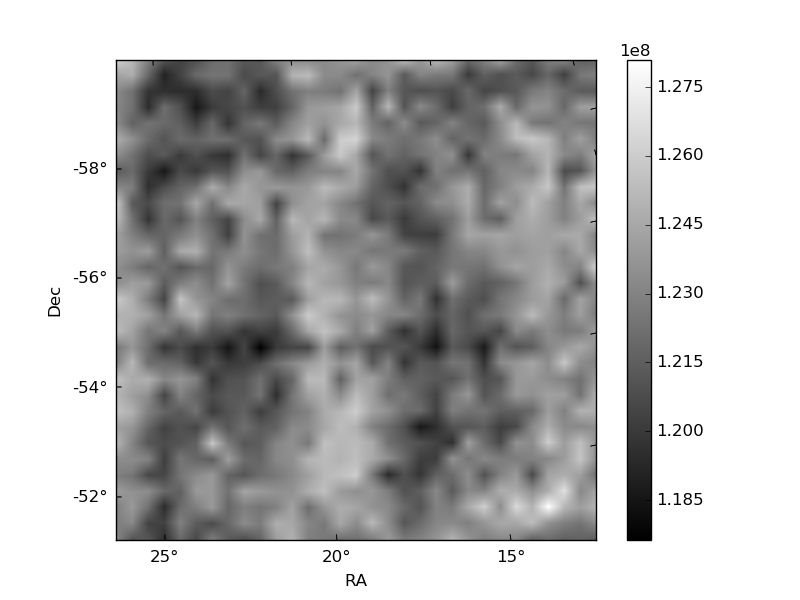
Histogram calculated using DETX and DETY for each event in the final _common_clean file
| Quadrant A | 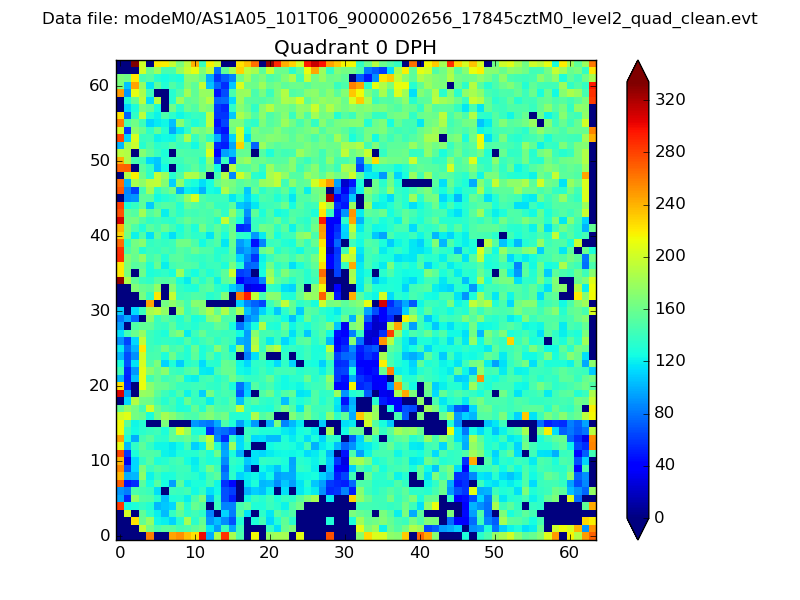 |
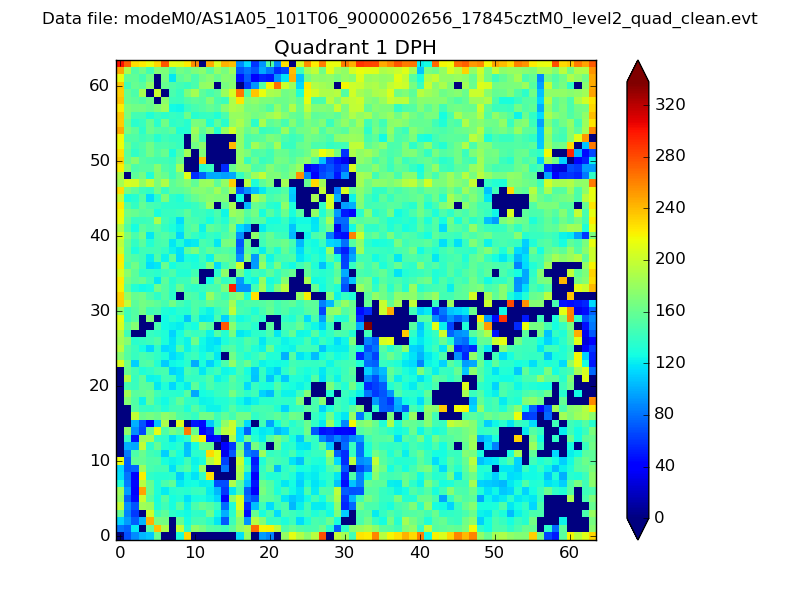 |
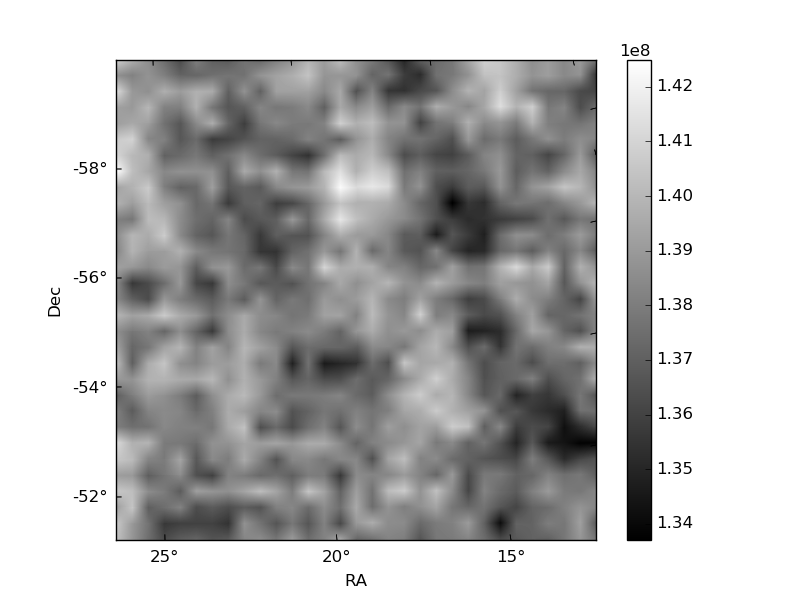
Quadrant B |
|---|---|---|---|
| Quadrant D | 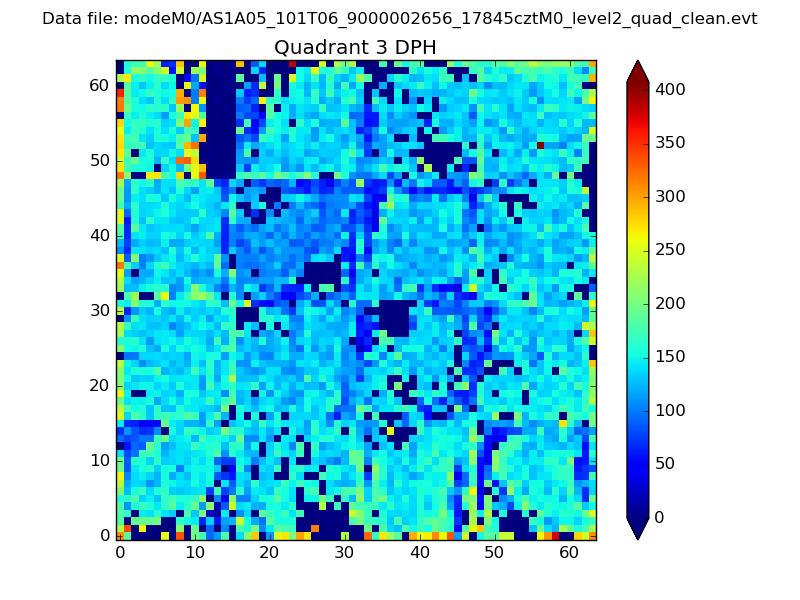 |
 |
Quadrant C |
| Plot type | Count rate plots | Images |
|---|---|---|
| Comparison with Poisson distribution Blue bars denote a histogram of data divided into 1 sec bins. Red curve is a Poisson curve with rate = median count rate of data. |
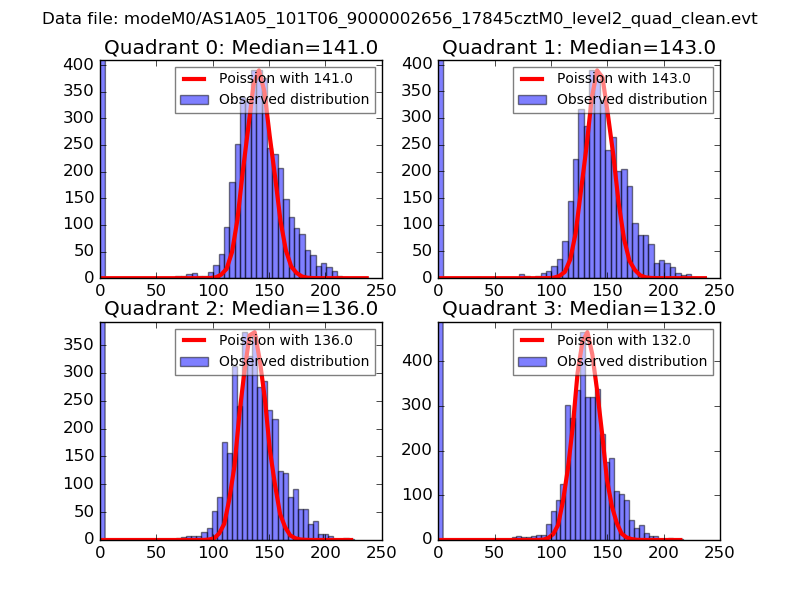 |
 |
| Quadrant-wise count rates Data is divided into 100 sec bins |
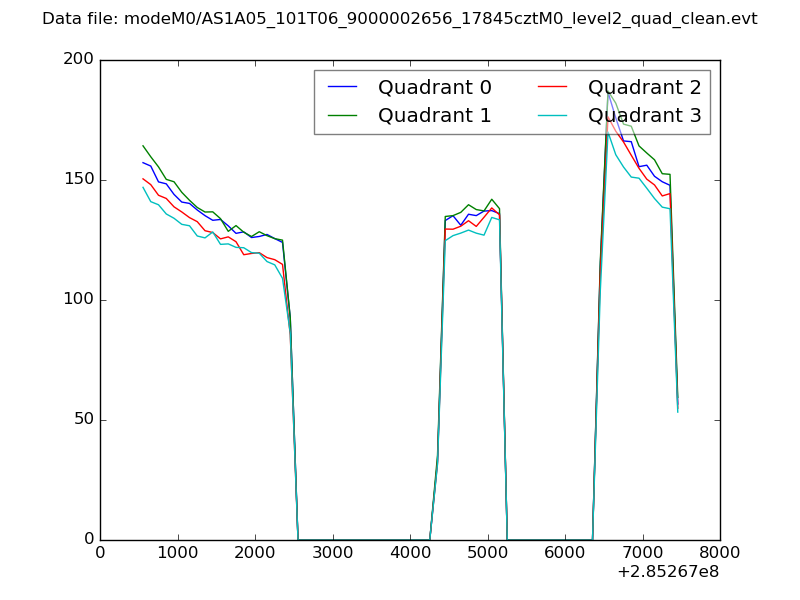 |
|
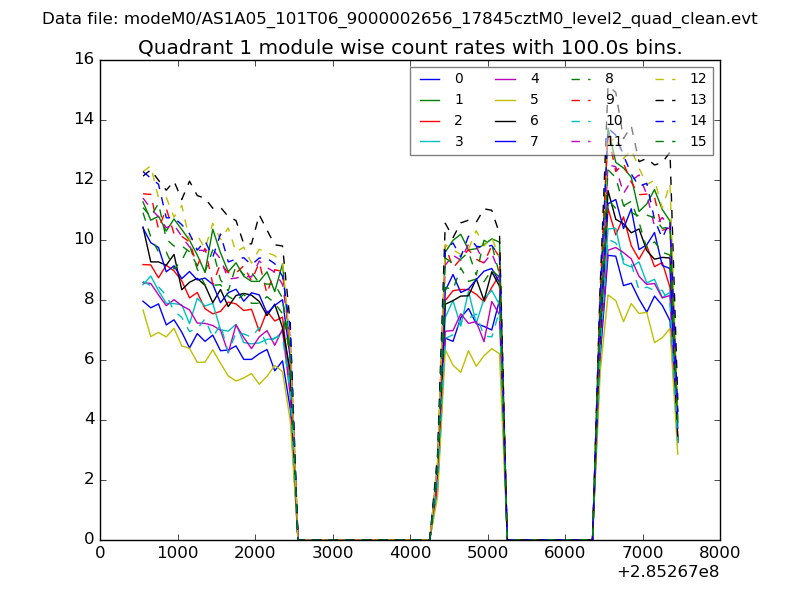
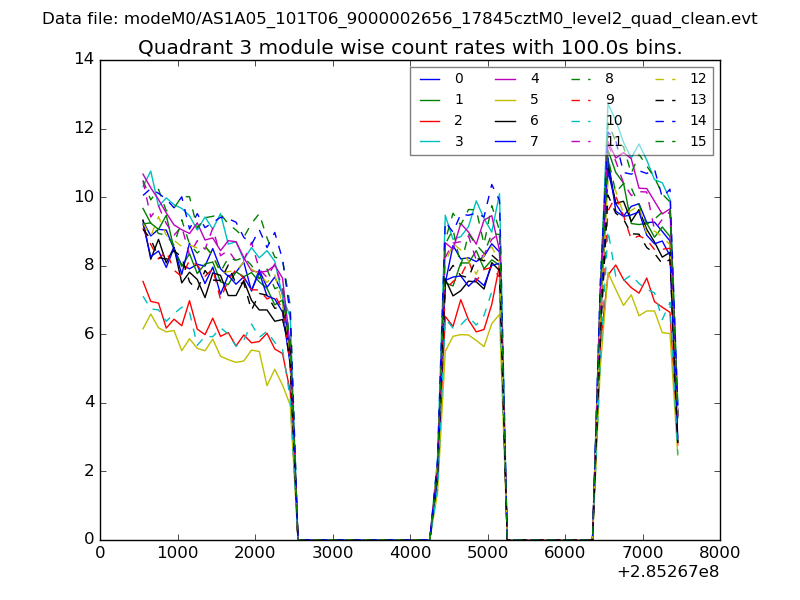
| Module-wise count rates for Quadrant A Data is divided into 100 sec bins |
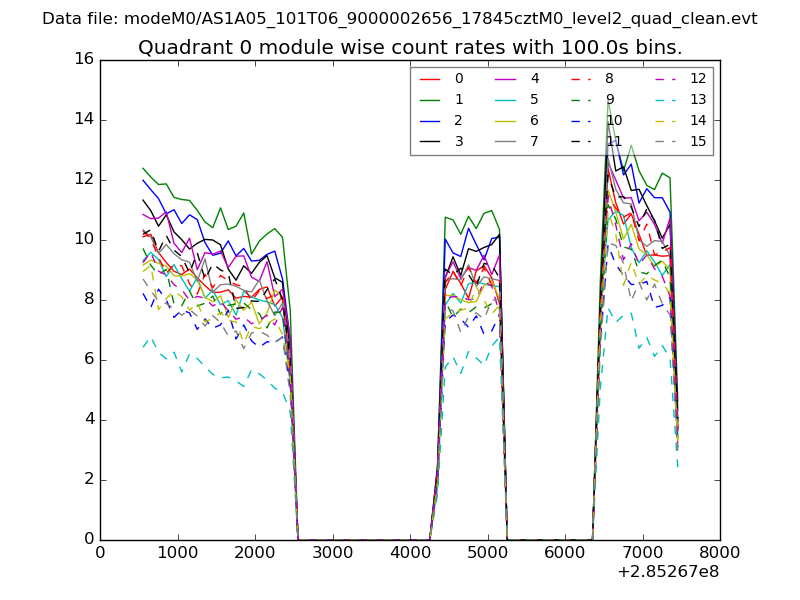 |
 |
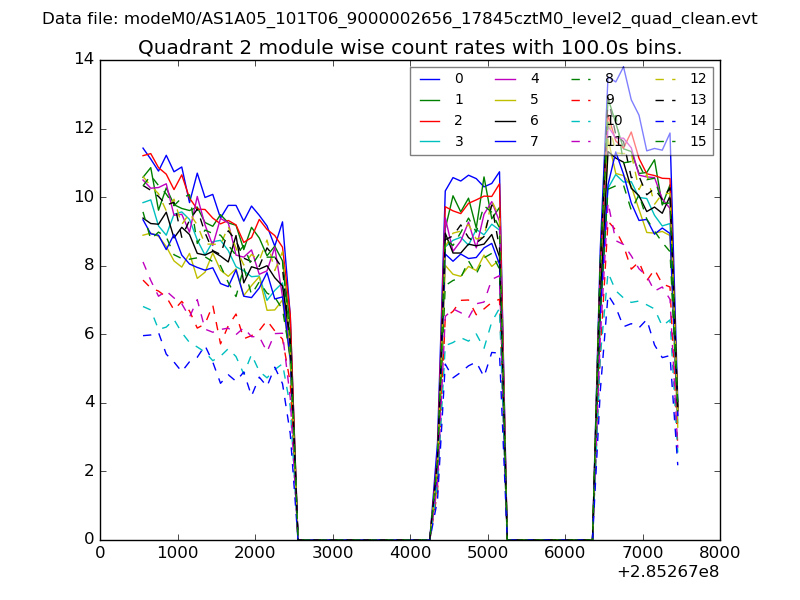
| Module-wise count rates for Quadrant B Data is divided into 100 sec bins |
 |
 |
| Module-wise count rates for Quadrant C Data is divided into 100 sec bins |
 |
 |
| Module-wise count rates for Quadrant D Data is divided into 100 sec bins |
 |
 |
| Parameter | Plot |
|---|---|
| CZT HV Monitor | 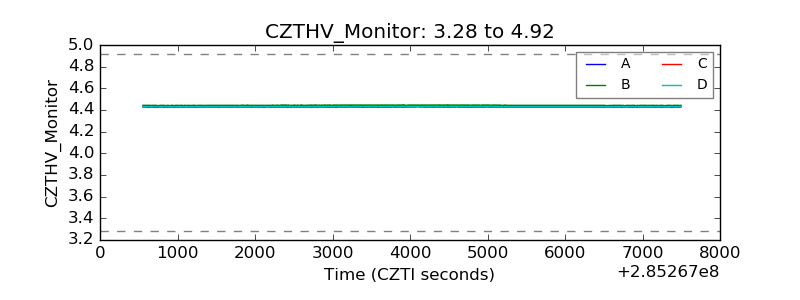 |
| D_VDD | 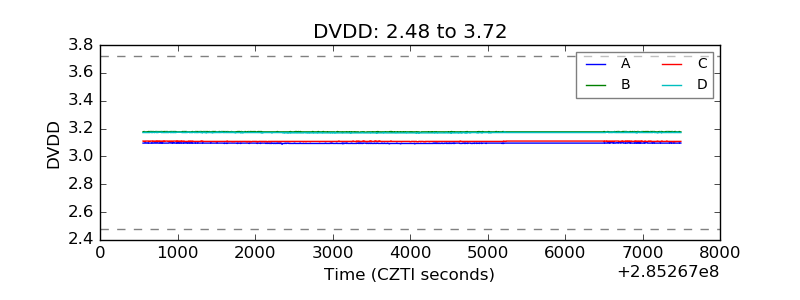 |
| Temperature 1 | 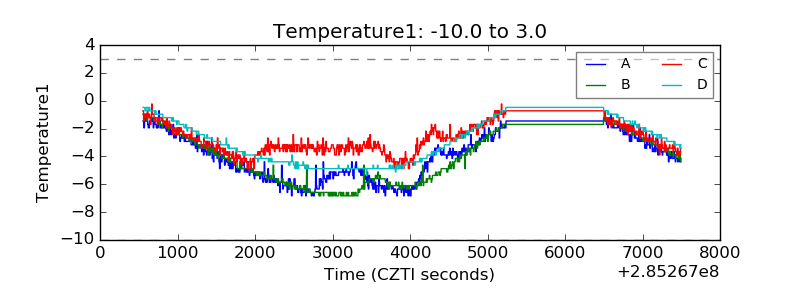 |
| Veto HV Monitor |  |
| Veto LLD | 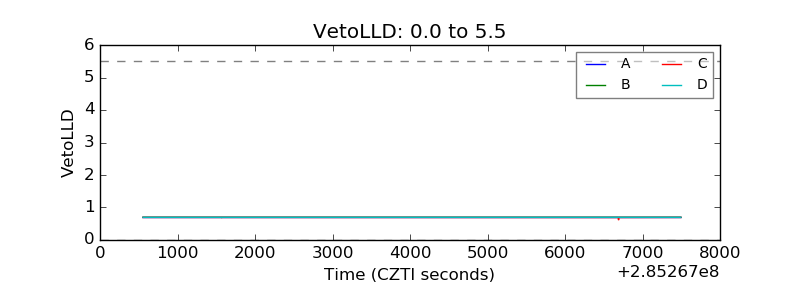 |
| Alpha Counter | 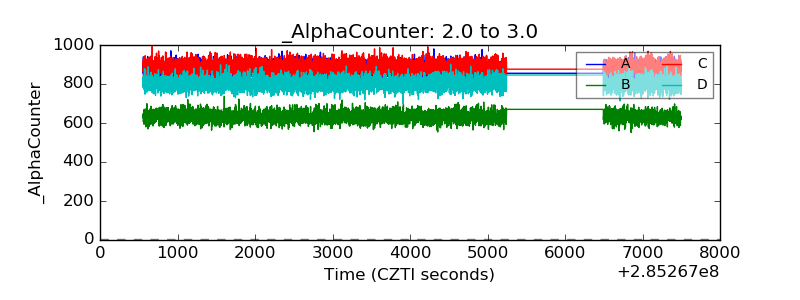 |
| _CPM_Rate |  |
| CZT Counter |  |
| +2.5 Volts monitor | 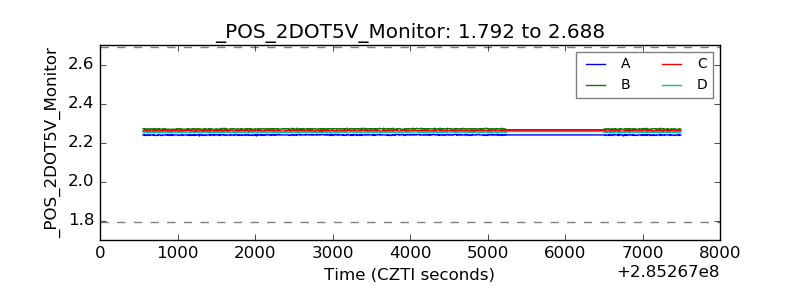 |
| +5 Volts monitor |  |
| _ROLL_ROT |  |
| _Roll_DEC | 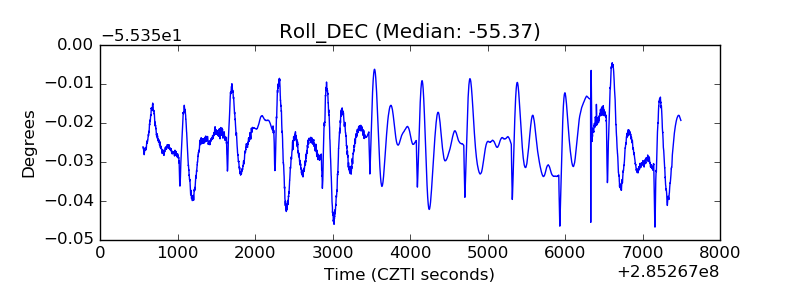 |
| _Roll_RA | 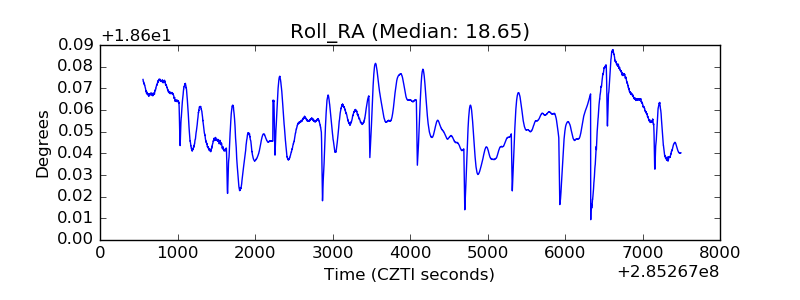 |
| Veto Counter | 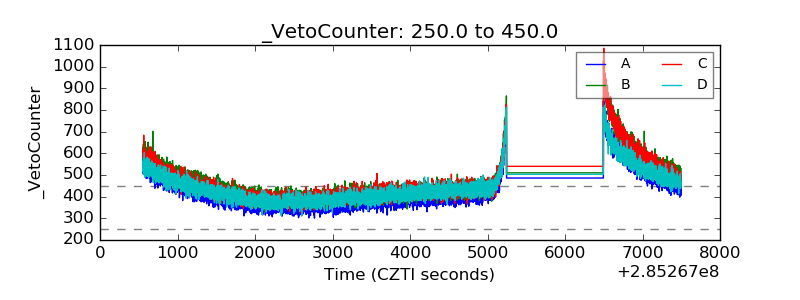 |