| Param | Original file | Final file |
|---|---|---|
| Filename | modeM0/AS1T03_061T01_9000002654cztM0_level2.fits | modeM0/AS1T03_061T01_9000002654cztM0_level2_quad_clean.evt |
| Size (bytes) | 258,926,400 | 261,204,480 |
| Size | 246.9 MB | 249.1 MB |
| Events in quadrant A | 1,564,474 | 1,567,086 |
| Events in quadrant B | 1,491,244 | 1,550,004 |
| Events in quadrant C | 1,535,028 | 1,502,663 |
| Events in quadrant D | 1,316,710 | 1,357,514 |
| Mode M9 | |||
|---|---|---|---|
| Quadrant | BADHDUFLAG | Total packets | Discarded packets |
| A | 0 | 19 | 0 |
| B | 0 | 19 | 0 |
| C | 0 | 19 | 0 |
| D | 0 | 19 | 0 |
| Mode SS | |||
|---|---|---|---|
| Quadrant | BADHDUFLAG | Total packets | Discarded packets |
| A | 0 | 572 | 0 |
| B | 0 | 572 | 0 |
| C | 0 | 572 | 0 |
| D | 0 | 572 | 0 |
| Mode M0 | |||
|---|---|---|---|
| Quadrant | BADHDUFLAG | Total packets | Discarded packets |
| A | 0 | 58065 | 0 |
| B | 0 | 61777 | 0 |
| C | 0 | 58295 | 0 |
| D | 0 | 70435 | 0 |
| Quadrant | Total seconds | Saturated seconds | Saturation percentage |
|---|---|---|---|
| A | 28115 | 548 | 1.949137% |
| B | 28115 | 1030 | 3.663525% |
| C | 28115 | 694 | 2.468433% |
| D | 28115 | 1555 | 5.530855% |
Noise dominated data is calculated using 1-second bins in cleaned event files. If a bin has >2000 counts, and if more than 50% of those come from <1% of pixels, then it is considered to be noise-dominated and hence unusable.
| Quadrant | # 1 sec bins | Bins with >0 counts | Bins with >2000 counts | High rate bins dominated by noise | Noise dominated (total time) | Noise dominated (detector-on time) | Marked lightcurve |
|---|---|---|---|---|---|---|---|
| A | 30000 | 28113 | 0 | 0 | 0.00% | 0.00% | 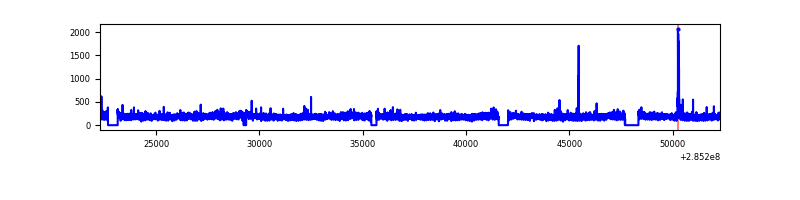 |
| B | 30000 | 28112 | 0 | 0 | 0.00% | 0.00% |  |
| C | 30000 | 28114 | 0 | 0 | 0.00% | 0.00% |  |
| D | 30000 | 28102 | 0 | 0 | 0.00% | 0.00% |  |
Top three noisy pixels from each quadrant. If the there are fewer than three noisy pixels in the level2.evt file, extra rows are filled as -1
| Pixel properties | Quadrant properties | ||||||
|---|---|---|---|---|---|---|---|
| Quadrant | DetID | PixID | Counts | Sigma | Mean | Median | Sigma |
| A | 0 | 29 | 1499 | 10.69 | 406 | 378 | 104.9 |
| A | 7 | 110 | 1326 | 9.04 | 406 | 378 | 104.9 |
| A | 9 | 19 | 1179 | 7.64 | 406 | 378 | 104.9 |
| B | 2 | 9 | 1153 | 9.5 | 393 | 373 | 82.1 |
| B | 3 | 17 | 1045 | 8.19 | 393 | 373 | 82.1 |
| B | 5 | 232 | 1023 | 7.92 | 393 | 373 | 82.1 |
| C | 1 | 81 | 1180 | 7.68 | 405 | 376 | 104.7 |
| C | 1 | 80 | 1161 | 7.49 | 405 | 376 | 104.7 |
| C | 3 | 126 | 1073 | 6.65 | 405 | 376 | 104.7 |
| D | 6 | 231 | 977 | 6.3 | 374 | 340 | 101.1 |
| D | 3 | 14 | 954 | 6.07 | 374 | 340 | 101.1 |
| D | 3 | 31 | 937 | 5.9 | 374 | 340 | 101.1 |
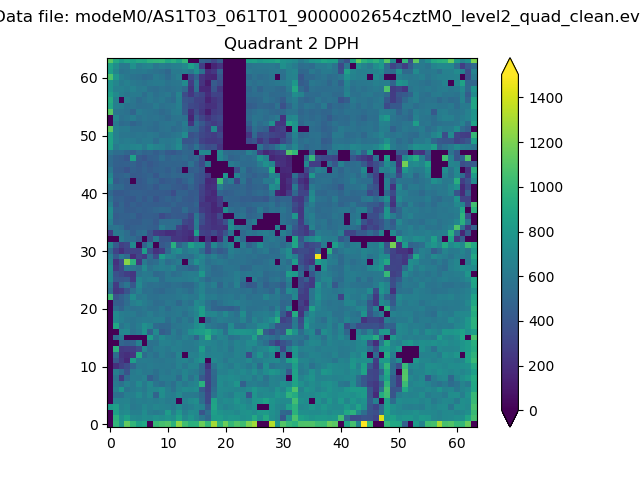
Histogram calculated using DETX and DETY for each event in the final _common_clean file
| Quadrant A | 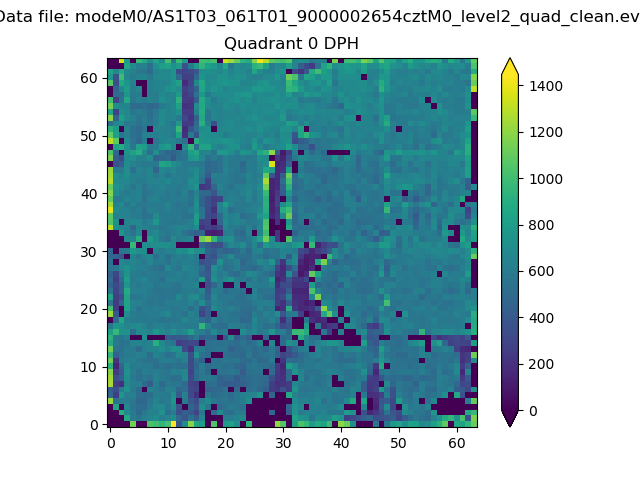 |
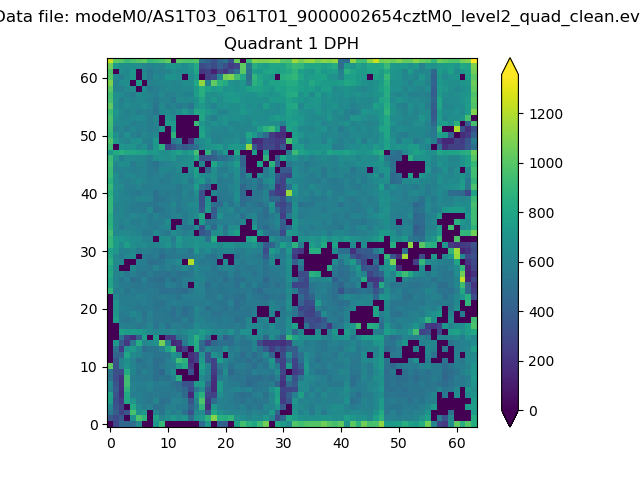 |
Quadrant B |
|---|---|---|---|
| Quadrant D | 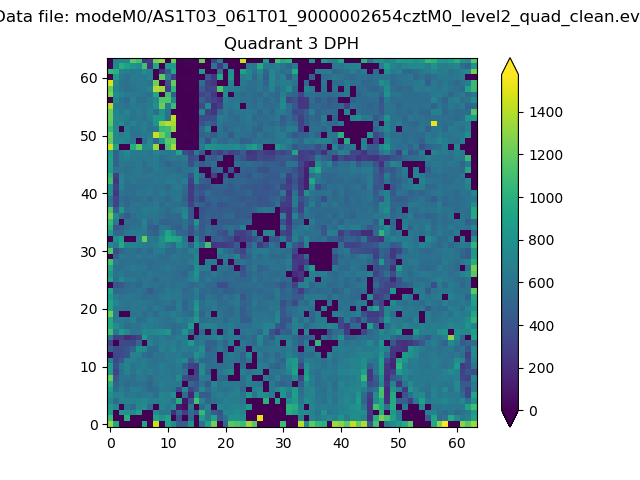 |
 |
Quadrant C |
| Plot type | Count rate plots | Images |
|---|---|---|
| Comparison with Poisson distribution Blue bars denote a histogram of data divided into 1 sec bins. Red curve is a Poisson curve with rate = median count rate of data. |
 |
 |
| Quadrant-wise count rates Data is divided into 100 sec bins |
 |
|
| Module-wise count rates for Quadrant A Data is divided into 100 sec bins |
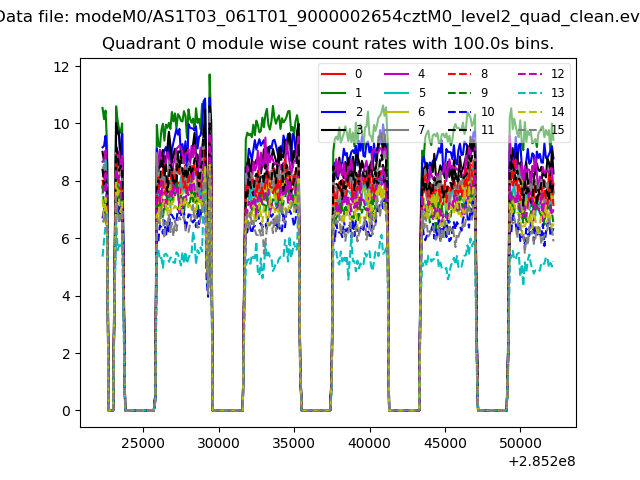 |
 |
| Module-wise count rates for Quadrant B Data is divided into 100 sec bins |
 |
 |
| Module-wise count rates for Quadrant C Data is divided into 100 sec bins |
 |
 |
| Module-wise count rates for Quadrant D Data is divided into 100 sec bins |
 |
 |
| Parameter | Plot |
|---|---|
| CZT HV Monitor |  |
| D_VDD |  |
| Temperature 1 |  |
| Veto HV Monitor |  |
| Veto LLD | 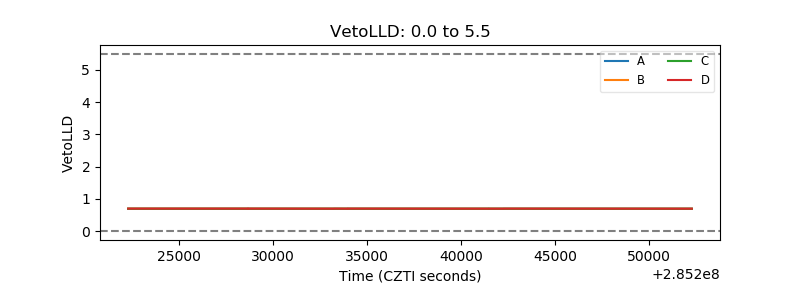 |
| Alpha Counter |  |
| _CPM_Rate | 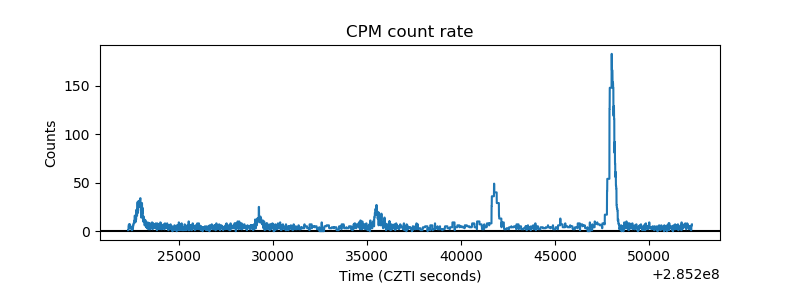 |
| CZT Counter |  |
| +2.5 Volts monitor | 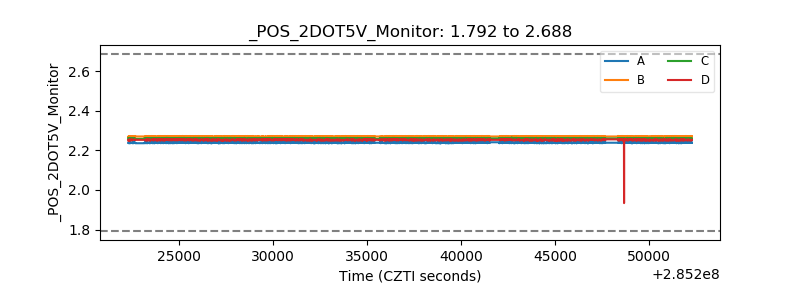 |
| +5 Volts monitor |  |
| _ROLL_ROT |  |
| _Roll_DEC | 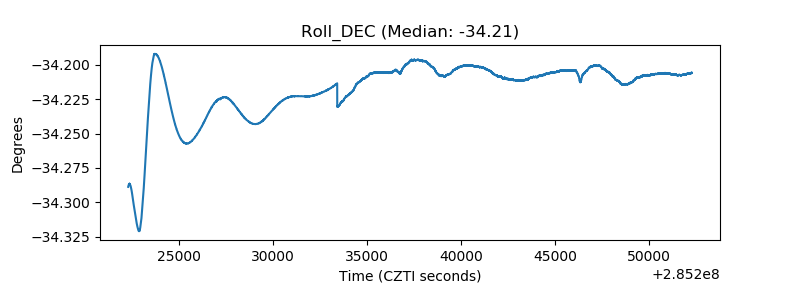 |
| _Roll_RA |  |
| Veto Counter |  |