| Param | Original file | Final file |
|---|---|---|
| Filename | modeM0/AS1T03_061T01_9000002654_17840cztM0_level2.evt | modeM0/AS1T03_061T01_9000002654_17840cztM0_level2_quad_clean.evt |
| Size (bytes) | 1,017,685,440 | 168,448,320 |
| Size | 970.5 MB | 160.6 MB |
| Events in quadrant A | 6,418,302 | 1,062,160 |
| Events in quadrant B | 7,072,893 | 1,062,243 |
| Events in quadrant C | 6,603,837 | 1,033,931 |
| Events in quadrant D | 9,792,241 | 990,571 |
| Mode M9 | |||
|---|---|---|---|
| Quadrant | BADHDUFLAG | Total packets | Discarded packets |
| A | 0 | 13 | 0 |
| B | 0 | 13 | 0 |
| C | 0 | 13 | 0 |
| D | 0 | 13 | 0 |
| Mode SS | |||
|---|---|---|---|
| Quadrant | BADHDUFLAG | Total packets | Discarded packets |
| A | 0 | 284 | 0 |
| B | 0 | 284 | 0 |
| C | 0 | 284 | 0 |
| D | 0 | 284 | 0 |
| Mode M0 | |||
|---|---|---|---|
| Quadrant | BADHDUFLAG | Total packets | Discarded packets |
| A | 0 | 28401 | 3 |
| B | 0 | 30054 | 3 |
| C | 0 | 28507 | 3 |
| D | 0 | 38868 | 3 |
| Quadrant | Total seconds | Saturated seconds | Saturation percentage |
|---|---|---|---|
| A | 13783 | 318 | 2.307190% |
| B | 13783 | 559 | 4.055721% |
| C | 13783 | 380 | 2.757020% |
| D | 13783 | 1235 | 8.960313% |
Noise dominated data is calculated using 1-second bins in cleaned event files. If a bin has >2000 counts, and if more than 50% of those come from <1% of pixels, then it is considered to be noise-dominated and hence unusable.
| Quadrant | # 1 sec bins | Bins with >0 counts | Bins with >2000 counts | High rate bins dominated by noise | Noise dominated (total time) | Noise dominated (detector-on time) | Marked lightcurve |
|---|---|---|---|---|---|---|---|
| A | 15123 | 13784 | 2 | 2 | 0.01% | 0.01% | 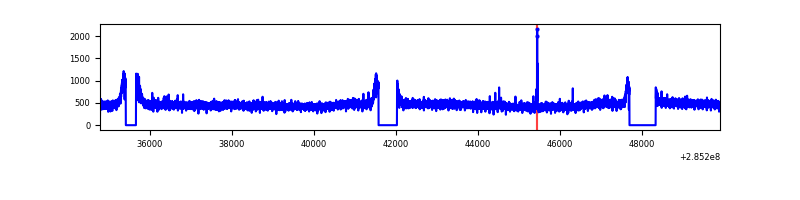 |
| B | 15123 | 13784 | 131 | 131 | 0.87% | 0.95% | 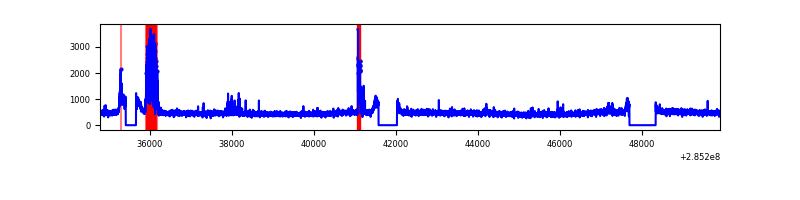 |
| C | 15123 | 13784 | 0 | 0 | 0.00% | 0.00% | 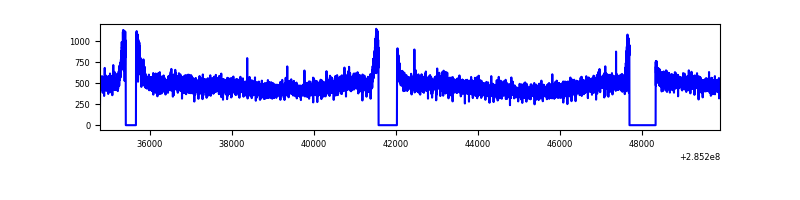 |
| D | 15123 | 13784 | 697 | 697 | 4.61% | 5.06% | 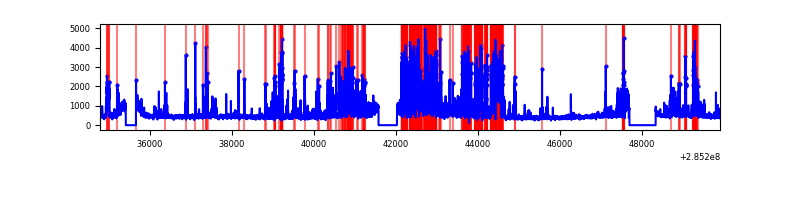 |
Top three noisy pixels from each quadrant. If the there are fewer than three noisy pixels in the level2.evt file, extra rows are filled as -1
| Pixel properties | Quadrant properties | ||||||
|---|---|---|---|---|---|---|---|
| Quadrant | DetID | PixID | Counts | Sigma | Mean | Median | Sigma |
| A | 15 | 174 | 22180 | 60.79 | 1665 | 1627 | 338.1 |
| A | 0 | 226 | 14331 | 37.58 | 1665 | 1627 | 338.1 |
| A | 3 | 137 | 13230 | 34.32 | 1665 | 1627 | 338.1 |
| B | 15 | 222 | 469337 | 1466.74 | 1650 | 1608 | 318.9 |
| B | 15 | 33 | 98496 | 303.83 | 1650 | 1608 | 318.9 |
| B | 12 | 111 | 39667 | 119.35 | 1650 | 1608 | 318.9 |
| C | 14 | 238 | 245377 | 640.99 | 1606 | 1617 | 380.3 |
| C | 13 | 62 | 42414 | 107.28 | 1606 | 1617 | 380.3 |
| C | 5 | 218 | 24861 | 61.12 | 1606 | 1617 | 380.3 |
| D | 7 | 238 | 3652111 | 9469.73 | 1581 | 1533 | 385.5 |
| D | 10 | 70 | 69295 | 175.78 | 1581 | 1533 | 385.5 |
| D | 2 | 234 | 59101 | 149.33 | 1581 | 1533 | 385.5 |
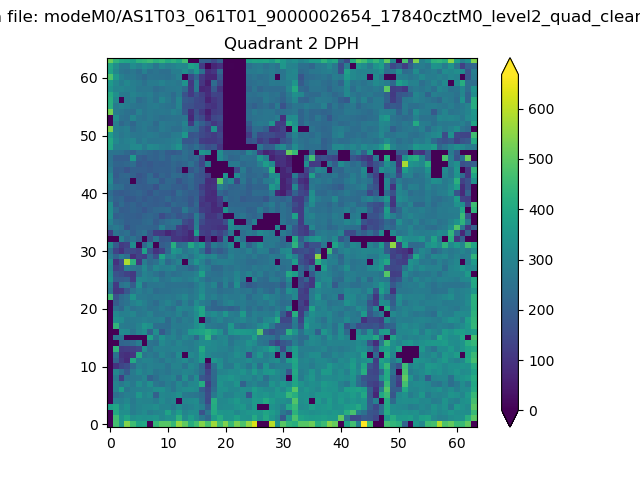
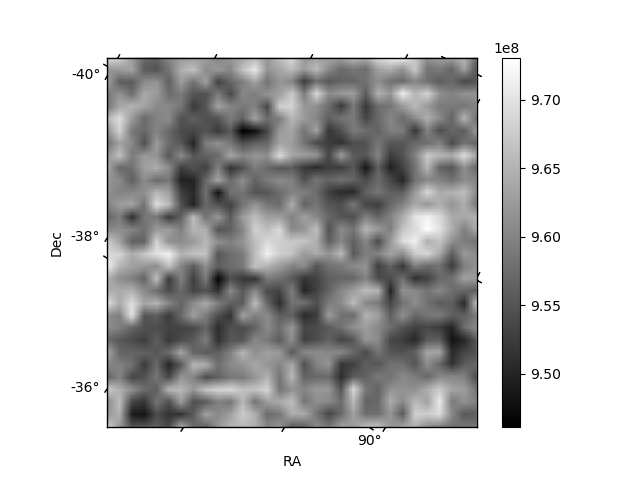
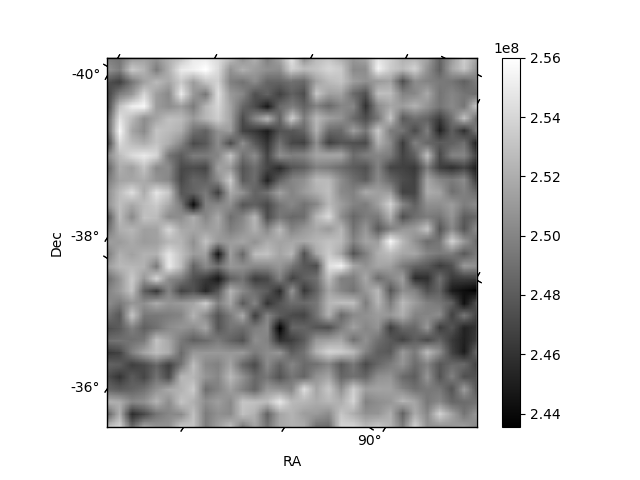
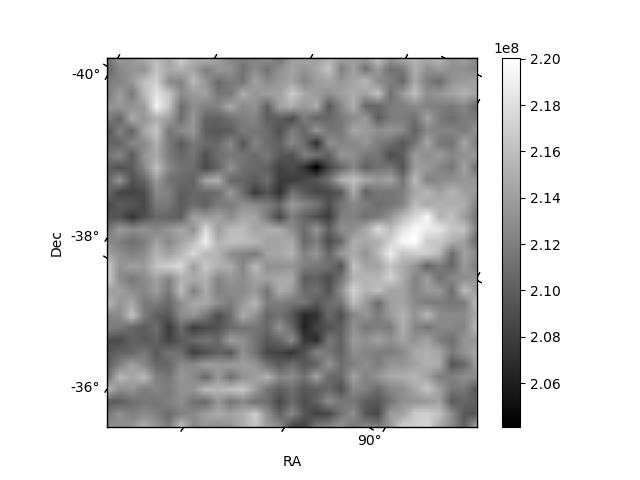
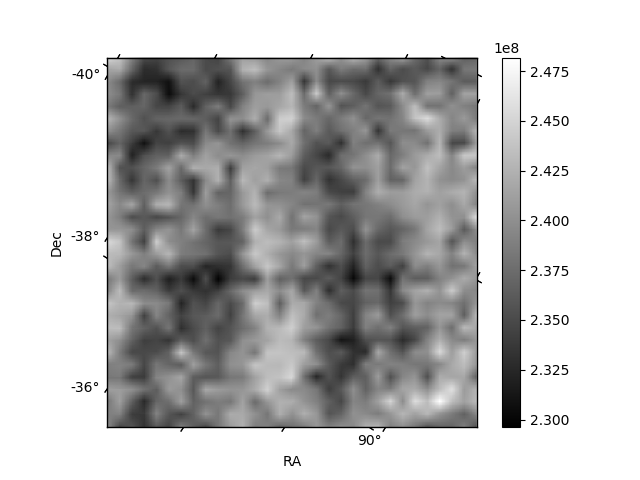
Histogram calculated using DETX and DETY for each event in the final _common_clean file
| Quadrant A | 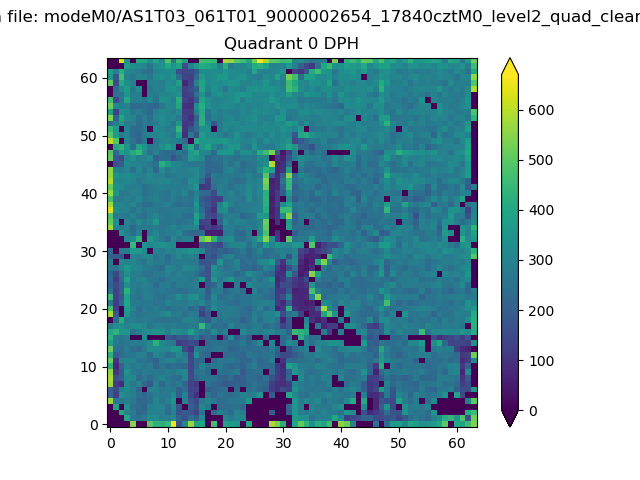 |
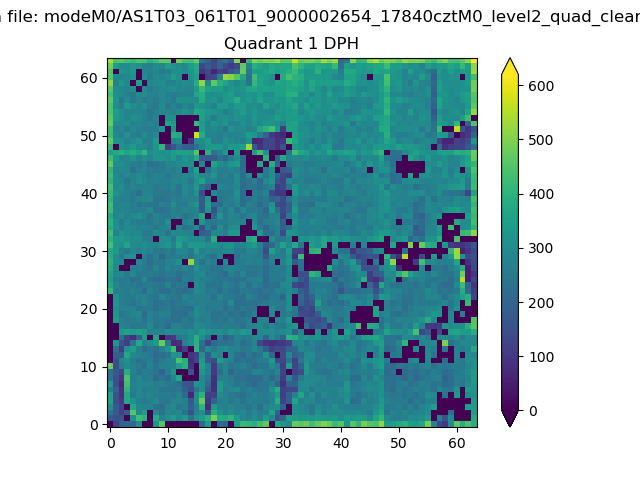 |
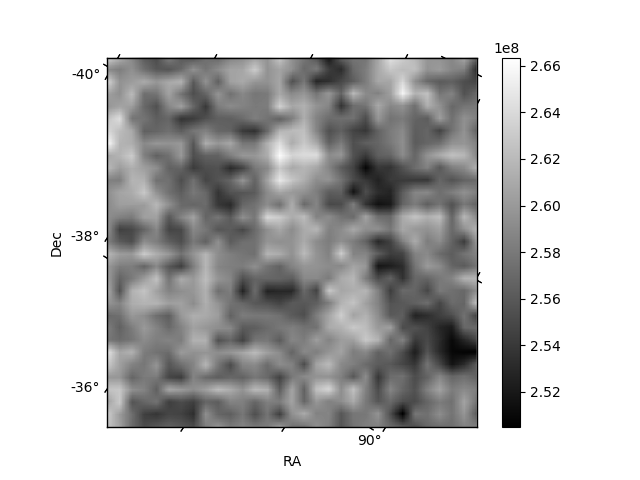
Quadrant B |
|---|---|---|---|
| Quadrant D | 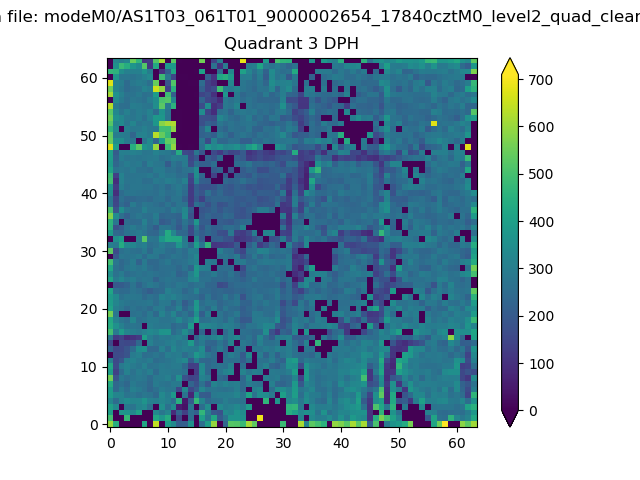 |
 |
Quadrant C |
| Plot type | Count rate plots | Images |
|---|---|---|
| Comparison with Poisson distribution Blue bars denote a histogram of data divided into 1 sec bins. Red curve is a Poisson curve with rate = median count rate of data. |
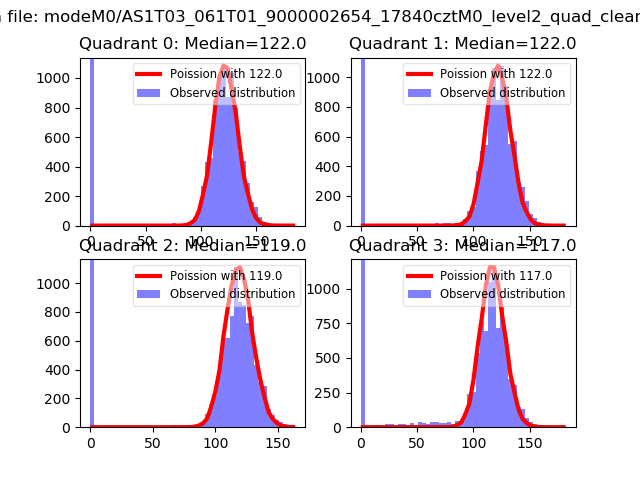 |
 |
| Quadrant-wise count rates Data is divided into 100 sec bins |
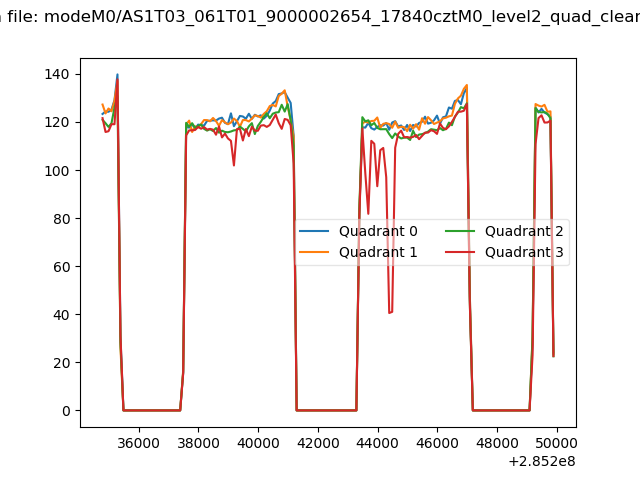 |
|
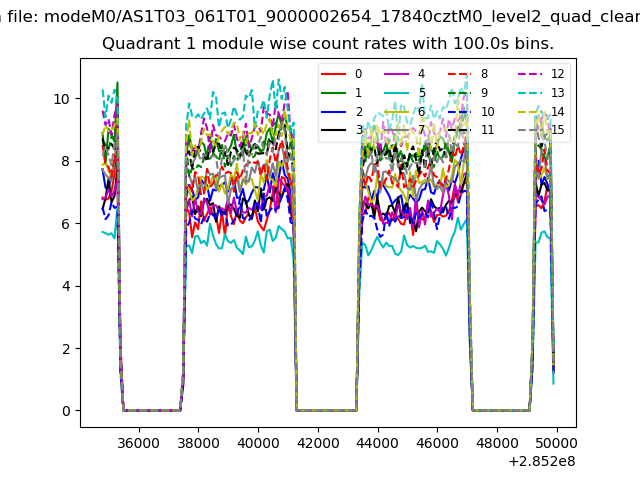
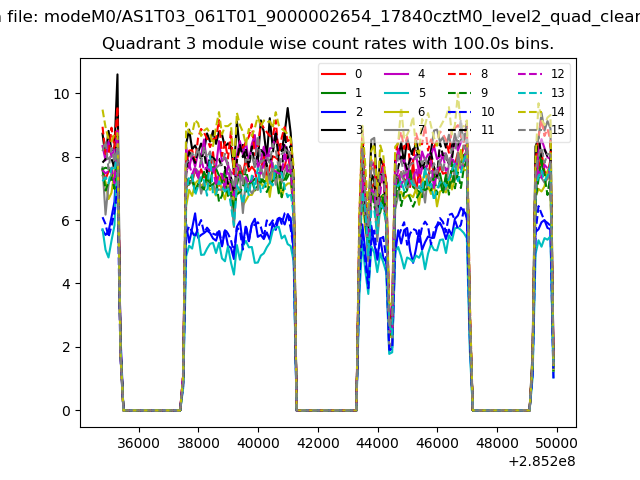
| Module-wise count rates for Quadrant A Data is divided into 100 sec bins |
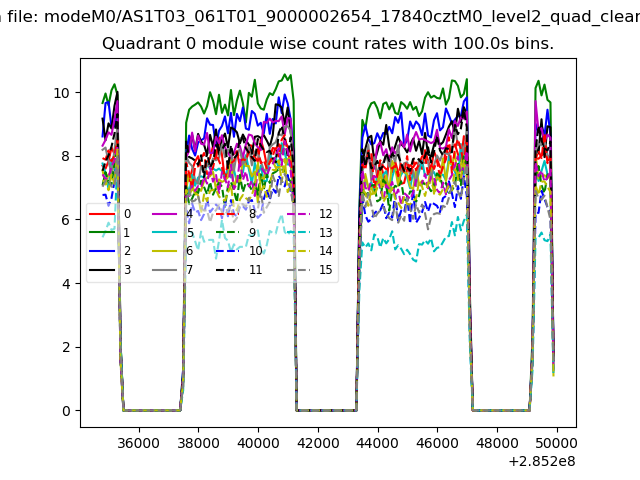 |
 |
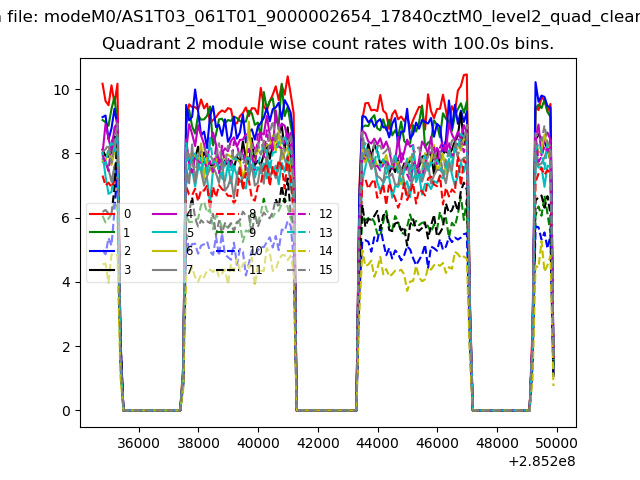
| Module-wise count rates for Quadrant B Data is divided into 100 sec bins |
 |
 |
| Module-wise count rates for Quadrant C Data is divided into 100 sec bins |
 |
 |
| Module-wise count rates for Quadrant D Data is divided into 100 sec bins |
 |
 |
| Parameter | Plot |
|---|---|
| CZT HV Monitor | 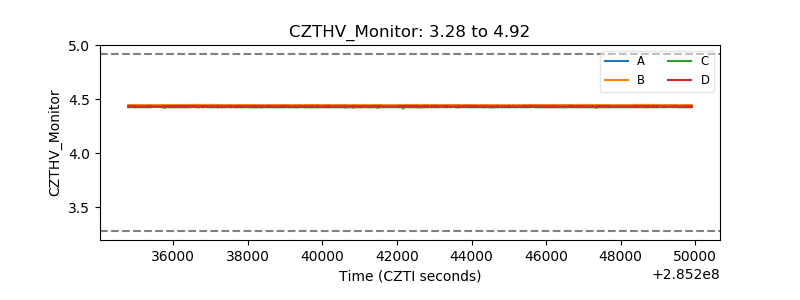 |
| D_VDD | 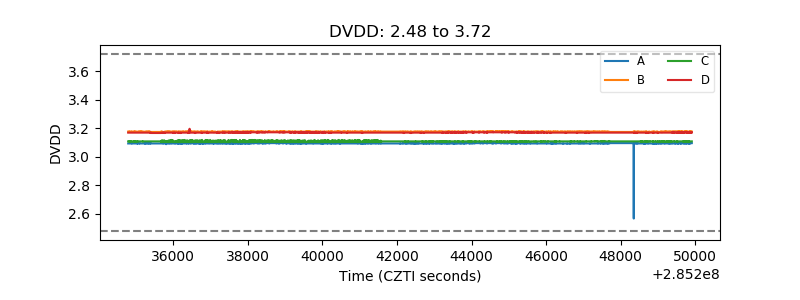 |
| Temperature 1 | 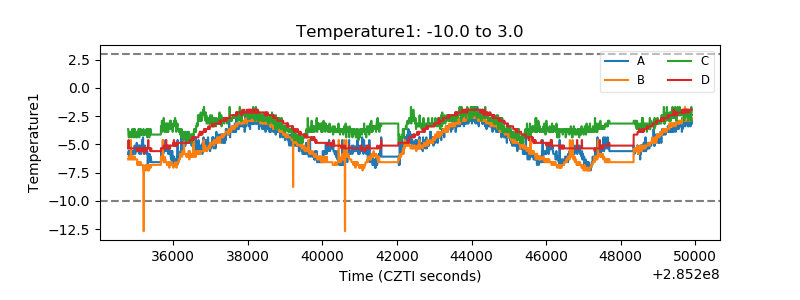 |
| Veto HV Monitor |  |
| Veto LLD | 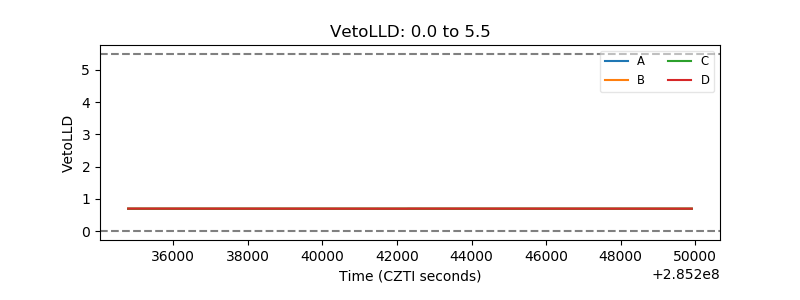 |
| Alpha Counter | 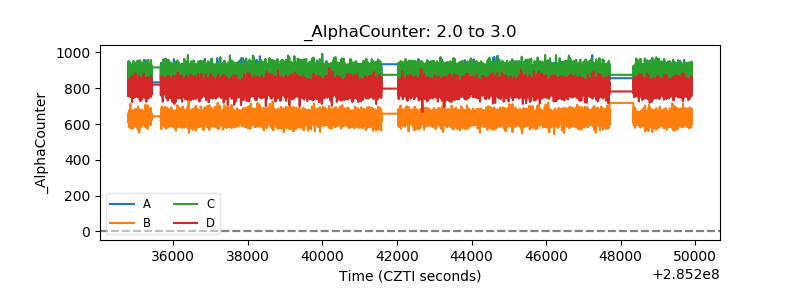 |
| _CPM_Rate | 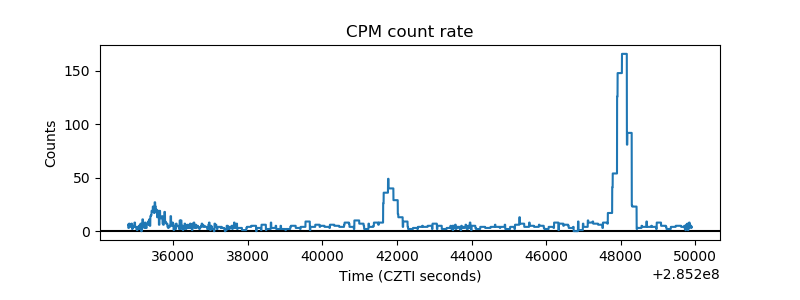 |
| CZT Counter | 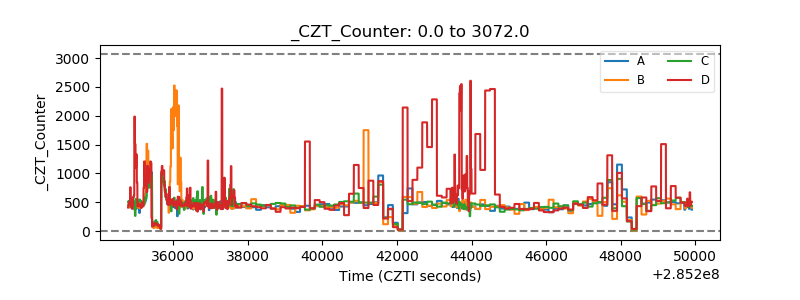 |
| +2.5 Volts monitor |  |
| +5 Volts monitor |  |
| _ROLL_ROT | 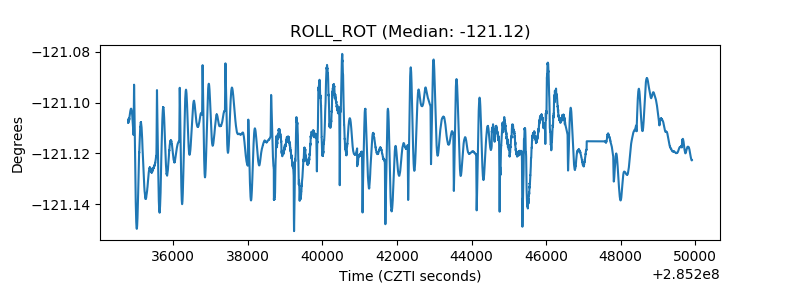 |
| _Roll_DEC | 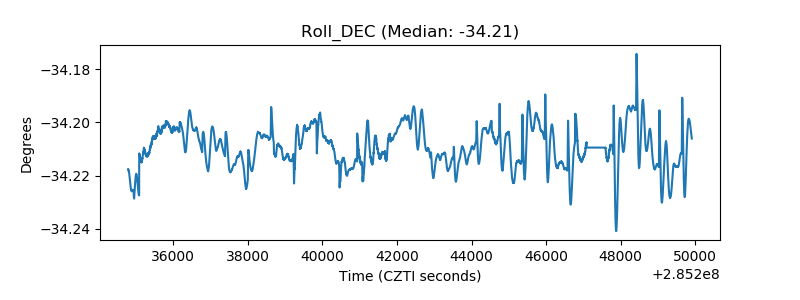 |
| _Roll_RA | 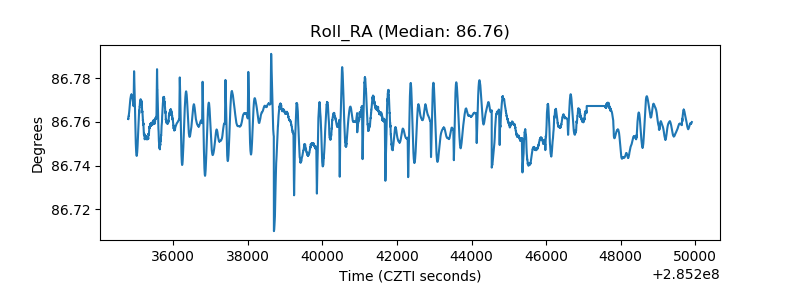 |
| Veto Counter | 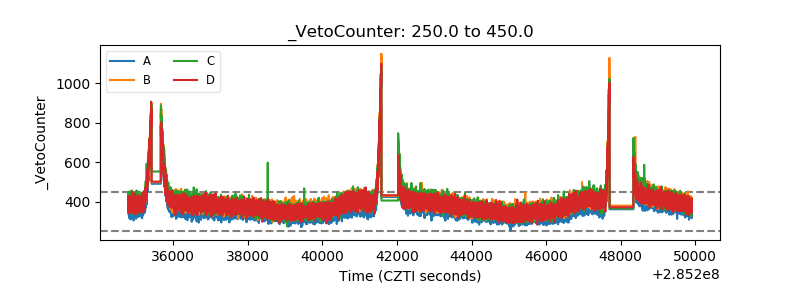 |