| Param | Original file | Final file |
|---|---|---|
| Filename | modeM0/AS1T03_061T01_9000002654_17841cztM0_level2.evt | modeM0/AS1T03_061T01_9000002654_17841cztM0_level2_quad_clean.evt |
| Size (bytes) | 233,259,840 | 55,621,440 |
| Size | 222.5 MB | 53.0 MB |
| Events in quadrant A | 1,661,208 | 360,769 |
| Events in quadrant B | 1,627,031 | 361,763 |
| Events in quadrant C | 1,601,610 | 353,884 |
| Events in quadrant D | 1,922,516 | 347,551 |
| Mode SS | |||
|---|---|---|---|
| Quadrant | BADHDUFLAG | Total packets | Discarded packets |
| A | 0 | 74 | 0 |
| B | 0 | 74 | 0 |
| C | 0 | 74 | 0 |
| D | 0 | 74 | 0 |
| Mode M0 | |||
|---|---|---|---|
| Quadrant | BADHDUFLAG | Total packets | Discarded packets |
| A | 0 | 7537 | 0 |
| B | 0 | 7404 | 0 |
| C | 0 | 7371 | 0 |
| D | 0 | 8486 | 0 |
| Quadrant | Total seconds | Saturated seconds | Saturation percentage |
|---|---|---|---|
| A | 3675 | 17 | 0.462585% |
| B | 3675 | 4 | 0.108844% |
| C | 3675 | 5 | 0.136054% |
| D | 3675 | 65 | 1.768707% |
Noise dominated data is calculated using 1-second bins in cleaned event files. If a bin has >2000 counts, and if more than 50% of those come from <1% of pixels, then it is considered to be noise-dominated and hence unusable.
| Quadrant | # 1 sec bins | Bins with >0 counts | Bins with >2000 counts | High rate bins dominated by noise | Noise dominated (total time) | Noise dominated (detector-on time) | Marked lightcurve |
|---|---|---|---|---|---|---|---|
| A | 3675 | 3675 | 12 | 12 | 0.33% | 0.33% | 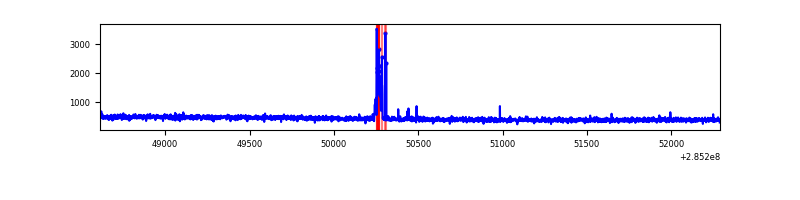 |
| B | 3675 | 3675 | 1 | 1 | 0.03% | 0.03% | 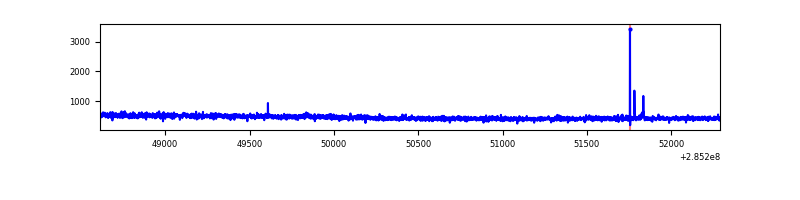 |
| C | 3675 | 3675 | 0 | 0 | 0.00% | 0.00% | 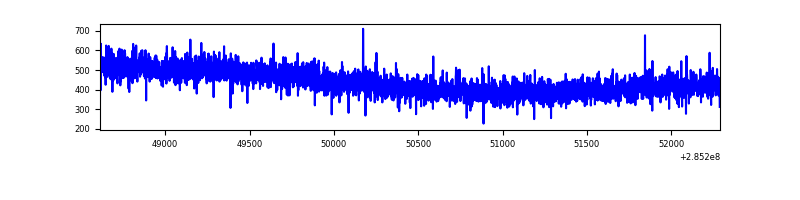 |
| D | 3675 | 3675 | 50 | 50 | 1.36% | 1.36% | 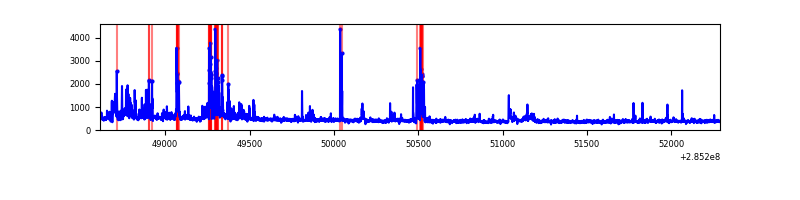 |
Top three noisy pixels from each quadrant. If the there are fewer than three noisy pixels in the level2.evt file, extra rows are filled as -1
| Pixel properties | Quadrant properties | ||||||
|---|---|---|---|---|---|---|---|
| Quadrant | DetID | PixID | Counts | Sigma | Mean | Median | Sigma |
| A | 15 | 174 | 63062 | 735.56 | 415 | 407 | 85.2 |
| A | 0 | 226 | 3606 | 37.56 | 415 | 407 | 85.2 |
| A | 3 | 137 | 3229 | 33.13 | 415 | 407 | 85.2 |
| B | 12 | 111 | 9856 | 116.4 | 413 | 403 | 81.2 |
| B | 11 | 111 | 8367 | 98.07 | 413 | 403 | 81.2 |
| B | 14 | 111 | 7171 | 83.34 | 413 | 403 | 81.2 |
| C | 14 | 238 | 60608 | 643.37 | 392 | 395 | 93.6 |
| C | 3 | 233 | 6053 | 60.45 | 392 | 395 | 93.6 |
| C | 5 | 218 | 4129 | 39.9 | 392 | 395 | 93.6 |
| D | 7 | 238 | 383223 | 3871.22 | 397 | 384 | 98.9 |
| D | 10 | 70 | 21879 | 217.35 | 397 | 384 | 98.9 |
| D | 2 | 234 | 16856 | 166.56 | 397 | 384 | 98.9 |
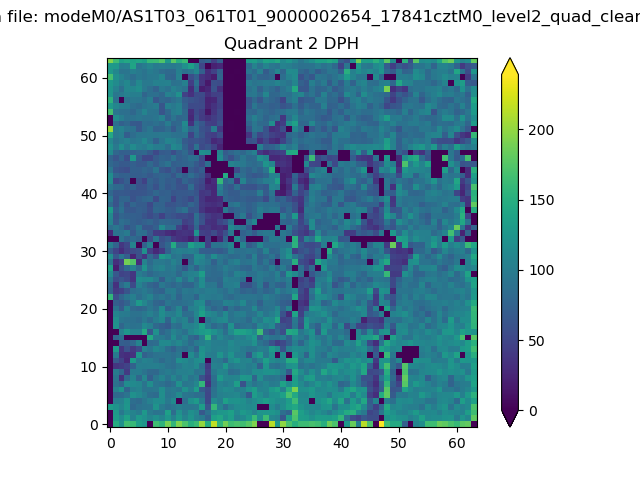
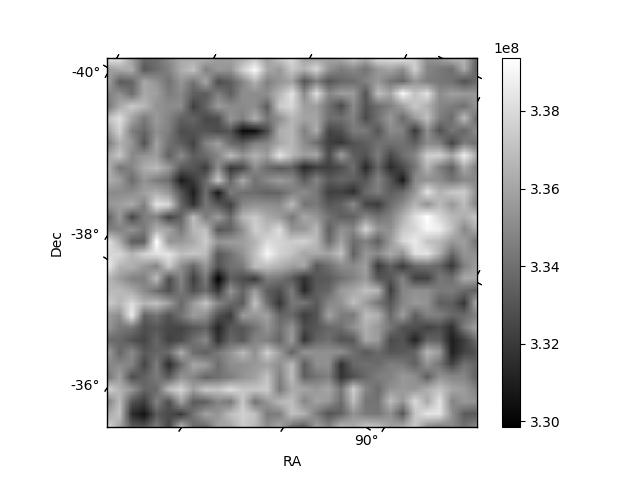
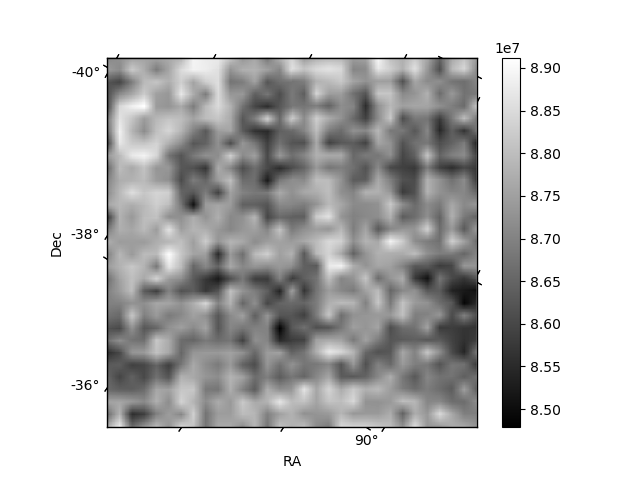
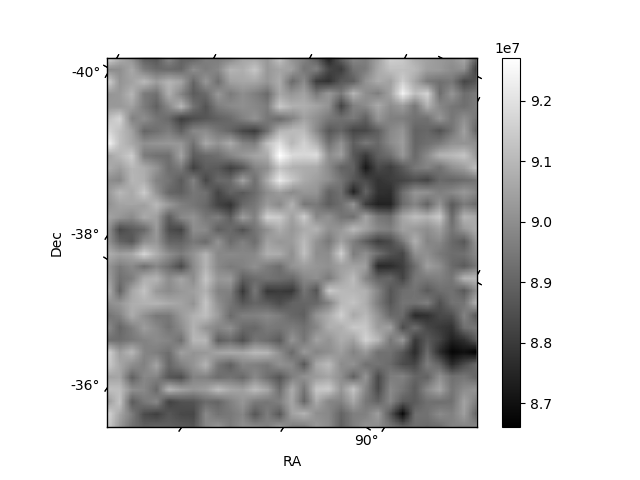
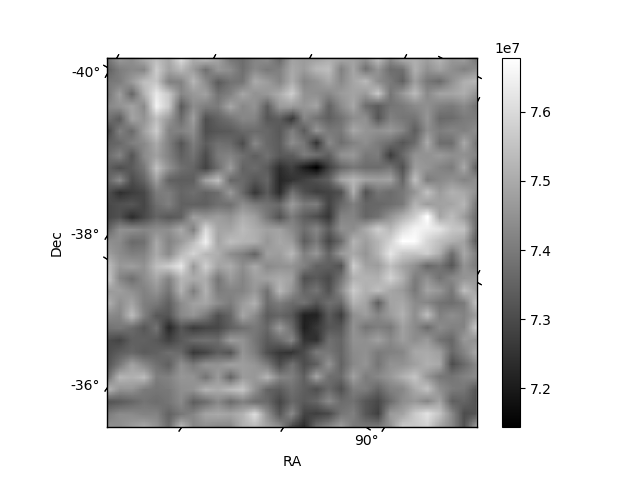
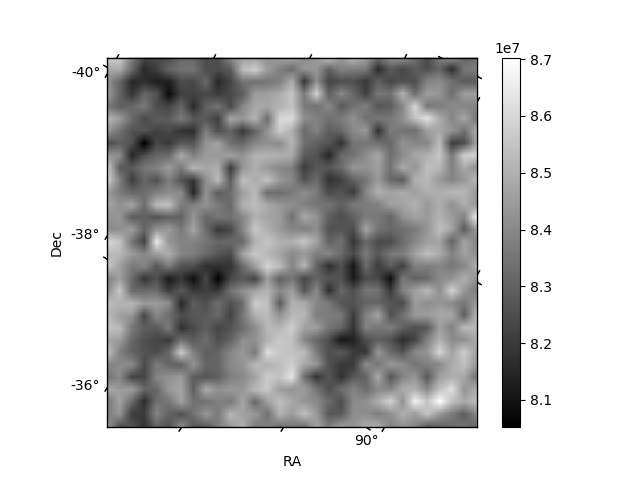
Histogram calculated using DETX and DETY for each event in the final _common_clean file
| Quadrant A | 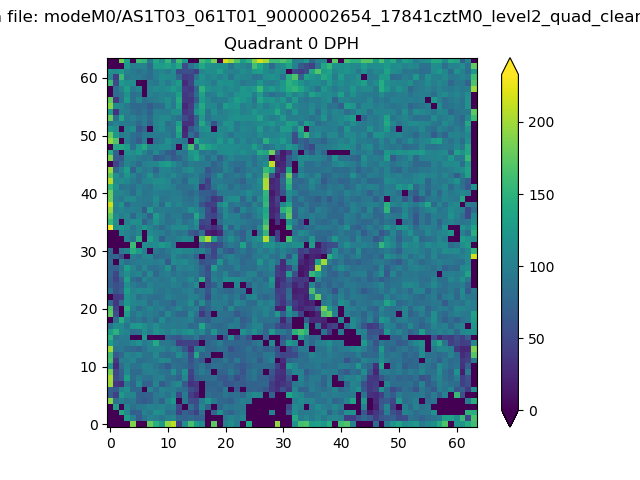 |
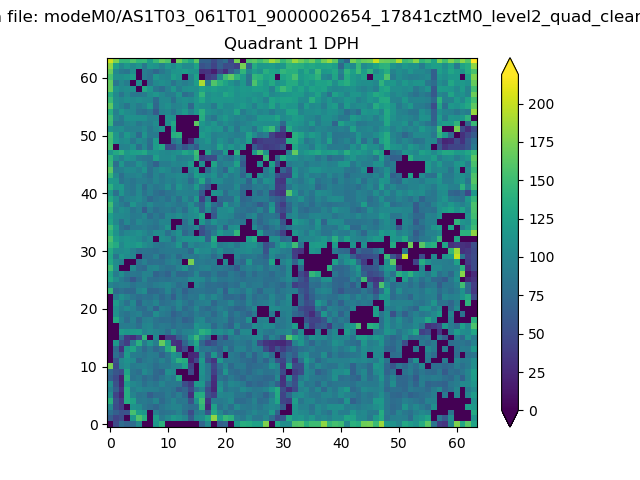 |
Quadrant B |
|---|---|---|---|
| Quadrant D | 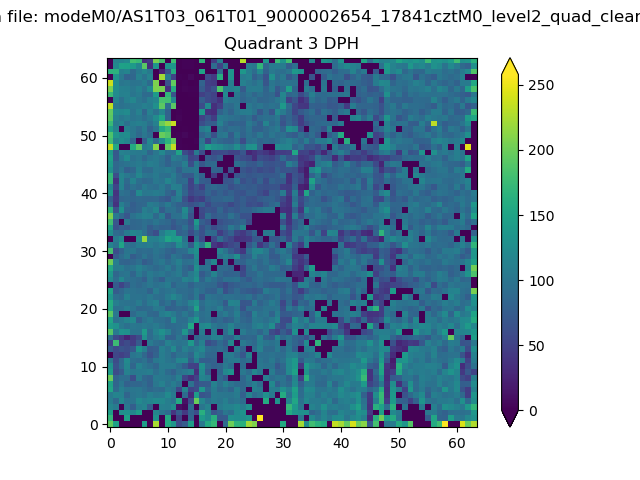 |
 |
Quadrant C |
| Plot type | Count rate plots | Images |
|---|---|---|
| Comparison with Poisson distribution Blue bars denote a histogram of data divided into 1 sec bins. Red curve is a Poisson curve with rate = median count rate of data. |
 |
 |
| Quadrant-wise count rates Data is divided into 100 sec bins |
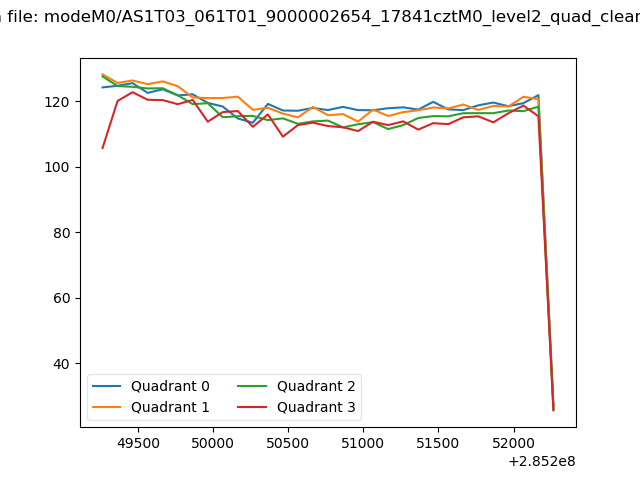 |
|
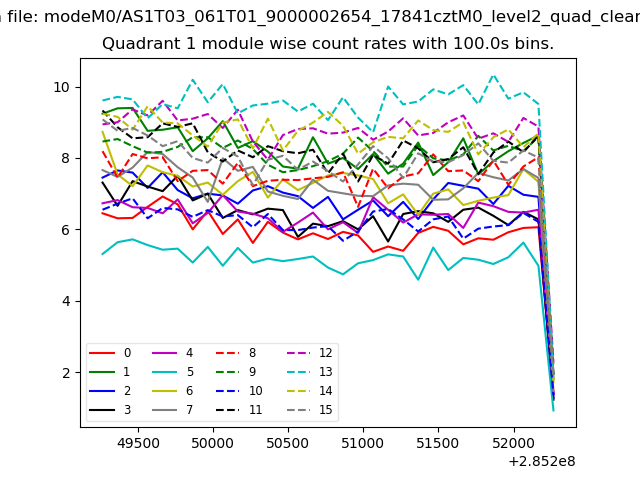
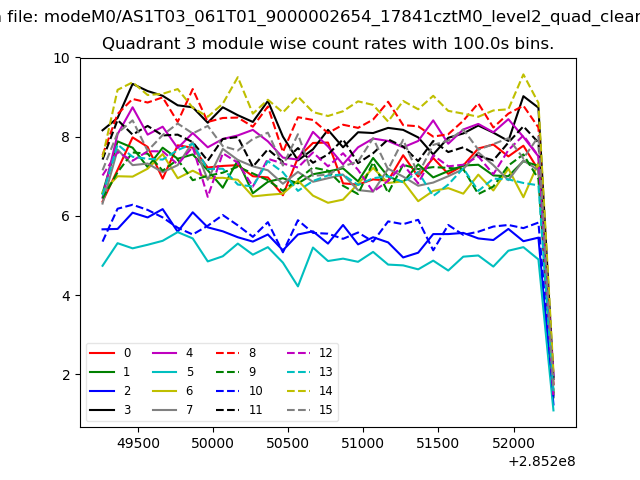
| Module-wise count rates for Quadrant A Data is divided into 100 sec bins |
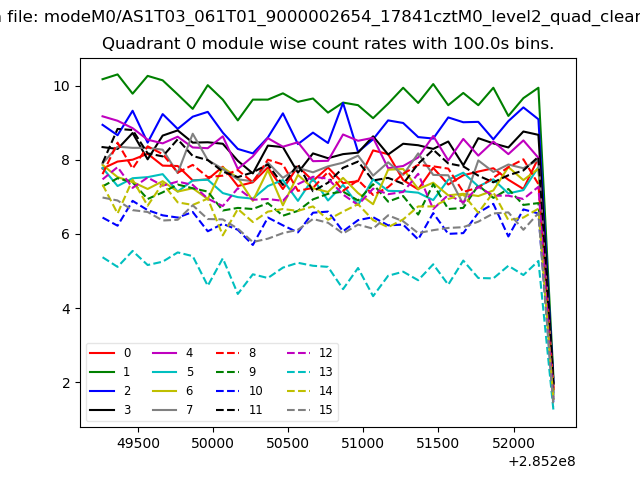 |
 |
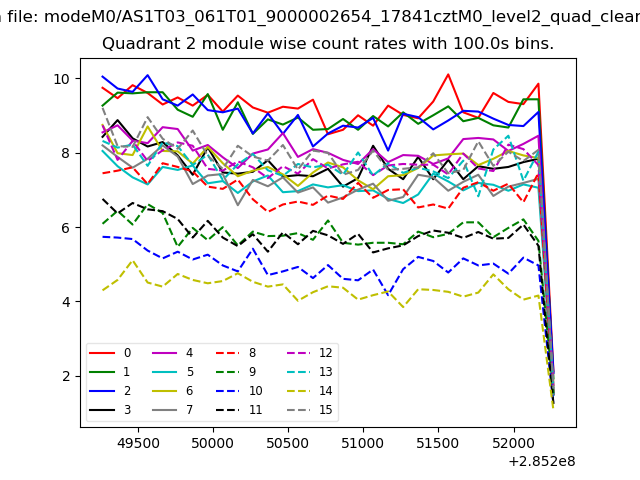
| Module-wise count rates for Quadrant B Data is divided into 100 sec bins |
 |
 |
| Module-wise count rates for Quadrant C Data is divided into 100 sec bins |
 |
 |
| Module-wise count rates for Quadrant D Data is divided into 100 sec bins |
 |
 |
| Parameter | Plot |
|---|---|
| CZT HV Monitor | 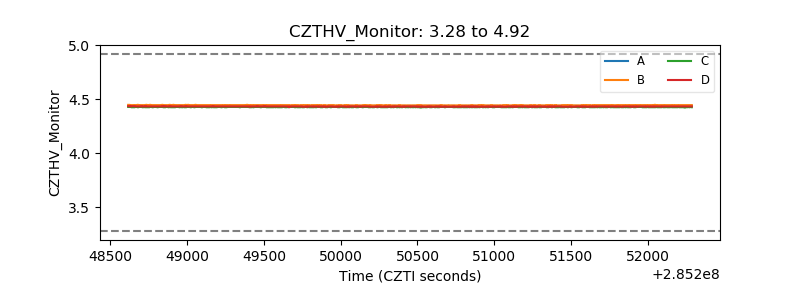 |
| D_VDD | 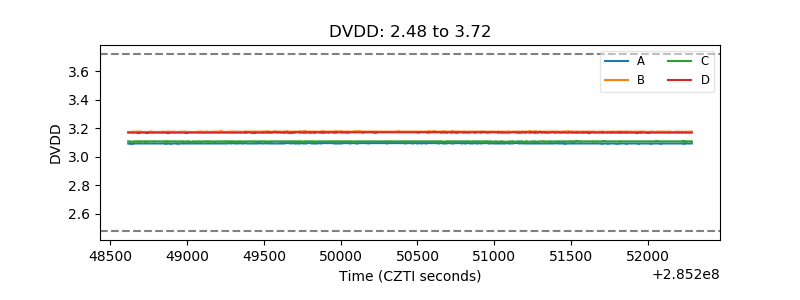 |
| Temperature 1 | 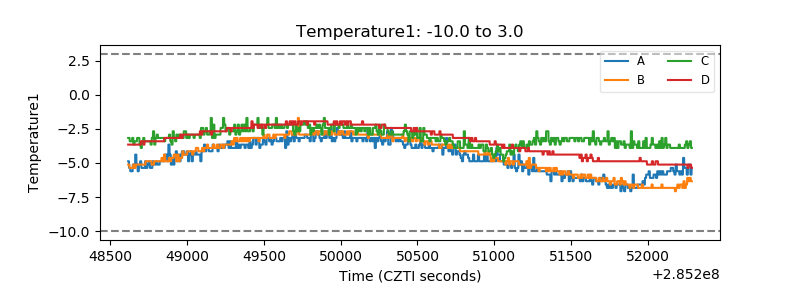 |
| Veto HV Monitor | 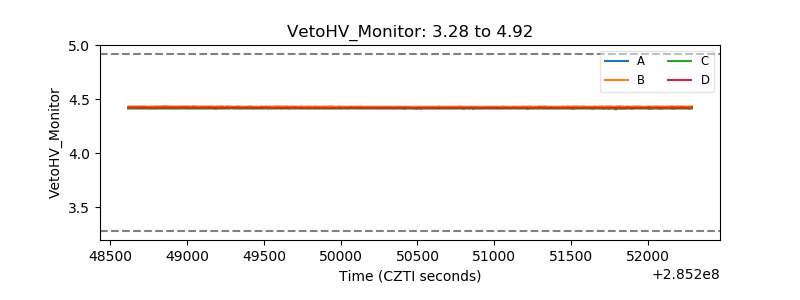 |
| Veto LLD | 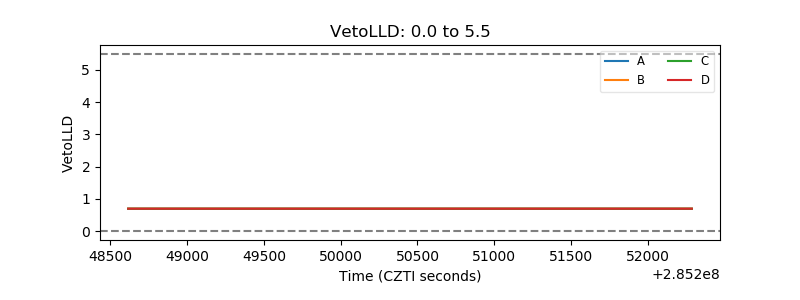 |
| Alpha Counter |  |
| _CPM_Rate | 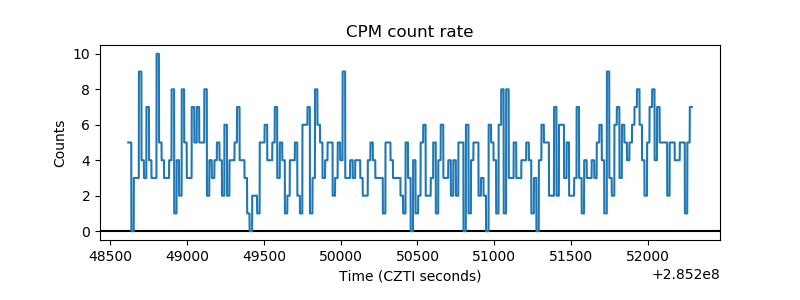 |
| CZT Counter | 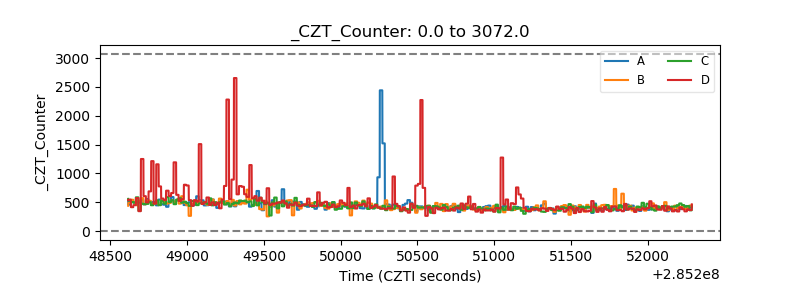 |
| +2.5 Volts monitor |  |
| +5 Volts monitor | 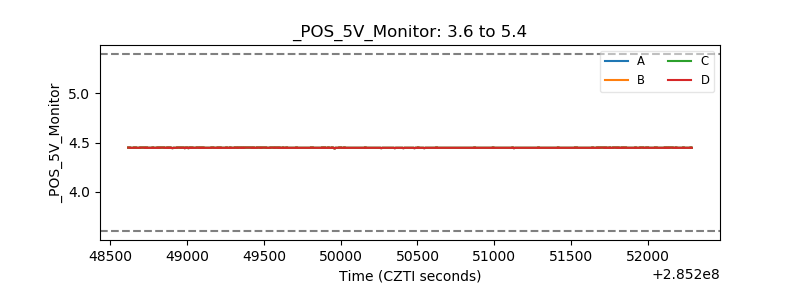 |
| _ROLL_ROT | 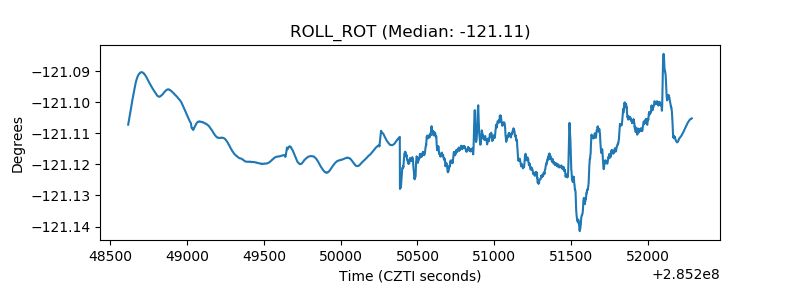 |
| _Roll_DEC | 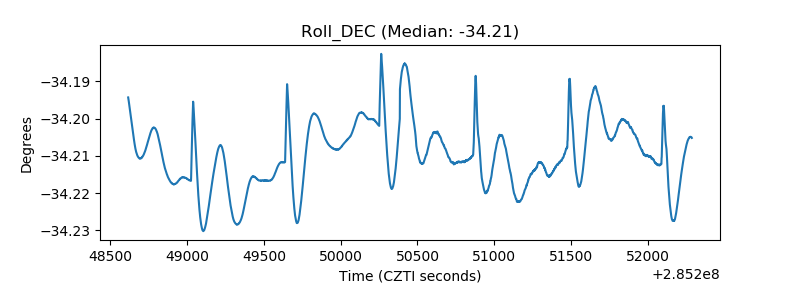 |
| _Roll_RA | 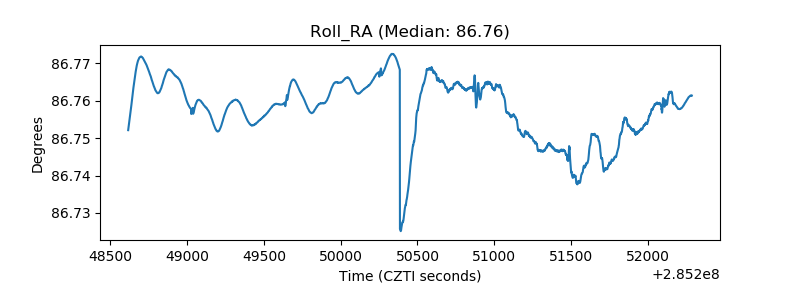 |
| Veto Counter | 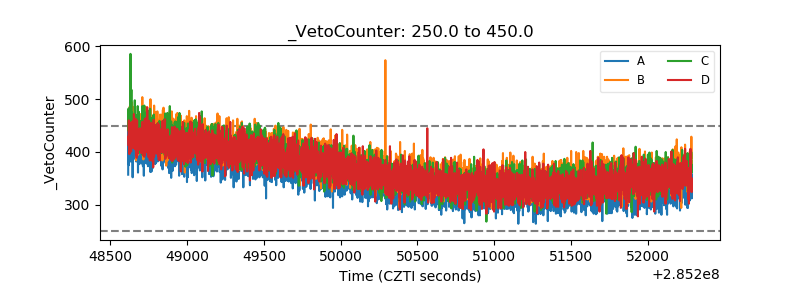 |