| Param | Original file | Final file |
|---|---|---|
| Filename | modeM0/AS1T03_075T01_9000002660_17876cztM0_level2.evt | modeM0/AS1T03_075T01_9000002660_17876cztM0_level2_quad_clean.evt |
| Size (bytes) | 437,829,120 | 99,195,840 |
| Size | 417.5 MB | 94.6 MB |
| Events in quadrant A | 3,174,995 | 644,267 |
| Events in quadrant B | 3,315,984 | 669,056 |
| Events in quadrant C | 3,262,193 | 636,629 |
| Events in quadrant D | 3,087,086 | 623,399 |
| Mode M9 | |||
|---|---|---|---|
| Quadrant | BADHDUFLAG | Total packets | Discarded packets |
| A | 0 | 27 | 0 |
| B | 0 | 27 | 0 |
| C | 0 | 27 | 0 |
| D | 0 | 27 | 0 |
| Mode SS | |||
|---|---|---|---|
| Quadrant | BADHDUFLAG | Total packets | Discarded packets |
| A | 0 | 128 | 0 |
| B | 0 | 128 | 0 |
| C | 0 | 128 | 0 |
| D | 0 | 128 | 0 |
| Mode M0 | |||
|---|---|---|---|
| Quadrant | BADHDUFLAG | Total packets | Discarded packets |
| A | 0 | 13442 | 2 |
| B | 0 | 13899 | 2 |
| C | 0 | 13626 | 2 |
| D | 0 | 13332 | 2 |
| Quadrant | Total seconds | Saturated seconds | Saturation percentage |
|---|---|---|---|
| A | 6170 | 75 | 1.215559% |
| B | 6169 | 102 | 1.653428% |
| C | 6169 | 145 | 2.350462% |
| D | 6170 | 57 | 0.923825% |
Noise dominated data is calculated using 1-second bins in cleaned event files. If a bin has >2000 counts, and if more than 50% of those come from <1% of pixels, then it is considered to be noise-dominated and hence unusable.
| Quadrant | # 1 sec bins | Bins with >0 counts | Bins with >2000 counts | High rate bins dominated by noise | Noise dominated (total time) | Noise dominated (detector-on time) | Marked lightcurve |
|---|---|---|---|---|---|---|---|
| A | 8925 | 6172 | 2 | 2 | 0.02% | 0.03% | 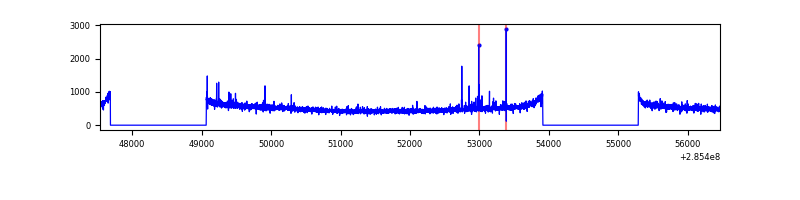 |
| B | 8924 | 6171 | 3 | 3 | 0.03% | 0.05% | 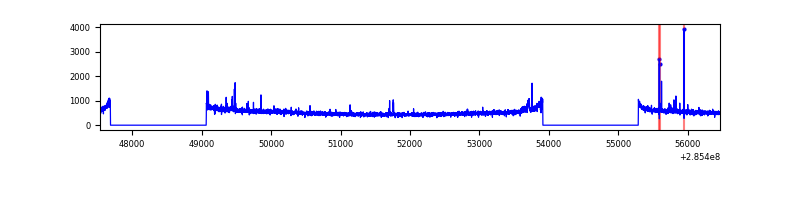 |
| C | 8924 | 6171 | 0 | 0 | 0.00% | 0.00% | 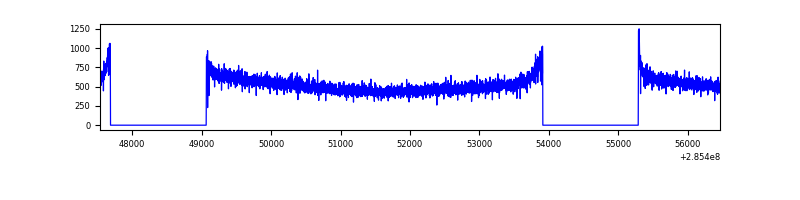 |
| D | 8925 | 6172 | 4 | 4 | 0.04% | 0.06% | 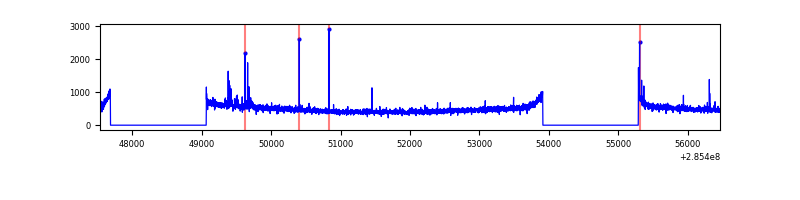 |
Top three noisy pixels from each quadrant. If the there are fewer than three noisy pixels in the level2.evt file, extra rows are filled as -1
| Pixel properties | Quadrant properties | ||||||
|---|---|---|---|---|---|---|---|
| Quadrant | DetID | PixID | Counts | Sigma | Mean | Median | Sigma |
| A | 4 | 2 | 22198 | 129.53 | 816 | 800 | 165.2 |
| A | 14 | 237 | 10922 | 61.27 | 816 | 800 | 165.2 |
| A | 0 | 226 | 7067 | 37.94 | 816 | 800 | 165.2 |
| B | 0 | 189 | 21636 | 134.19 | 826 | 810 | 155.2 |
| B | 12 | 111 | 18304 | 112.72 | 826 | 810 | 155.2 |
| B | 11 | 111 | 15806 | 96.62 | 826 | 810 | 155.2 |
| C | 14 | 238 | 124912 | 674.38 | 795 | 803 | 184.0 |
| C | 3 | 233 | 23789 | 124.9 | 795 | 803 | 184.0 |
| C | 5 | 218 | 7712 | 37.54 | 795 | 803 | 184.0 |
| D | 7 | 238 | 22767 | 104.73 | 795 | 778 | 209.9 |
| D | 2 | 234 | 22318 | 102.6 | 795 | 778 | 209.9 |
| D | 13 | 172 | 17422 | 79.28 | 795 | 778 | 209.9 |
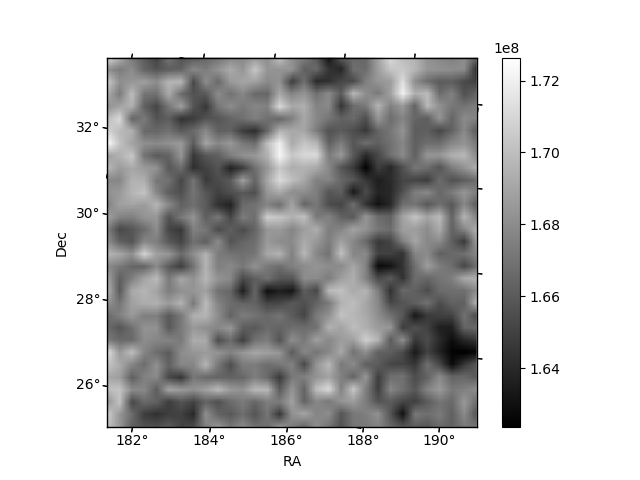
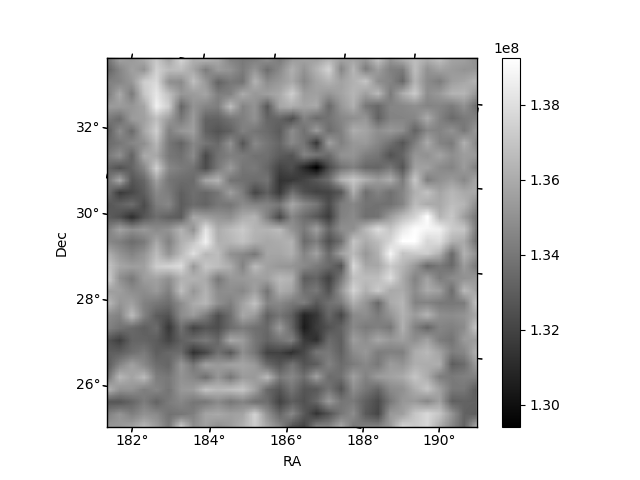
Histogram calculated using DETX and DETY for each event in the final _common_clean file
| Quadrant A |  |
 |
Quadrant B |
|---|---|---|---|
| Quadrant D |  |
 |
Quadrant C |
| Plot type | Count rate plots | Images |
|---|---|---|
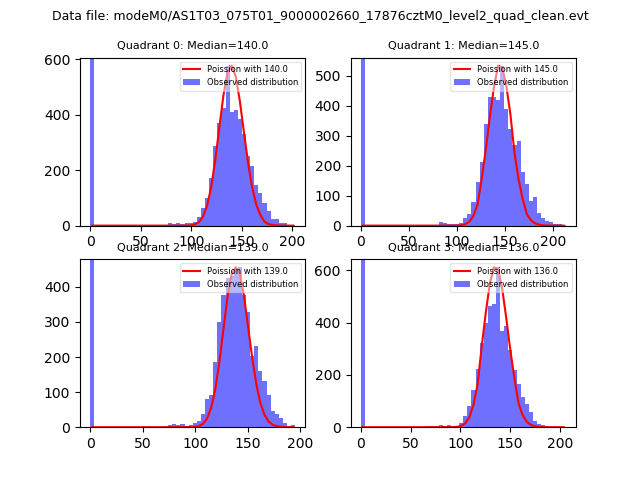
| Comparison with Poisson distribution Blue bars denote a histogram of data divided into 1 sec bins. Red curve is a Poisson curve with rate = median count rate of data. |
 |
 |
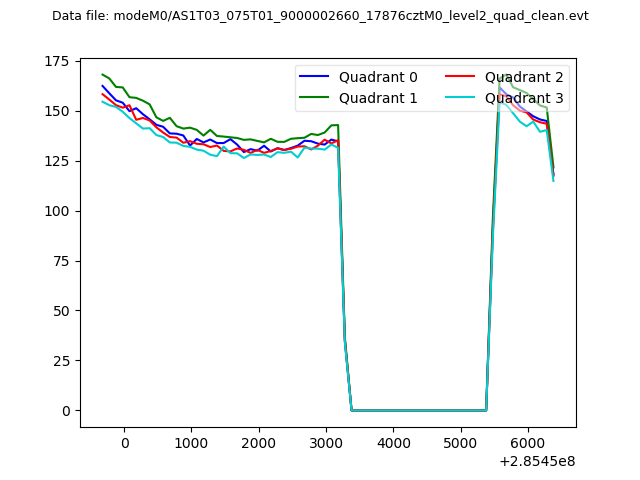
| Quadrant-wise count rates Data is divided into 100 sec bins |
 |
|
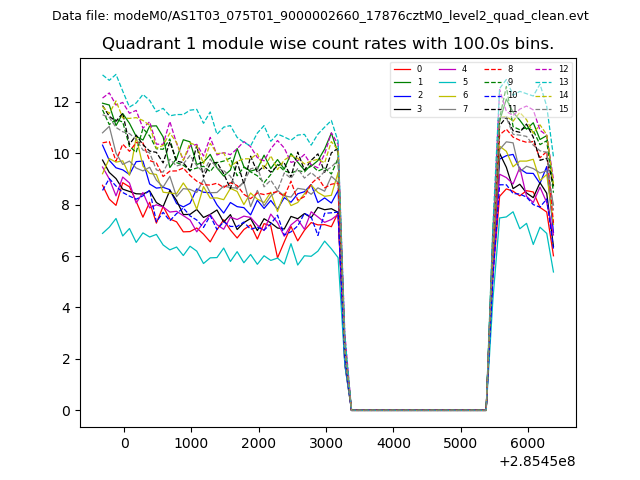
| Module-wise count rates for Quadrant A Data is divided into 100 sec bins |
 |
 |
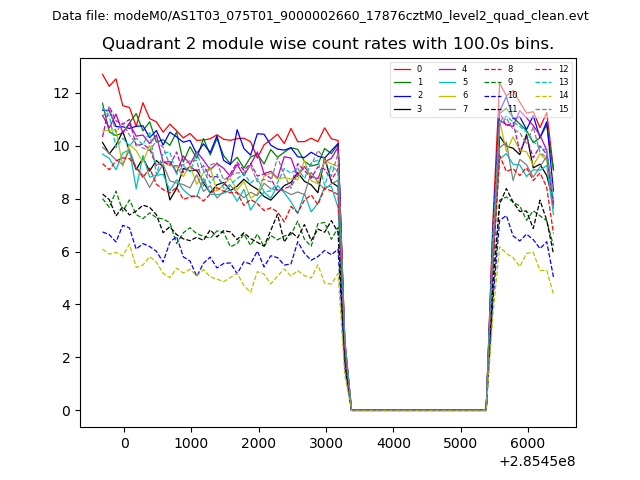
| Module-wise count rates for Quadrant B Data is divided into 100 sec bins |
 |
 |
| Module-wise count rates for Quadrant C Data is divided into 100 sec bins |
 |
 |
| Module-wise count rates for Quadrant D Data is divided into 100 sec bins |
 |
 |
| Parameter | Plot |
|---|---|
| CZT HV Monitor | 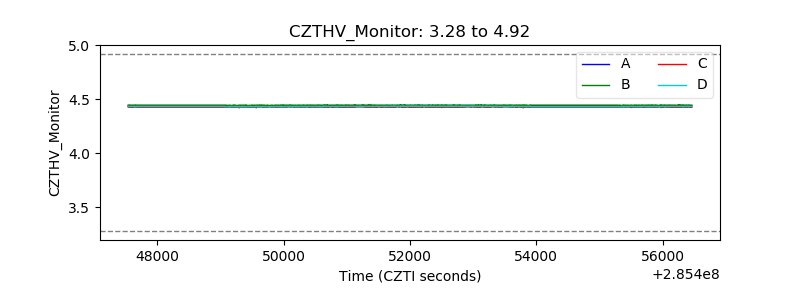 |
| D_VDD | 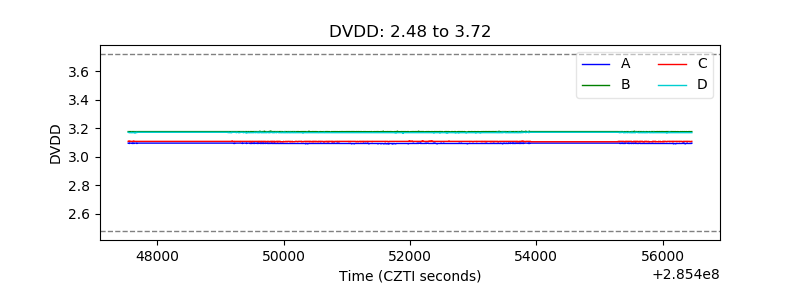 |
| Temperature 1 | 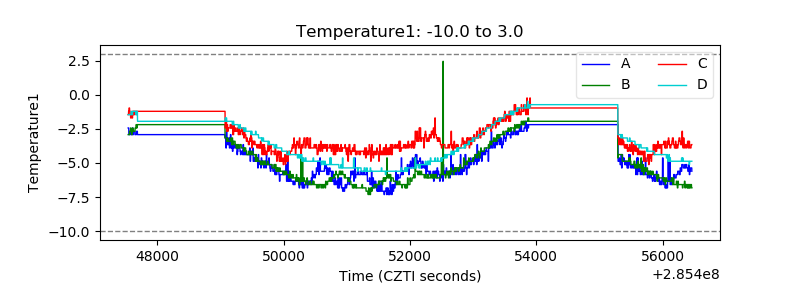 |
| Veto HV Monitor | 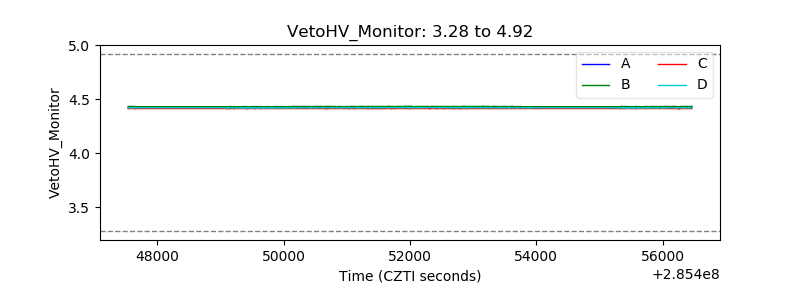 |
| Veto LLD | 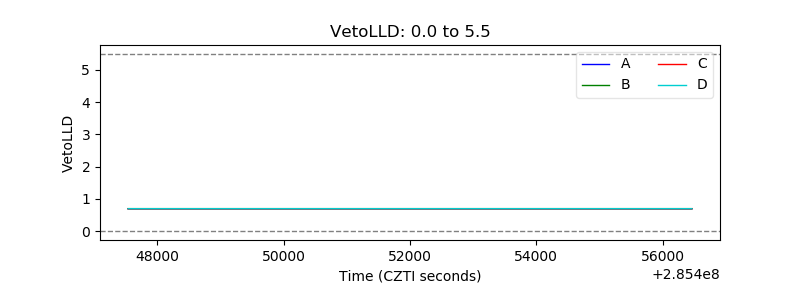 |
| Alpha Counter | 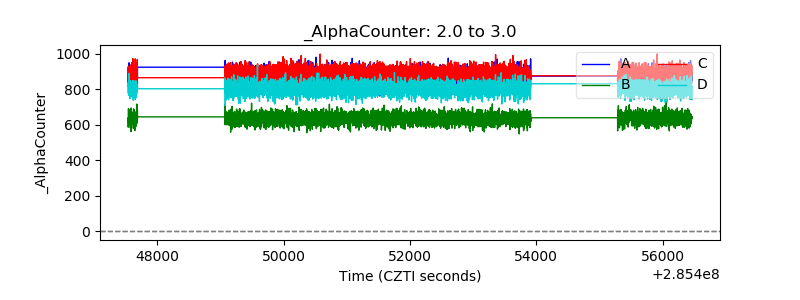 |
| _CPM_Rate | 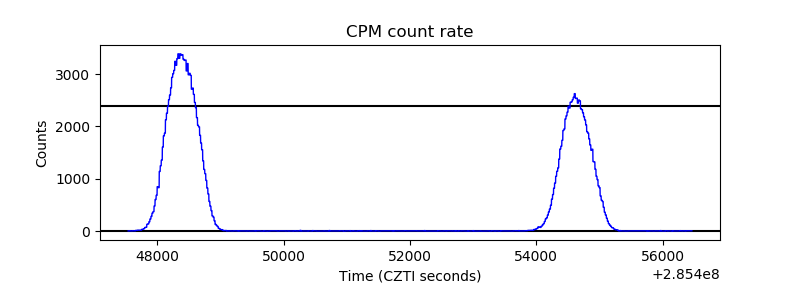 |
| CZT Counter | 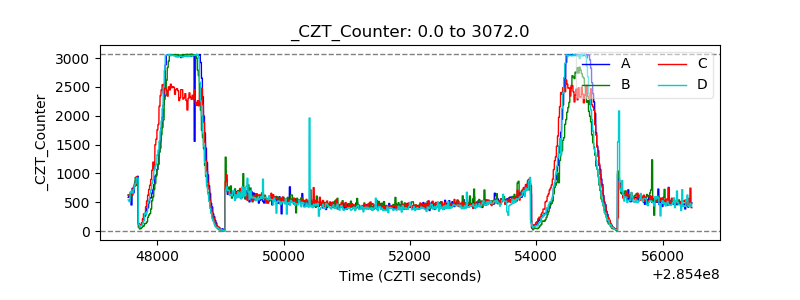 |
| +2.5 Volts monitor |  |
| +5 Volts monitor |  |
| _ROLL_ROT |  |
| _Roll_DEC |  |
| _Roll_RA | 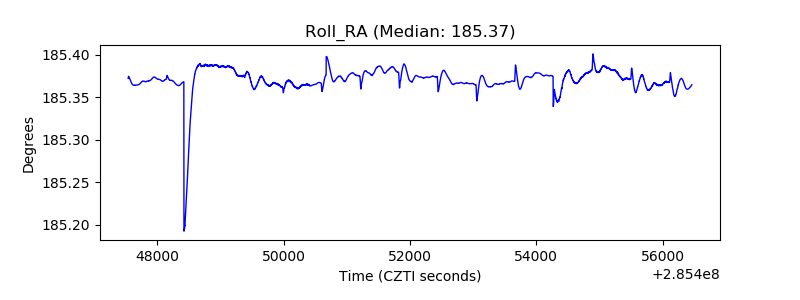 |
| Veto Counter |  |