| Param | Original file | Final file |
|---|---|---|
| Filename | modeM0/AS1T03_075T01_9000002660_17878cztM0_level2.evt | modeM0/AS1T03_075T01_9000002660_17878cztM0_level2_quad_clean.evt |
| Size (bytes) | 493,312,320 | 104,074,560 |
| Size | 470.5 MB | 99.3 MB |
| Events in quadrant A | 3,517,744 | 662,222 |
| Events in quadrant B | 3,726,389 | 683,151 |
| Events in quadrant C | 3,659,506 | 652,102 |
| Events in quadrant D | 3,534,092 | 640,013 |
| Mode M9 | |||
|---|---|---|---|
| Quadrant | BADHDUFLAG | Total packets | Discarded packets |
| A | 0 | 23 | 0 |
| B | 0 | 23 | 0 |
| C | 0 | 23 | 0 |
| D | 0 | 23 | 0 |
| Mode SS | |||
|---|---|---|---|
| Quadrant | BADHDUFLAG | Total packets | Discarded packets |
| A | 0 | 154 | 0 |
| B | 0 | 154 | 0 |
| C | 0 | 154 | 0 |
| D | 0 | 154 | 0 |
| Mode M0 | |||
|---|---|---|---|
| Quadrant | BADHDUFLAG | Total packets | Discarded packets |
| A | 0 | 15467 | 2 |
| B | 0 | 15915 | 2 |
| C | 0 | 15813 | 2 |
| D | 0 | 15882 | 3 |
| Quadrant | Total seconds | Saturated seconds | Saturation percentage |
|---|---|---|---|
| A | 7384 | 50 | 0.677140% |
| B | 7385 | 104 | 1.408260% |
| C | 7385 | 129 | 1.746784% |
| D | 7384 | 110 | 1.489707% |
Noise dominated data is calculated using 1-second bins in cleaned event files. If a bin has >2000 counts, and if more than 50% of those come from <1% of pixels, then it is considered to be noise-dominated and hence unusable.
| Quadrant | # 1 sec bins | Bins with >0 counts | Bins with >2000 counts | High rate bins dominated by noise | Noise dominated (total time) | Noise dominated (detector-on time) | Marked lightcurve |
|---|---|---|---|---|---|---|---|
| A | 9744 | 7387 | 0 | 0 | 0.00% | 0.00% | 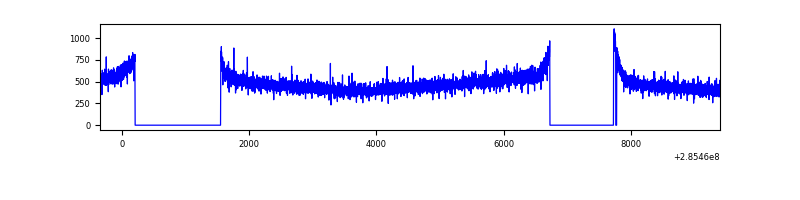 |
| B | 9745 | 7388 | 8 | 8 | 0.08% | 0.11% | 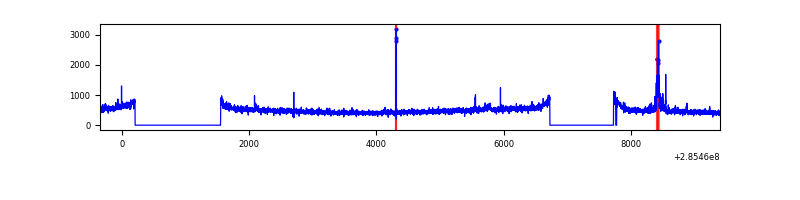 |
| C | 9745 | 7388 | 0 | 0 | 0.00% | 0.00% | 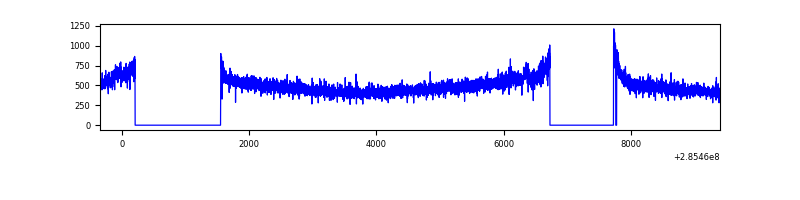 |
| D | 9744 | 7387 | 30 | 30 | 0.31% | 0.41% | 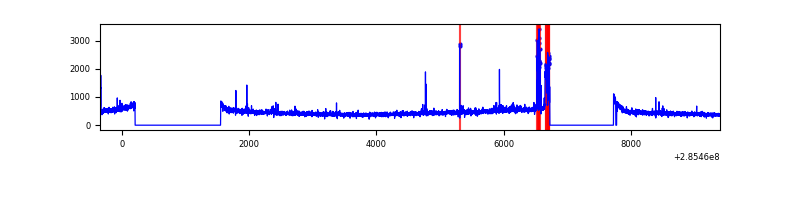 |
Top three noisy pixels from each quadrant. If the there are fewer than three noisy pixels in the level2.evt file, extra rows are filled as -1
| Pixel properties | Quadrant properties | ||||||
|---|---|---|---|---|---|---|---|
| Quadrant | DetID | PixID | Counts | Sigma | Mean | Median | Sigma |
| A | 0 | 226 | 7875 | 37.79 | 915 | 895 | 184.7 |
| A | 3 | 137 | 6909 | 32.56 | 915 | 895 | 184.7 |
| A | 12 | 194 | 6726 | 31.57 | 915 | 895 | 184.7 |
| B | 15 | 222 | 89387 | 503.42 | 922 | 899 | 175.8 |
| B | 12 | 111 | 21238 | 115.71 | 922 | 899 | 175.8 |
| B | 0 | 229 | 19613 | 106.47 | 922 | 899 | 175.8 |
| C | 14 | 238 | 137018 | 656.35 | 884 | 890 | 207.4 |
| C | 3 | 233 | 68868 | 327.76 | 884 | 890 | 207.4 |
| C | 13 | 61 | 6354 | 26.35 | 884 | 890 | 207.4 |
| D | 7 | 238 | 138989 | 601.67 | 878 | 860 | 229.6 |
| D | 2 | 234 | 25142 | 105.77 | 878 | 860 | 229.6 |
| D | 10 | 70 | 23813 | 99.98 | 878 | 860 | 229.6 |
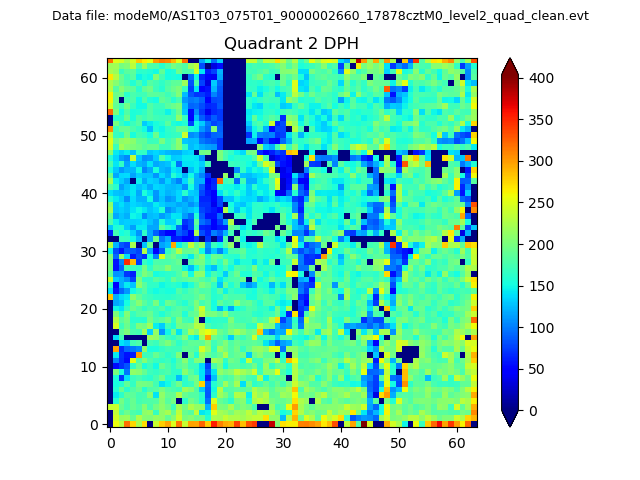
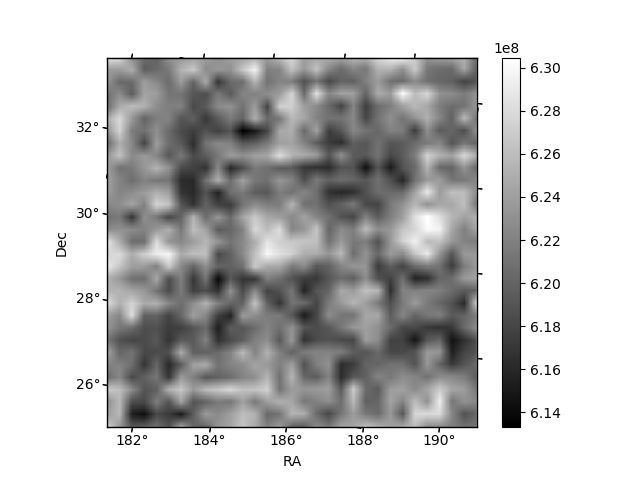
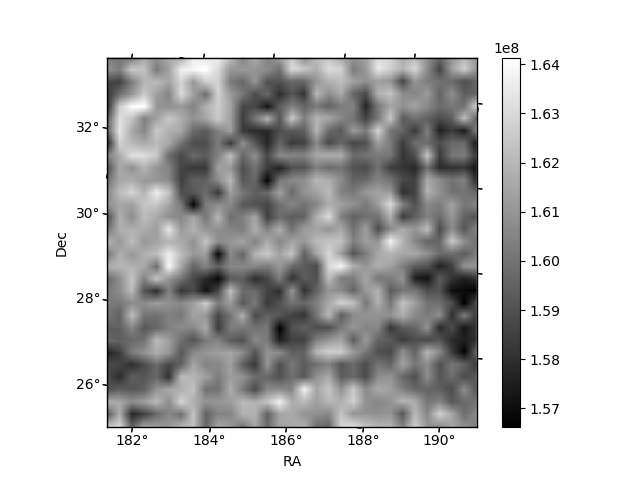
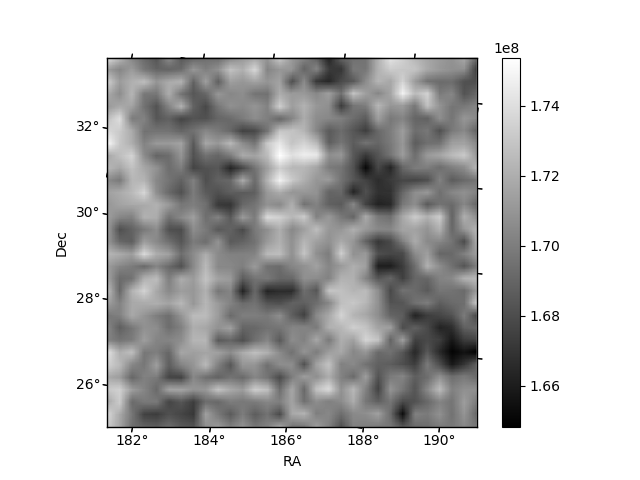
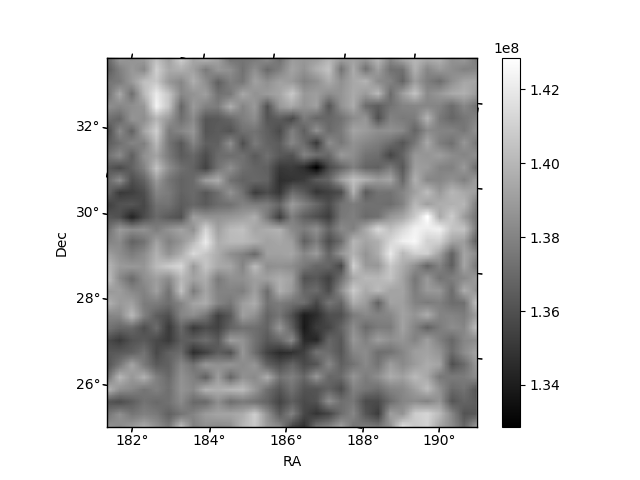
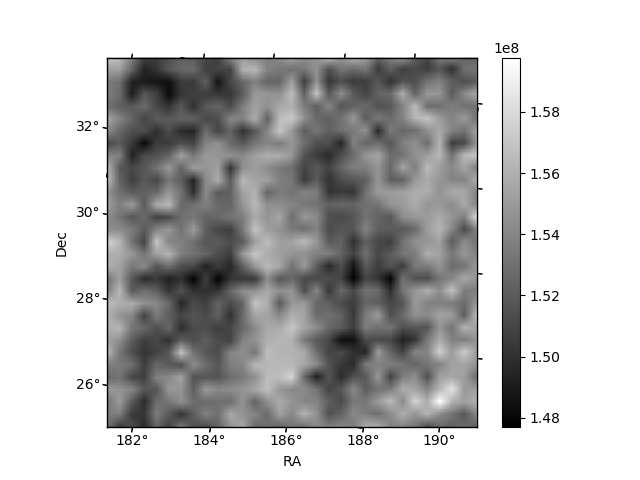
Histogram calculated using DETX and DETY for each event in the final _common_clean file
| Quadrant A | 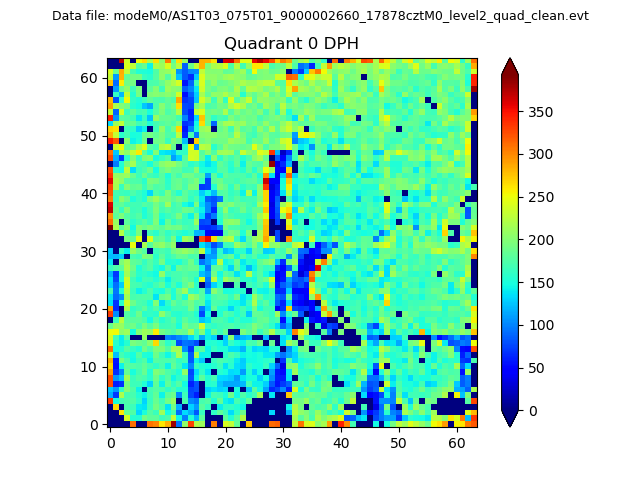 |
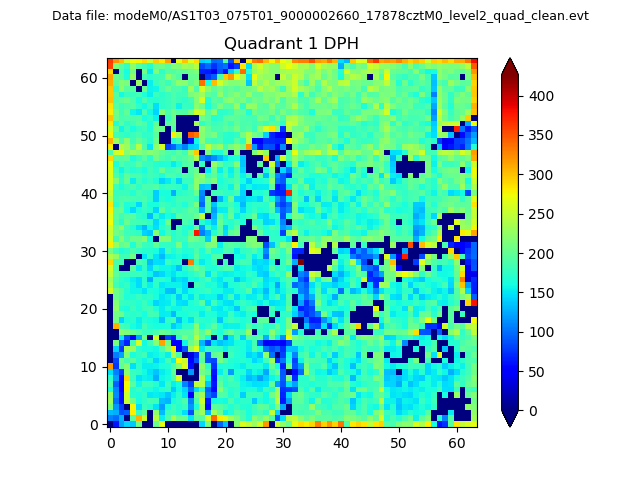 |
Quadrant B |
|---|---|---|---|
| Quadrant D | 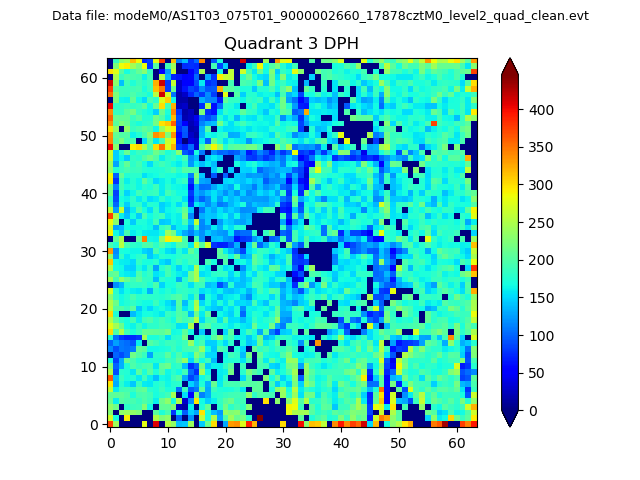 |
 |
Quadrant C |
| Plot type | Count rate plots | Images |
|---|---|---|
| Comparison with Poisson distribution Blue bars denote a histogram of data divided into 1 sec bins. Red curve is a Poisson curve with rate = median count rate of data. |
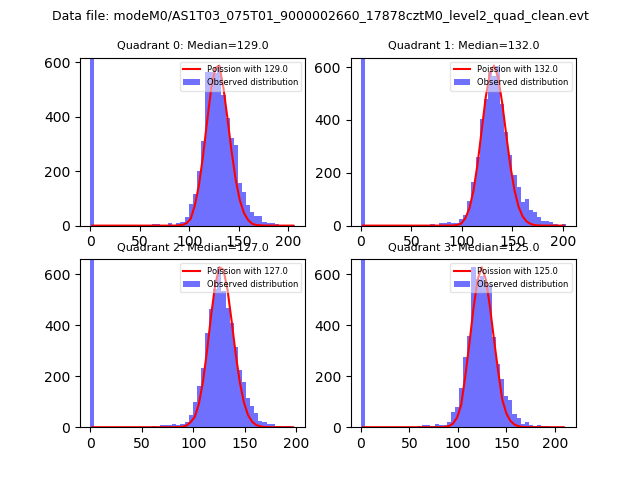 |
 |
| Quadrant-wise count rates Data is divided into 100 sec bins |
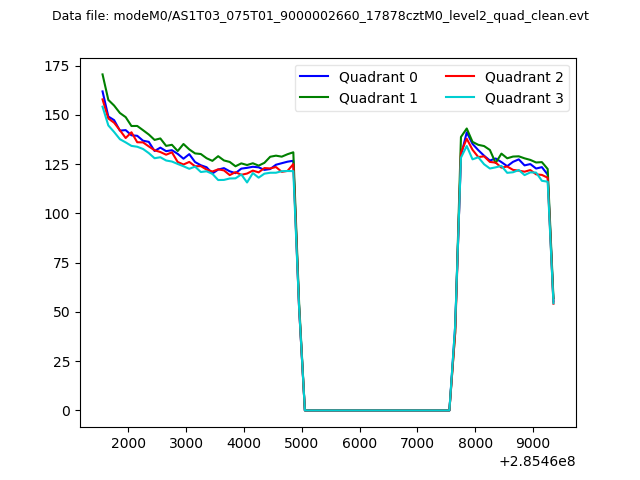 |
|
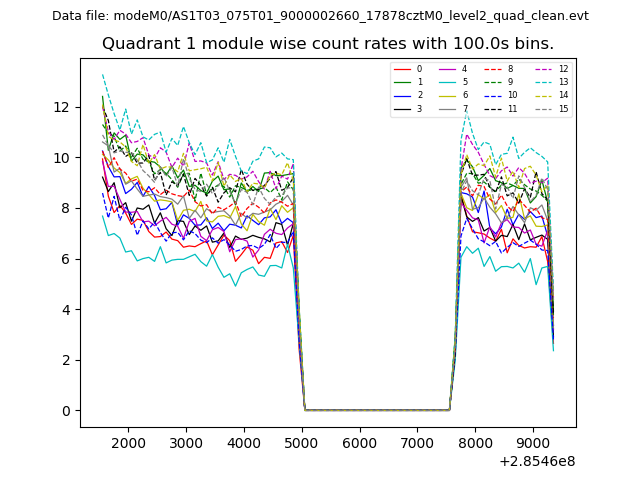
| Module-wise count rates for Quadrant A Data is divided into 100 sec bins |
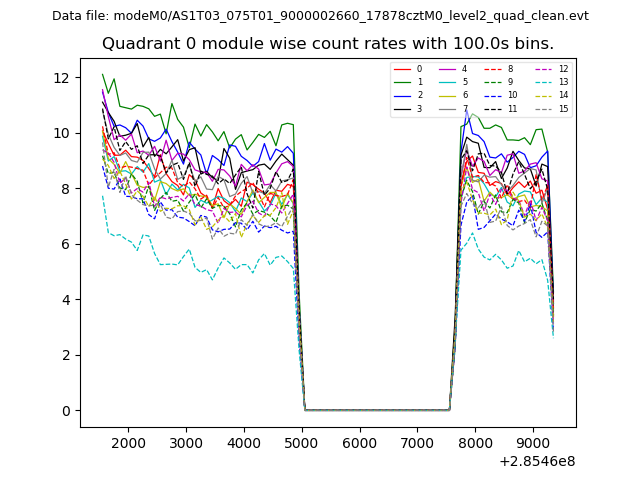 |
 |
| Module-wise count rates for Quadrant B Data is divided into 100 sec bins |
 |
 |
| Module-wise count rates for Quadrant C Data is divided into 100 sec bins |
 |
 |
| Module-wise count rates for Quadrant D Data is divided into 100 sec bins |
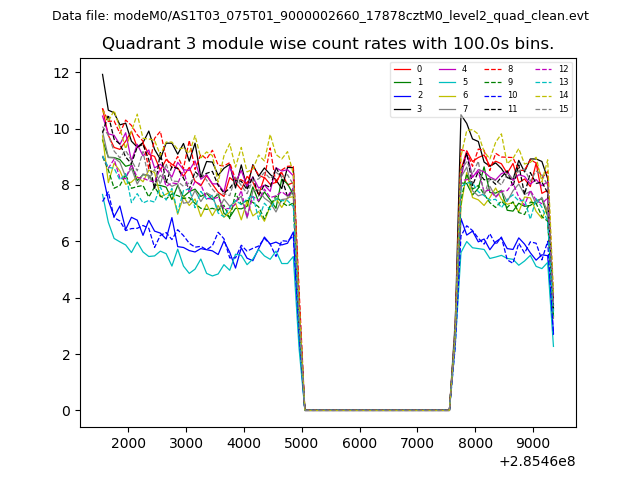 |
 |
| Parameter | Plot |
|---|---|
| CZT HV Monitor | 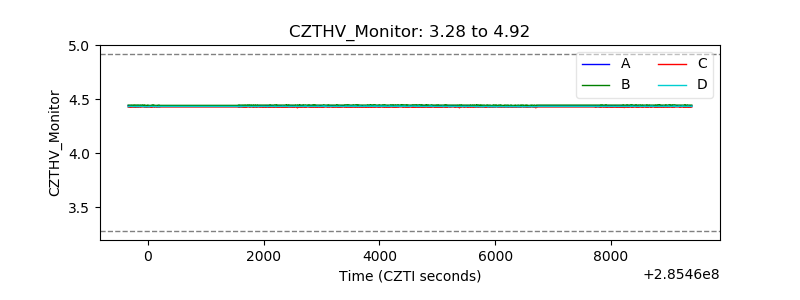 |
| D_VDD | 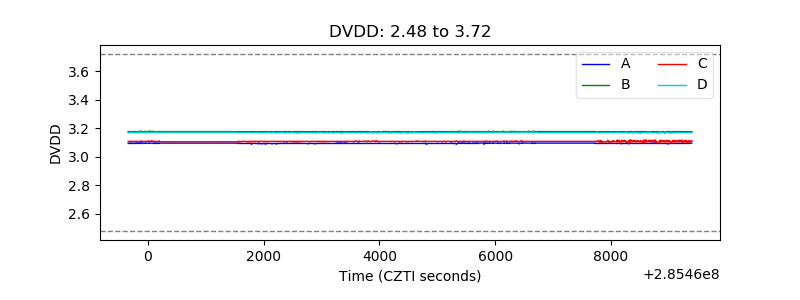 |
| Temperature 1 |  |
| Veto HV Monitor |  |
| Veto LLD | 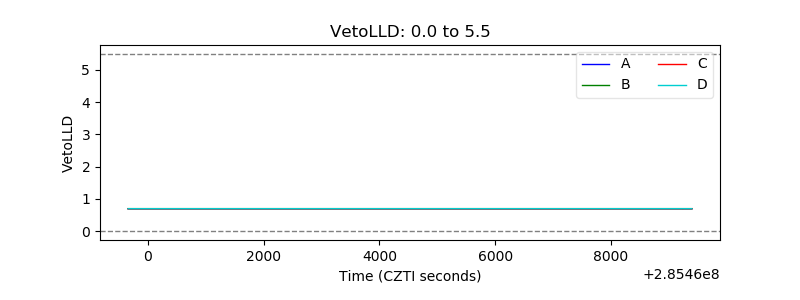 |
| Alpha Counter | 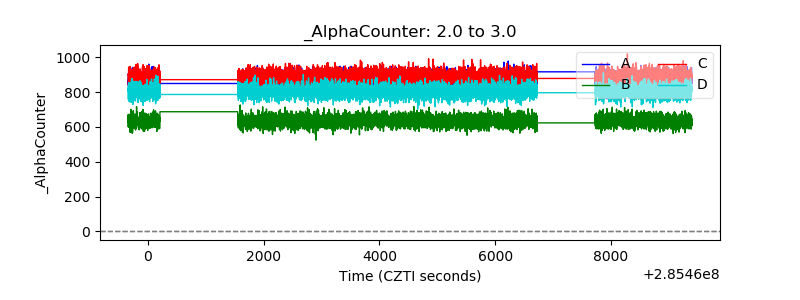 |
| _CPM_Rate | 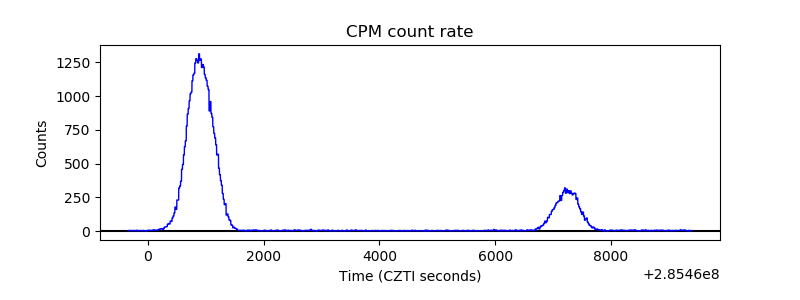 |
| CZT Counter | 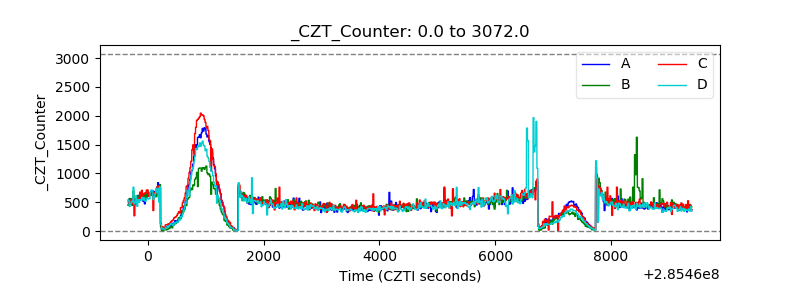 |
| +2.5 Volts monitor |  |
| +5 Volts monitor |  |
| _ROLL_ROT | 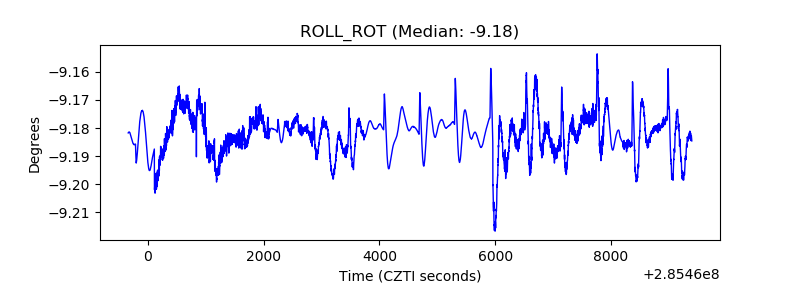 |
| _Roll_DEC |  |
| _Roll_RA | 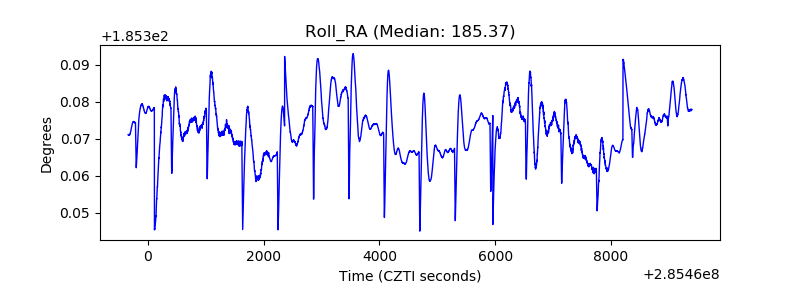 |
| Veto Counter | 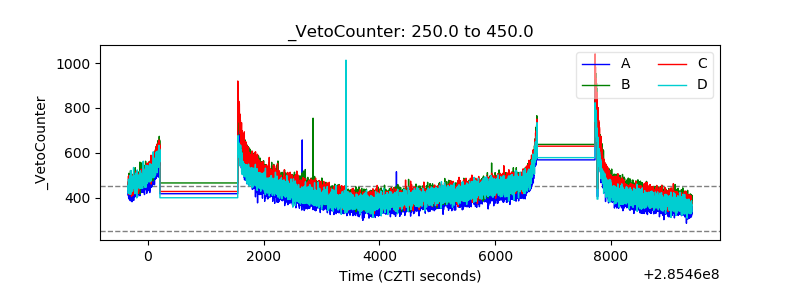 |