| Param | Original file | Final file |
|---|---|---|
| Filename | modeM0/AS1T03_075T01_9000002660_17880cztM0_level2.evt | modeM0/AS1T03_075T01_9000002660_17880cztM0_level2_quad_clean.evt |
| Size (bytes) | 484,845,120 | 102,890,880 |
| Size | 462.4 MB | 98.1 MB |
| Events in quadrant A | 3,494,090 | 649,565 |
| Events in quadrant B | 3,578,609 | 667,740 |
| Events in quadrant C | 3,564,390 | 643,053 |
| Events in quadrant D | 3,533,486 | 630,503 |
| Mode M9 | |||
|---|---|---|---|
| Quadrant | BADHDUFLAG | Total packets | Discarded packets |
| A | 0 | 1 | 0 |
| B | 0 | 1 | 0 |
| C | 0 | 1 | 0 |
| D | 0 | 1 | 0 |
| Mode SS | |||
|---|---|---|---|
| Quadrant | BADHDUFLAG | Total packets | Discarded packets |
| A | 0 | 152 | 0 |
| B | 0 | 152 | 0 |
| C | 0 | 152 | 0 |
| D | 0 | 152 | 0 |
| Mode M0 | |||
|---|---|---|---|
| Quadrant | BADHDUFLAG | Total packets | Discarded packets |
| A | 0 | 15643 | 2 |
| B | 0 | 15730 | 3 |
| C | 0 | 15687 | 2 |
| D | 0 | 16055 | 2 |
| Quadrant | Total seconds | Saturated seconds | Saturation percentage |
|---|---|---|---|
| A | 7547 | 225 | 2.981317% |
| B | 7546 | 245 | 3.246753% |
| C | 7546 | 241 | 3.193745% |
| D | 7547 | 172 | 2.279051% |
Noise dominated data is calculated using 1-second bins in cleaned event files. If a bin has >2000 counts, and if more than 50% of those come from <1% of pixels, then it is considered to be noise-dominated and hence unusable.
| Quadrant | # 1 sec bins | Bins with >0 counts | Bins with >2000 counts | High rate bins dominated by noise | Noise dominated (total time) | Noise dominated (detector-on time) | Marked lightcurve |
|---|---|---|---|---|---|---|---|
| A | 7617 | 7550 | 0 | 0 | 0.00% | 0.00% | 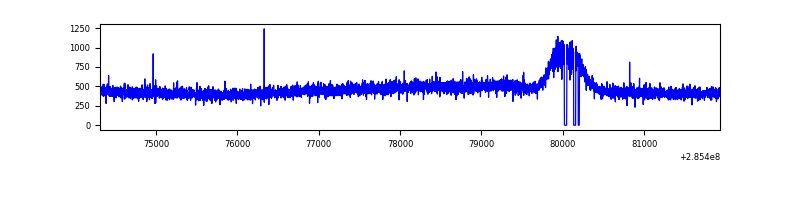 |
| B | 7616 | 7549 | 1 | 1 | 0.01% | 0.01% | 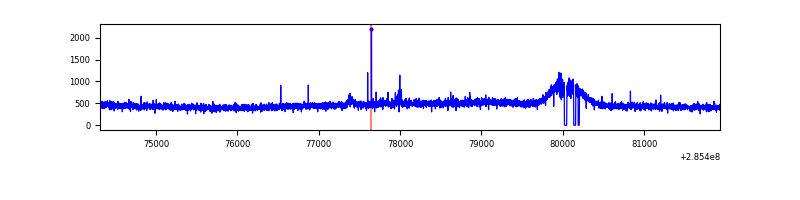 |
| C | 7616 | 7549 | 0 | 0 | 0.00% | 0.00% | 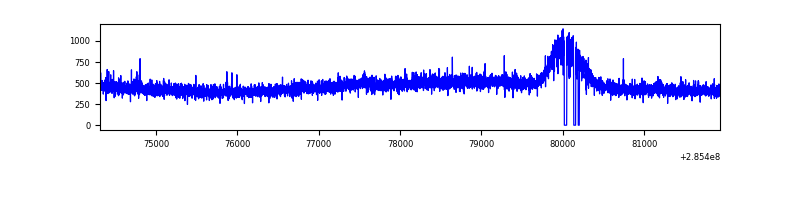 |
| D | 7617 | 7550 | 7 | 7 | 0.09% | 0.09% | 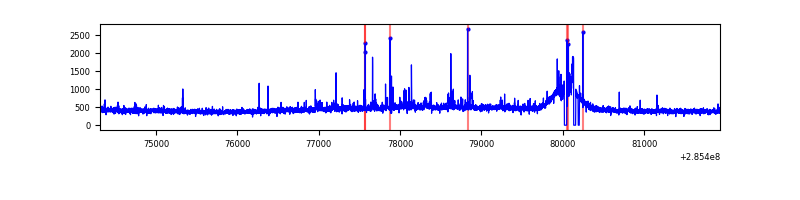 |
Top three noisy pixels from each quadrant. If the there are fewer than three noisy pixels in the level2.evt file, extra rows are filled as -1
| Pixel properties | Quadrant properties | ||||||
|---|---|---|---|---|---|---|---|
| Quadrant | DetID | PixID | Counts | Sigma | Mean | Median | Sigma |
| A | 0 | 226 | 7854 | 37.43 | 909 | 886 | 186.2 |
| A | 3 | 137 | 7216 | 34.0 | 909 | 886 | 186.2 |
| A | 12 | 194 | 6490 | 30.1 | 909 | 886 | 186.2 |
| B | 12 | 111 | 21879 | 118.45 | 908 | 883 | 177.3 |
| B | 11 | 111 | 19034 | 102.4 | 908 | 883 | 177.3 |
| B | 14 | 111 | 16721 | 89.35 | 908 | 883 | 177.3 |
| C | 14 | 238 | 131368 | 629.11 | 871 | 876 | 207.4 |
| C | 3 | 233 | 32475 | 152.34 | 871 | 876 | 207.4 |
| C | 13 | 61 | 6219 | 25.76 | 871 | 876 | 207.4 |
| D | 10 | 70 | 60638 | 255.92 | 876 | 852 | 233.6 |
| D | 1 | 52 | 60016 | 253.26 | 876 | 852 | 233.6 |
| D | 2 | 165 | 43656 | 183.23 | 876 | 852 | 233.6 |
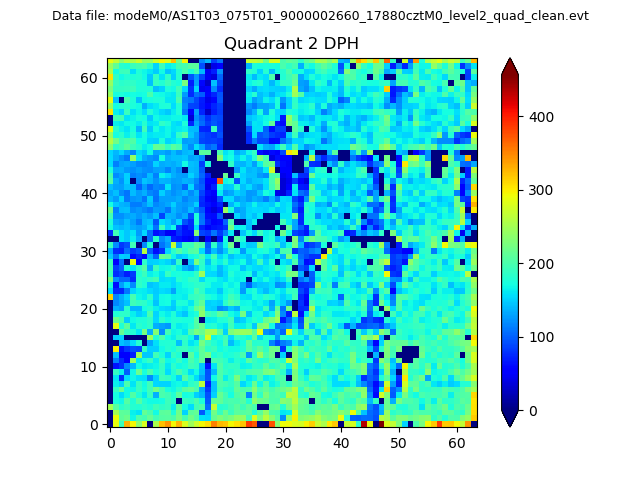
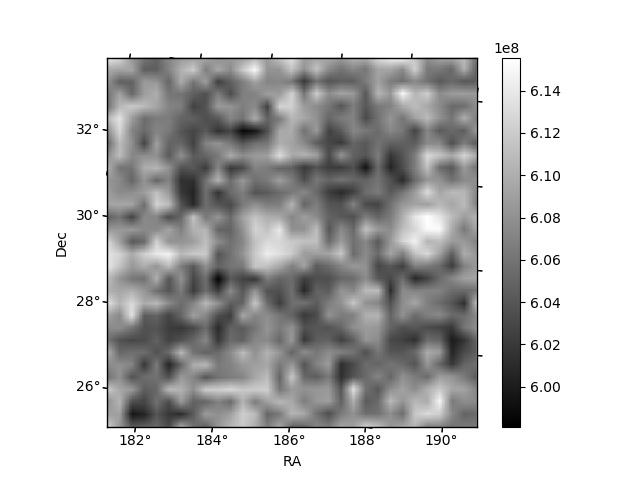
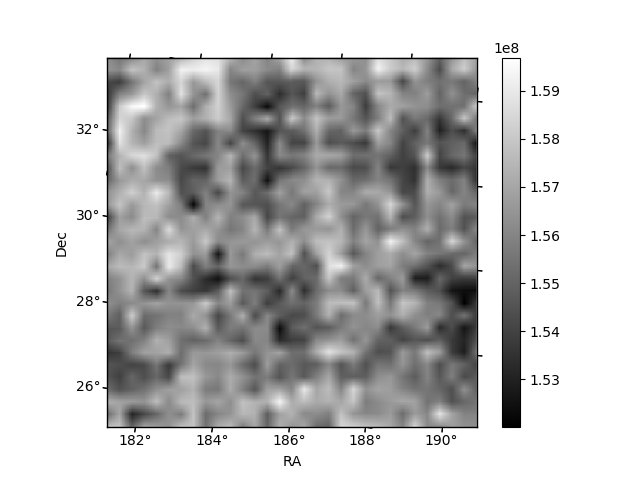
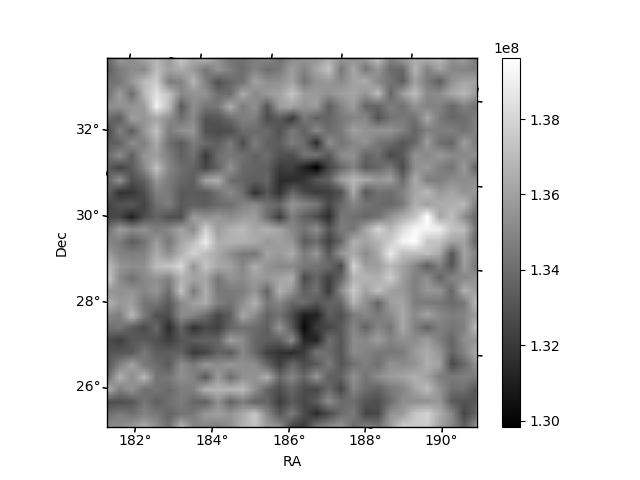
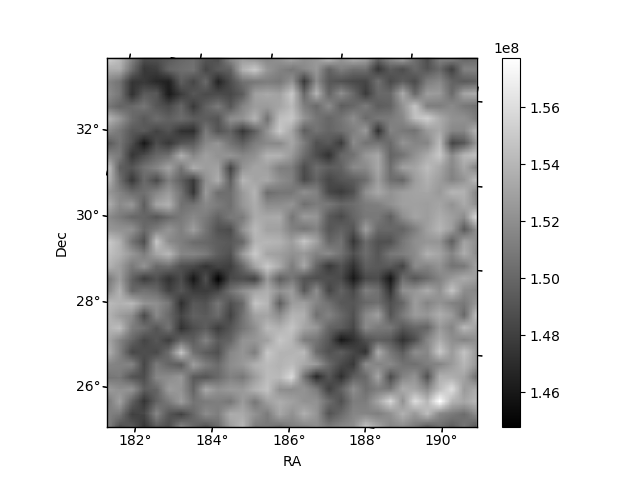
Histogram calculated using DETX and DETY for each event in the final _common_clean file
| Quadrant A | 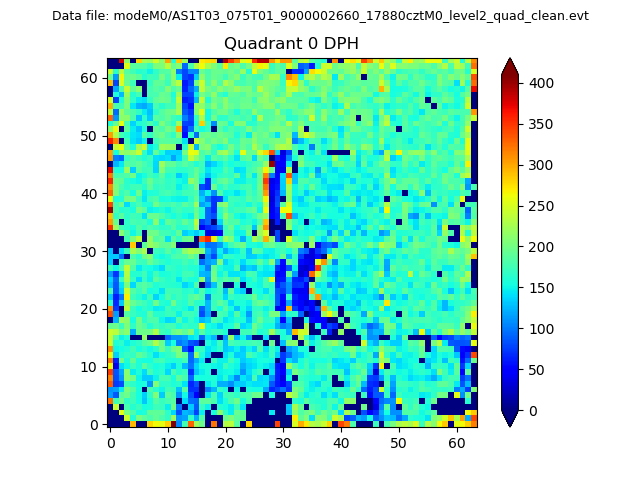 |
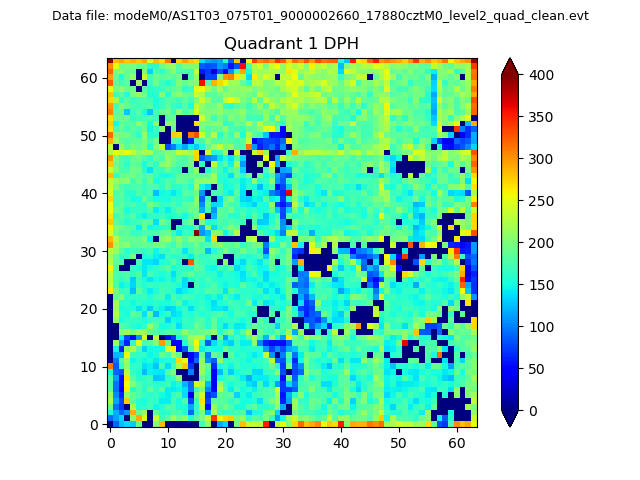 |
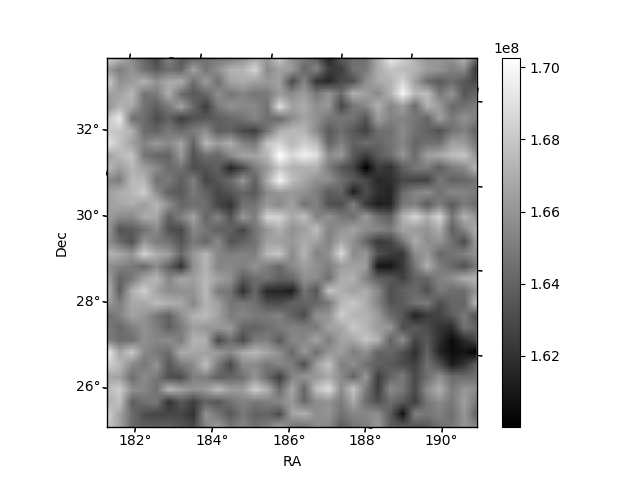
Quadrant B |
|---|---|---|---|
| Quadrant D | 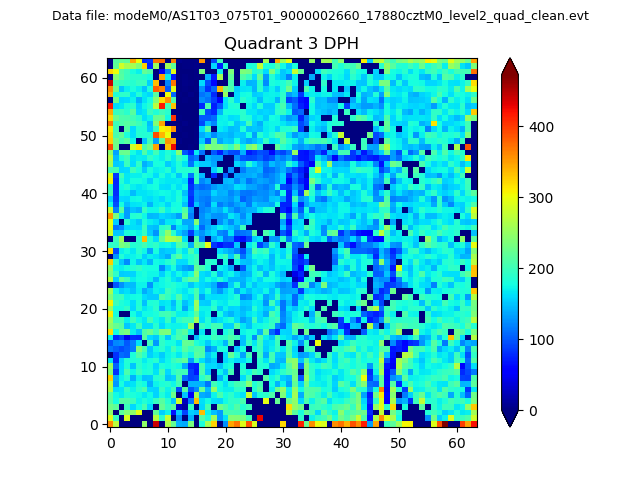 |
 |
Quadrant C |
| Plot type | Count rate plots | Images |
|---|---|---|
| Comparison with Poisson distribution Blue bars denote a histogram of data divided into 1 sec bins. Red curve is a Poisson curve with rate = median count rate of data. |
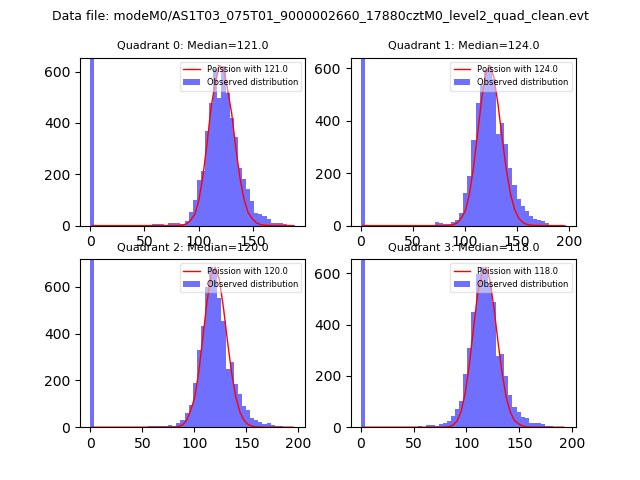 |
 |
| Quadrant-wise count rates Data is divided into 100 sec bins |
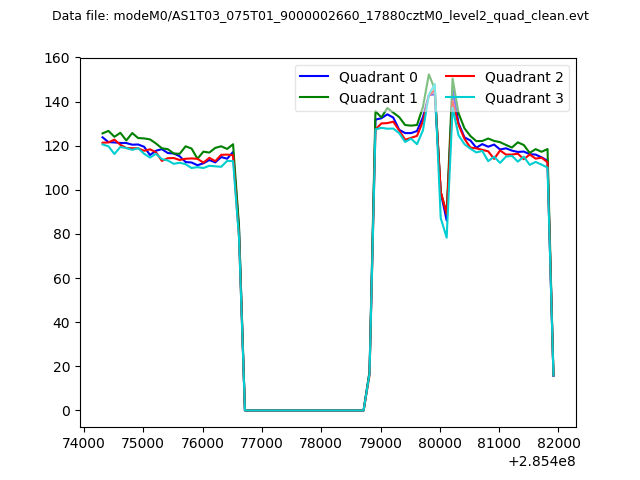 |
|
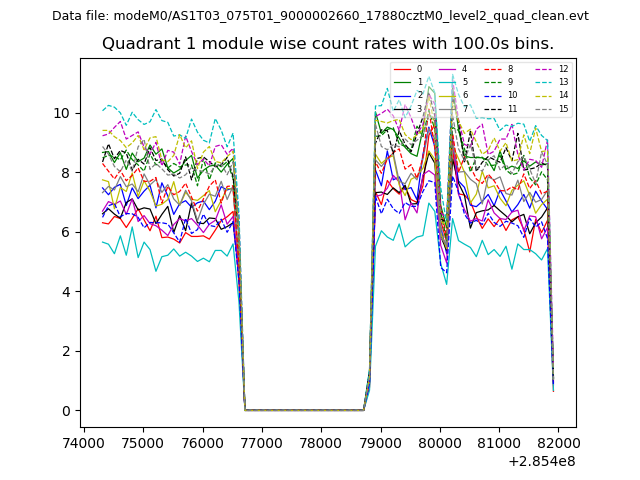
| Module-wise count rates for Quadrant A Data is divided into 100 sec bins |
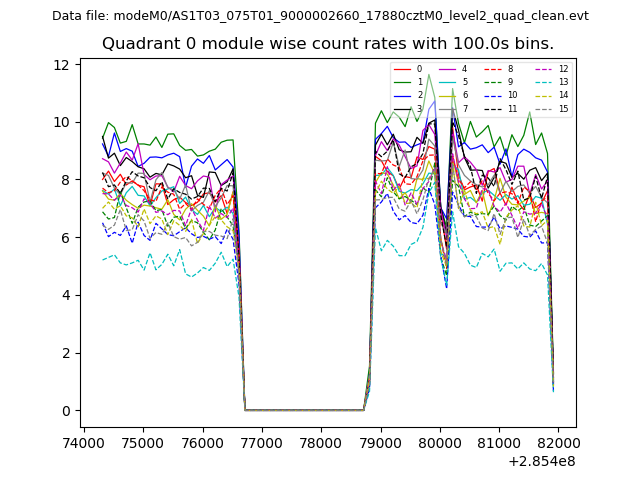 |
 |
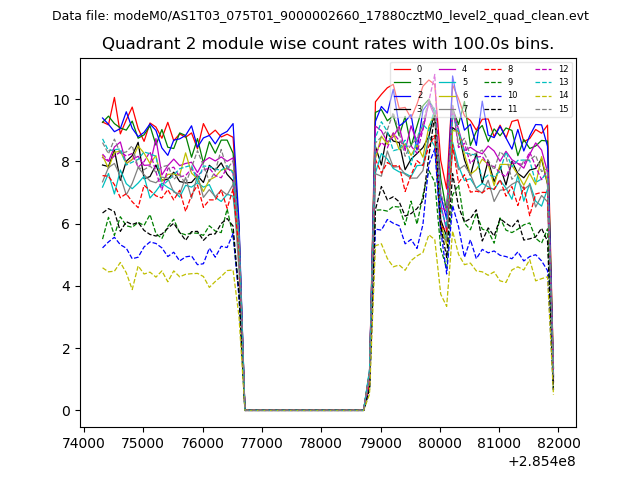
| Module-wise count rates for Quadrant B Data is divided into 100 sec bins |
 |
 |
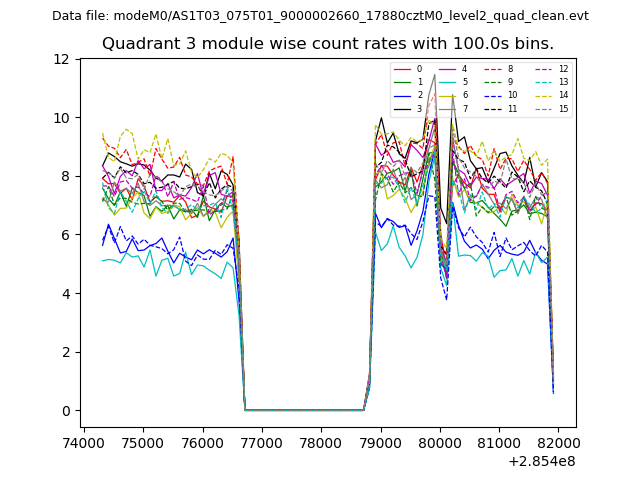
| Module-wise count rates for Quadrant C Data is divided into 100 sec bins |
 |
 |
| Module-wise count rates for Quadrant D Data is divided into 100 sec bins |
 |
 |
| Parameter | Plot |
|---|---|
| CZT HV Monitor | 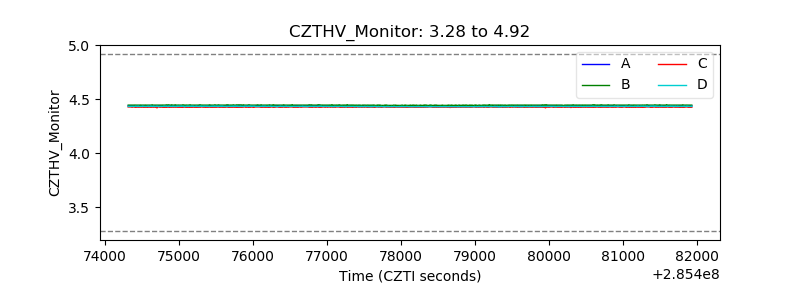 |
| D_VDD | 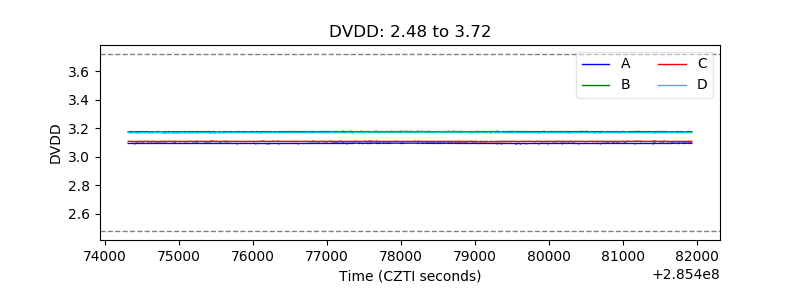 |
| Temperature 1 | 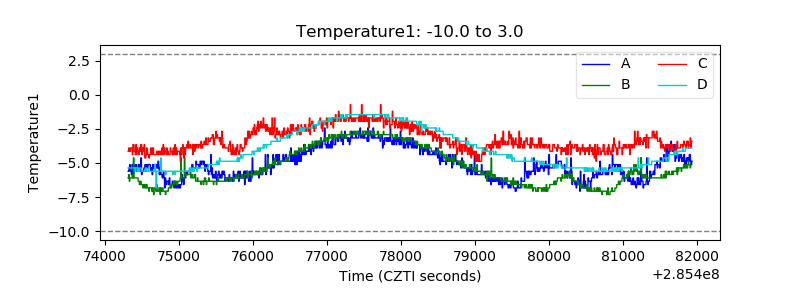 |
| Veto HV Monitor | 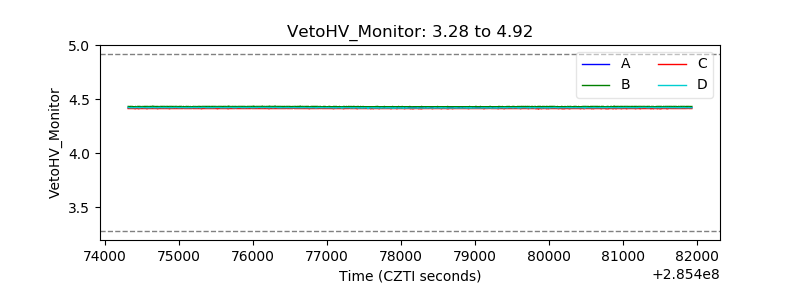 |
| Veto LLD | 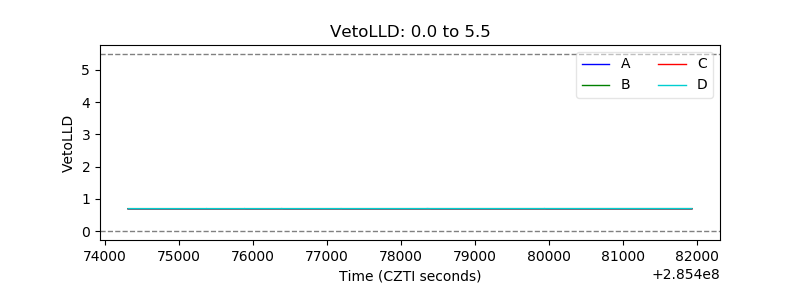 |
| Alpha Counter | 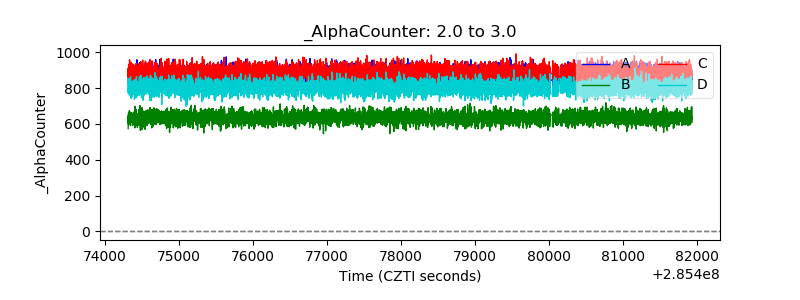 |
| _CPM_Rate | 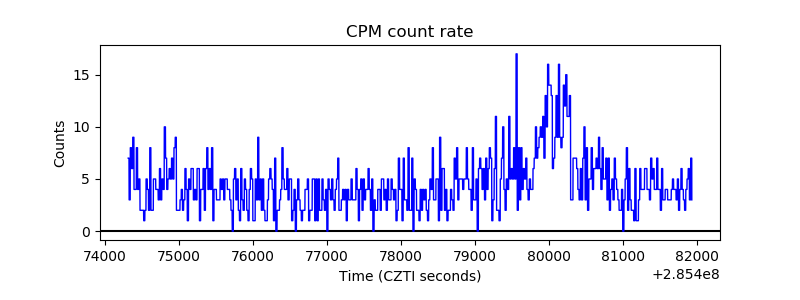 |
| CZT Counter | 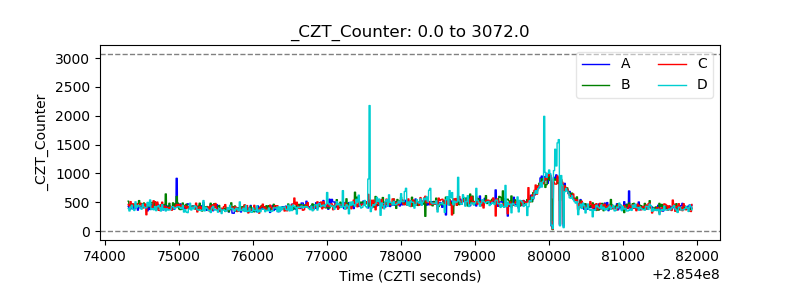 |
| +2.5 Volts monitor |  |
| +5 Volts monitor |  |
| _ROLL_ROT | 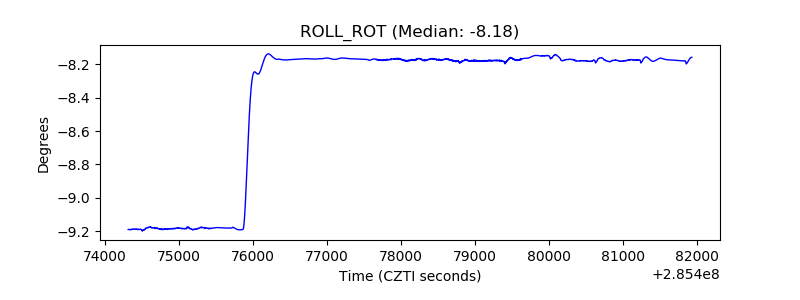 |
| _Roll_DEC | 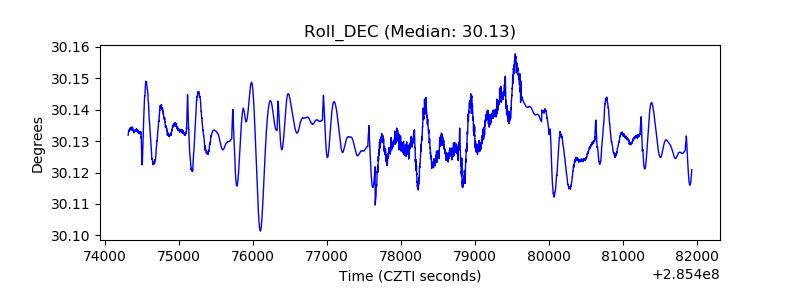 |
| _Roll_RA | 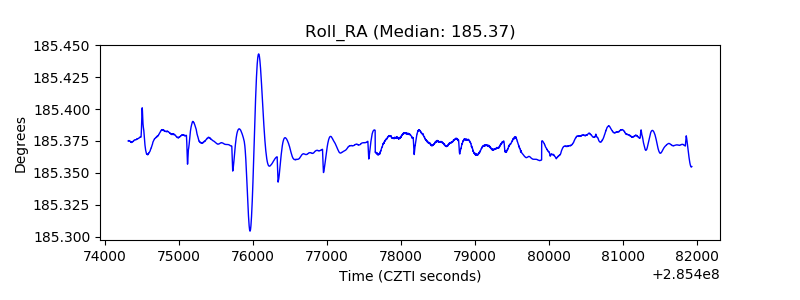 |
| Veto Counter | 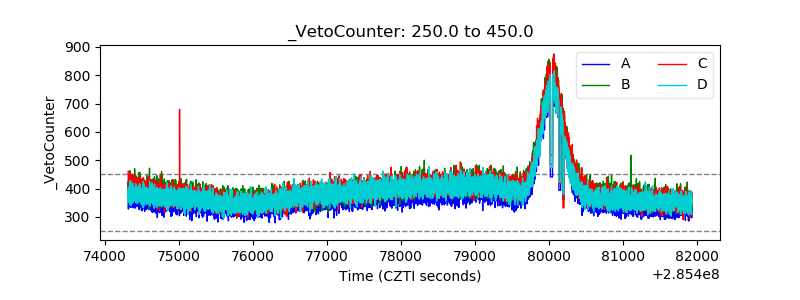 |