| Param | Original file | Final file |
|---|---|---|
| Filename | modeM0/AS1T03_075T01_9000002660_17881cztM0_level2.evt | modeM0/AS1T03_075T01_9000002660_17881cztM0_level2_quad_clean.evt |
| Size (bytes) | 479,304,000 | 102,332,160 |
| Size | 457.1 MB | 97.6 MB |
| Events in quadrant A | 3,438,447 | 645,805 |
| Events in quadrant B | 3,531,353 | 663,033 |
| Events in quadrant C | 3,502,985 | 638,506 |
| Events in quadrant D | 3,529,172 | 625,907 |
| Mode M9 | |||
|---|---|---|---|
| Quadrant | BADHDUFLAG | Total packets | Discarded packets |
| A | 0 | 1 | 0 |
| B | 0 | 1 | 0 |
| C | 0 | 1 | 0 |
| D | 0 | 1 | 0 |
| Mode SS | |||
|---|---|---|---|
| Quadrant | BADHDUFLAG | Total packets | Discarded packets |
| A | 0 | 152 | 0 |
| B | 0 | 152 | 0 |
| C | 0 | 152 | 0 |
| D | 0 | 152 | 0 |
| Mode M0 | |||
|---|---|---|---|
| Quadrant | BADHDUFLAG | Total packets | Discarded packets |
| A | 0 | 15483 | 1 |
| B | 0 | 15594 | 1 |
| C | 0 | 15505 | 1 |
| D | 0 | 15958 | 1 |
| Quadrant | Total seconds | Saturated seconds | Saturation percentage |
|---|---|---|---|
| A | 7557 | 185 | 2.448061% |
| B | 7557 | 195 | 2.580389% |
| C | 7557 | 188 | 2.487760% |
| D | 7557 | 134 | 1.773190% |
Noise dominated data is calculated using 1-second bins in cleaned event files. If a bin has >2000 counts, and if more than 50% of those come from <1% of pixels, then it is considered to be noise-dominated and hence unusable.
| Quadrant | # 1 sec bins | Bins with >0 counts | Bins with >2000 counts | High rate bins dominated by noise | Noise dominated (total time) | Noise dominated (detector-on time) | Marked lightcurve |
|---|---|---|---|---|---|---|---|
| A | 7667 | 7558 | 0 | 0 | 0.00% | 0.00% | 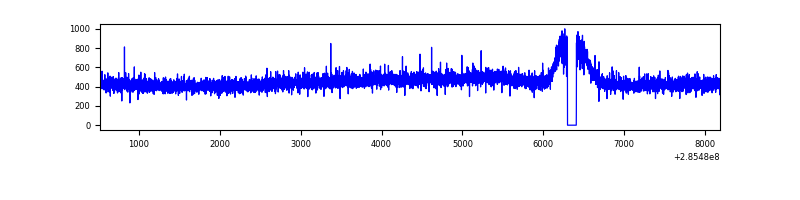 |
| B | 7667 | 7557 | 0 | 0 | 0.00% | 0.00% | 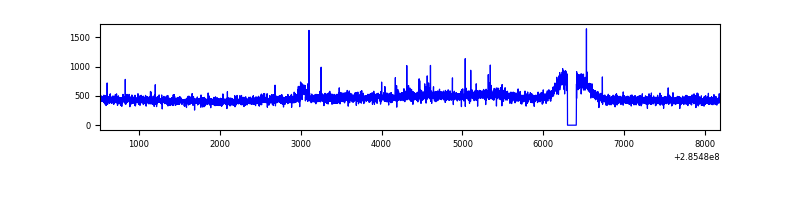 |
| C | 7667 | 7558 | 1 | 1 | 0.01% | 0.01% |  |
| D | 7667 | 7558 | 7 | 7 | 0.09% | 0.09% | 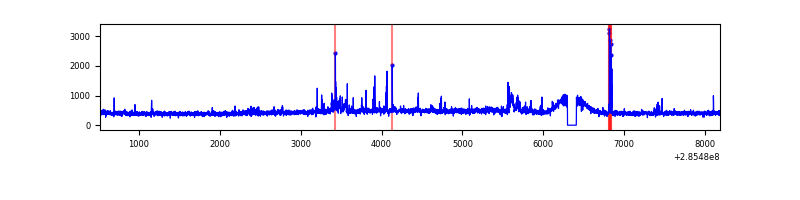 |
Top three noisy pixels from each quadrant. If the there are fewer than three noisy pixels in the level2.evt file, extra rows are filled as -1
| Pixel properties | Quadrant properties | ||||||
|---|---|---|---|---|---|---|---|
| Quadrant | DetID | PixID | Counts | Sigma | Mean | Median | Sigma |
| A | 0 | 226 | 7801 | 37.91 | 893 | 870 | 182.8 |
| A | 3 | 137 | 7039 | 33.75 | 893 | 870 | 182.8 |
| A | 12 | 194 | 6436 | 30.45 | 893 | 870 | 182.8 |
| B | 12 | 111 | 21287 | 118.2 | 892 | 868 | 172.7 |
| B | 11 | 111 | 18809 | 103.86 | 892 | 868 | 172.7 |
| B | 14 | 111 | 16080 | 88.06 | 892 | 868 | 172.7 |
| C | 14 | 238 | 131499 | 645.71 | 856 | 859 | 202.3 |
| C | 3 | 233 | 20524 | 97.2 | 856 | 859 | 202.3 |
| C | 13 | 61 | 6063 | 25.72 | 856 | 859 | 202.3 |
| D | 7 | 238 | 164172 | 762.16 | 867 | 840 | 214.3 |
| D | 2 | 234 | 26464 | 119.57 | 867 | 840 | 214.3 |
| D | 8 | 195 | 20740 | 92.86 | 867 | 840 | 214.3 |
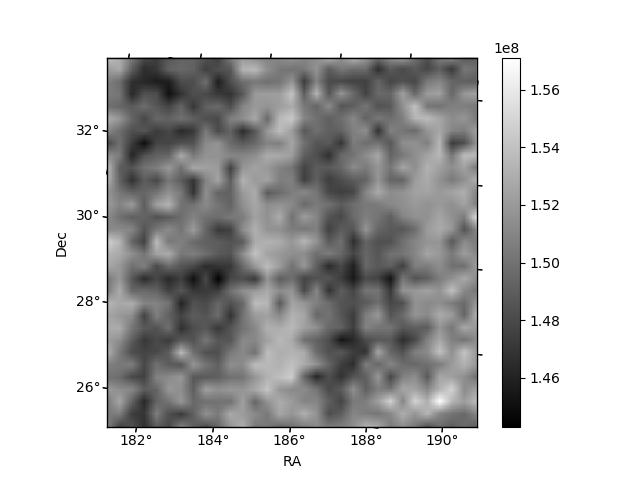
Histogram calculated using DETX and DETY for each event in the final _common_clean file
| Quadrant A |  |
 |
Quadrant B |
|---|---|---|---|
| Quadrant D | 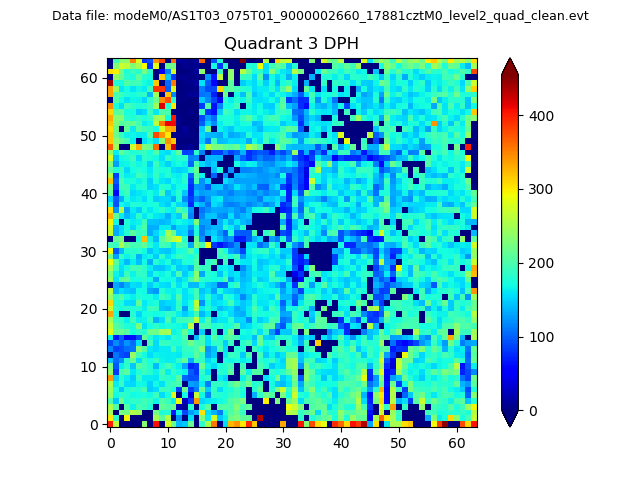 |
 |
Quadrant C |
| Plot type | Count rate plots | Images |
|---|---|---|
| Comparison with Poisson distribution Blue bars denote a histogram of data divided into 1 sec bins. Red curve is a Poisson curve with rate = median count rate of data. |
 |
 |
| Quadrant-wise count rates Data is divided into 100 sec bins |
 |
|
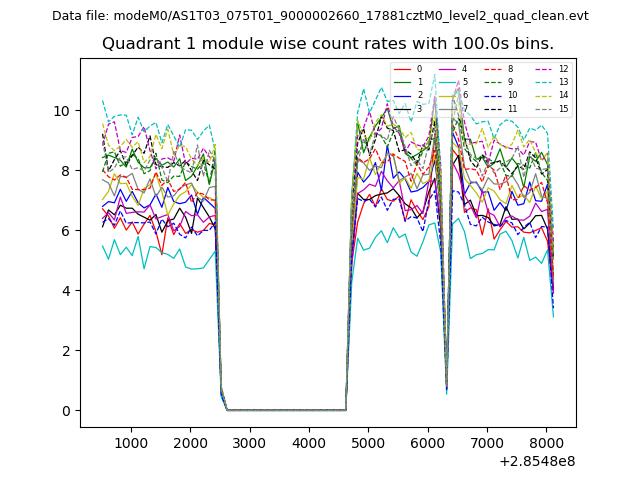
| Module-wise count rates for Quadrant A Data is divided into 100 sec bins |
 |
 |
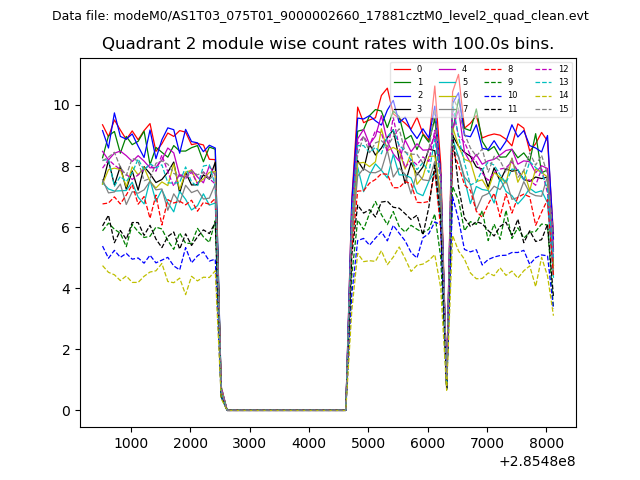
| Module-wise count rates for Quadrant B Data is divided into 100 sec bins |
 |
 |
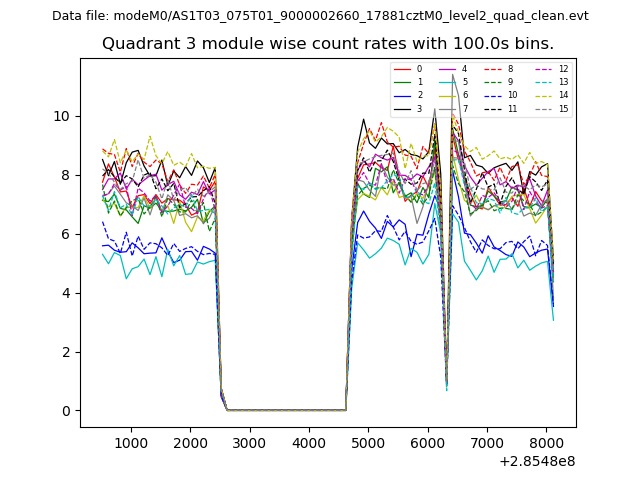
| Module-wise count rates for Quadrant C Data is divided into 100 sec bins |
 |
 |
| Module-wise count rates for Quadrant D Data is divided into 100 sec bins |
 |
 |
| Parameter | Plot |
|---|---|
| CZT HV Monitor | 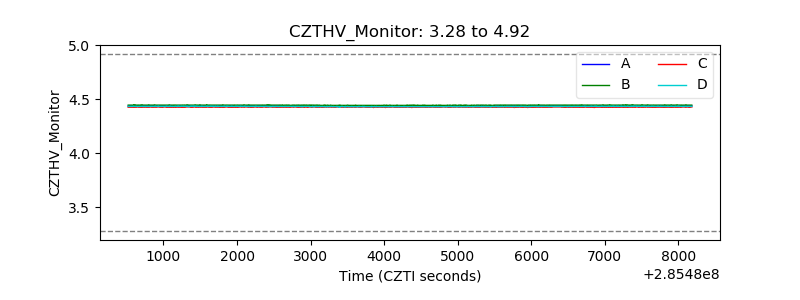 |
| D_VDD | 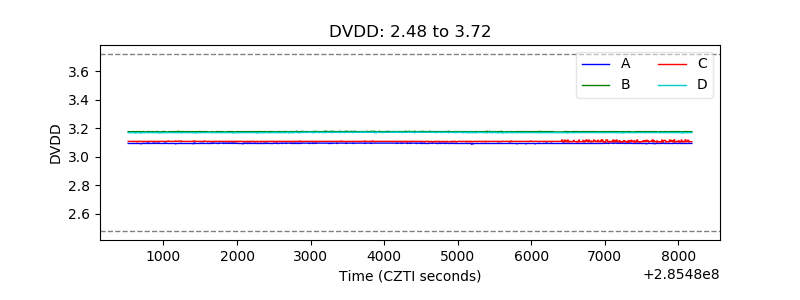 |
| Temperature 1 | 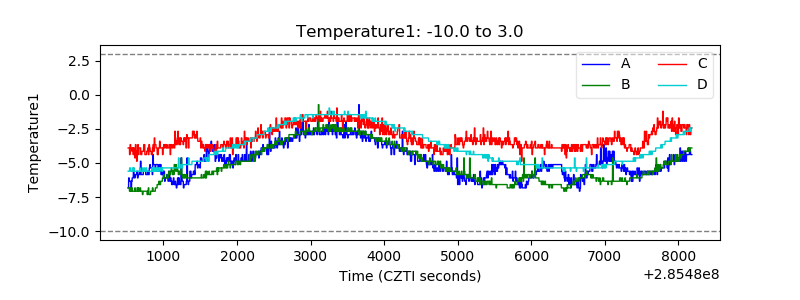 |
| Veto HV Monitor | 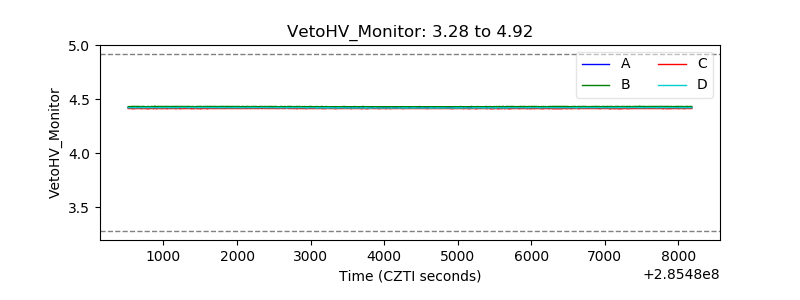 |
| Veto LLD | 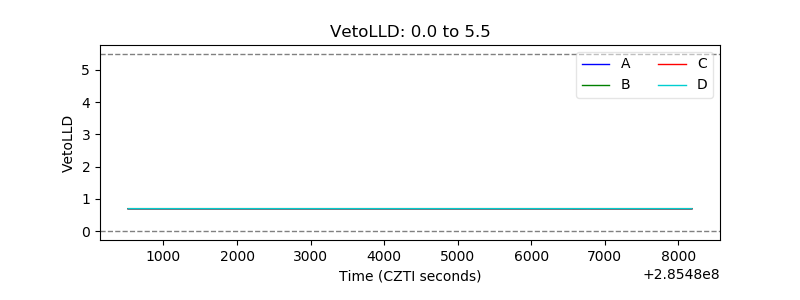 |
| Alpha Counter | 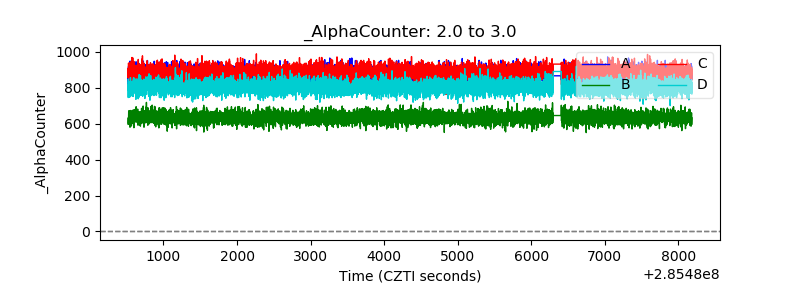 |
| _CPM_Rate | 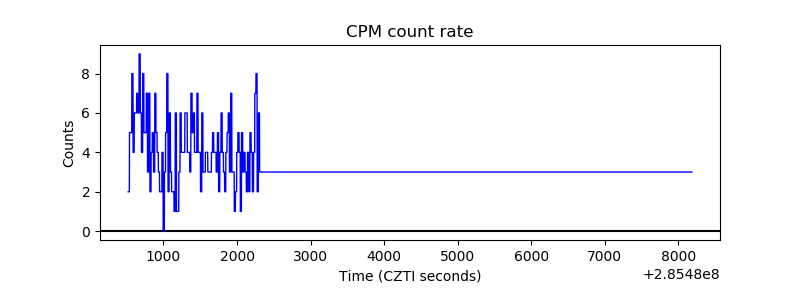 |
| CZT Counter | 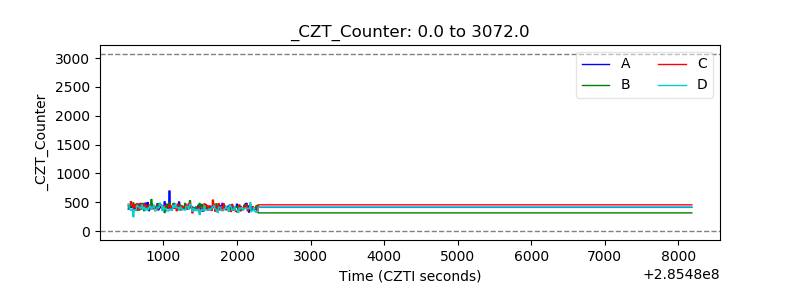 |
| +2.5 Volts monitor |  |
| +5 Volts monitor |  |
| _ROLL_ROT | 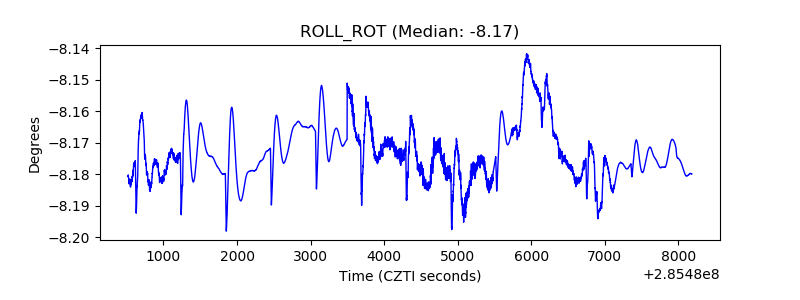 |
| _Roll_DEC | 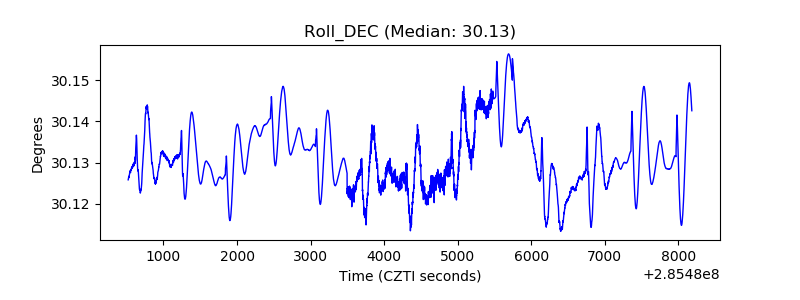 |
| _Roll_RA | 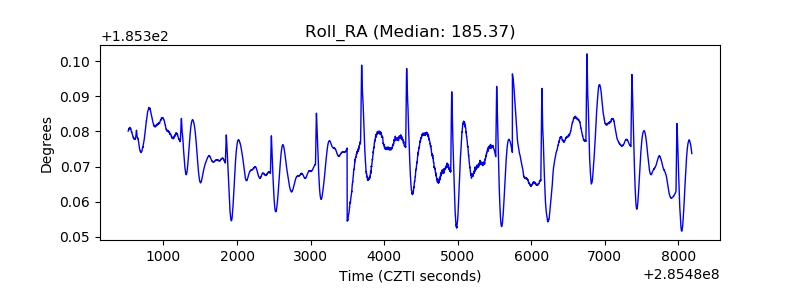 |
| Veto Counter | 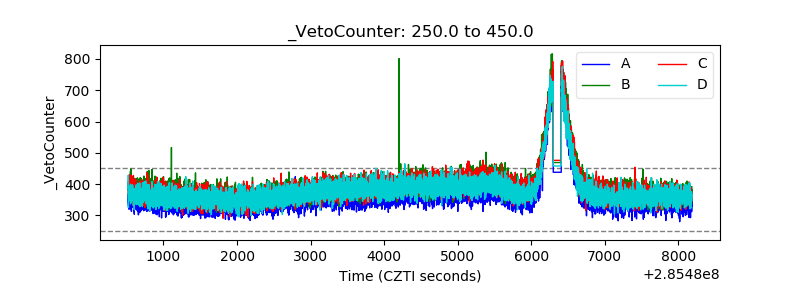 |