| Param | Original file | Final file |
|---|---|---|
| Filename | modeM0/AS1T03_075T01_9000002660_17884cztM0_level2.evt | modeM0/AS1T03_075T01_9000002660_17884cztM0_level2_quad_clean.evt |
| Size (bytes) | 869,544,000 | 149,857,920 |
| Size | 829.3 MB | 142.9 MB |
| Events in quadrant A | 5,494,247 | 933,016 |
| Events in quadrant B | 5,655,094 | 955,727 |
| Events in quadrant C | 5,610,471 | 916,810 |
| Events in quadrant D | 8,756,932 | 898,162 |
| Mode M9 | |||
|---|---|---|---|
| Quadrant | BADHDUFLAG | Total packets | Discarded packets |
| A | 0 | 10 | 0 |
| B | 0 | 10 | 0 |
| C | 0 | 10 | 0 |
| D | 0 | 10 | 0 |
| Mode SS | |||
|---|---|---|---|
| Quadrant | BADHDUFLAG | Total packets | Discarded packets |
| A | 0 | 244 | 0 |
| B | 0 | 244 | 0 |
| C | 0 | 244 | 0 |
| D | 0 | 244 | 0 |
| Mode M0 | |||
|---|---|---|---|
| Quadrant | BADHDUFLAG | Total packets | Discarded packets |
| A | 0 | 24541 | 2 |
| B | 0 | 24707 | 2 |
| C | 0 | 24567 | 2 |
| D | 0 | 34516 | 2 |
| Quadrant | Total seconds | Saturated seconds | Saturation percentage |
|---|---|---|---|
| A | 12073 | 181 | 1.499213% |
| B | 12074 | 183 | 1.515653% |
| C | 12074 | 213 | 1.764121% |
| D | 12074 | 1280 | 10.601292% |
Noise dominated data is calculated using 1-second bins in cleaned event files. If a bin has >2000 counts, and if more than 50% of those come from <1% of pixels, then it is considered to be noise-dominated and hence unusable.
| Quadrant | # 1 sec bins | Bins with >0 counts | Bins with >2000 counts | High rate bins dominated by noise | Noise dominated (total time) | Noise dominated (detector-on time) | Marked lightcurve |
|---|---|---|---|---|---|---|---|
| A | 12988 | 12074 | 0 | 0 | 0.00% | 0.00% | 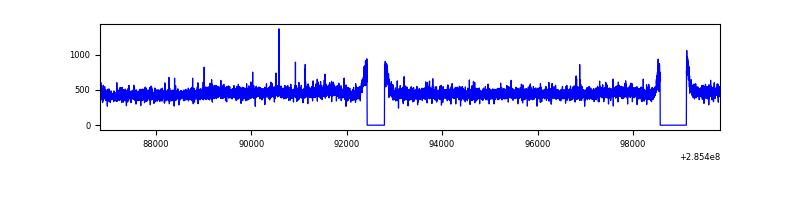 |
| B | 12989 | 12076 | 3 | 3 | 0.02% | 0.02% | 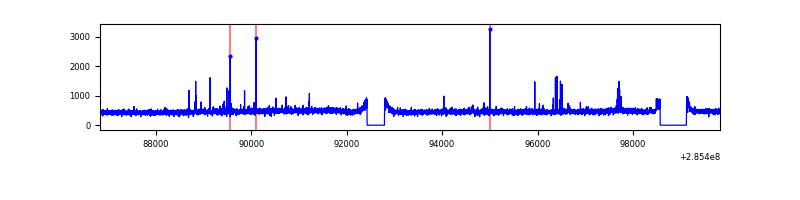 |
| C | 12989 | 12076 | 2 | 2 | 0.02% | 0.02% | 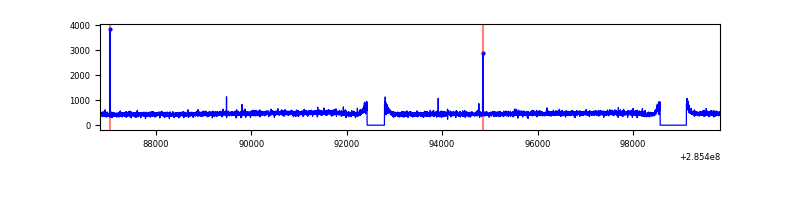 |
| D | 12989 | 12074 | 965 | 965 | 7.43% | 7.99% | 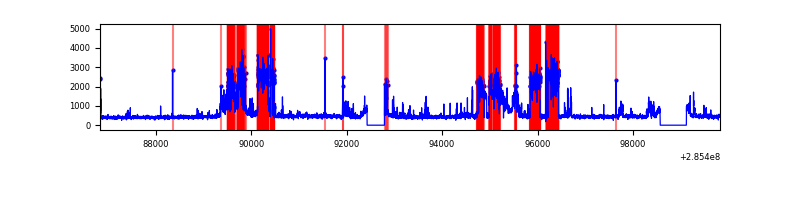 |
Top three noisy pixels from each quadrant. If the there are fewer than three noisy pixels in the level2.evt file, extra rows are filled as -1
| Pixel properties | Quadrant properties | ||||||
|---|---|---|---|---|---|---|---|
| Quadrant | DetID | PixID | Counts | Sigma | Mean | Median | Sigma |
| A | 15 | 174 | 18090 | 57.37 | 1424 | 1388 | 291.1 |
| A | 0 | 226 | 12191 | 37.11 | 1424 | 1388 | 291.1 |
| A | 3 | 137 | 11190 | 33.67 | 1424 | 1388 | 291.1 |
| B | 12 | 111 | 33929 | 119.12 | 1422 | 1386 | 273.2 |
| B | 11 | 111 | 29715 | 103.7 | 1422 | 1386 | 273.2 |
| B | 14 | 111 | 24731 | 85.45 | 1422 | 1386 | 273.2 |
| C | 14 | 238 | 208952 | 644.82 | 1366 | 1373 | 321.9 |
| C | 3 | 233 | 46113 | 138.98 | 1366 | 1373 | 321.9 |
| C | 9 | 54 | 17635 | 50.52 | 1366 | 1373 | 321.9 |
| D | 7 | 238 | 3530859 | 10892.31 | 1320 | 1275 | 324.0 |
| D | 10 | 70 | 56302 | 169.81 | 1320 | 1275 | 324.0 |
| D | 7 | 38 | 48977 | 147.21 | 1320 | 1275 | 324.0 |
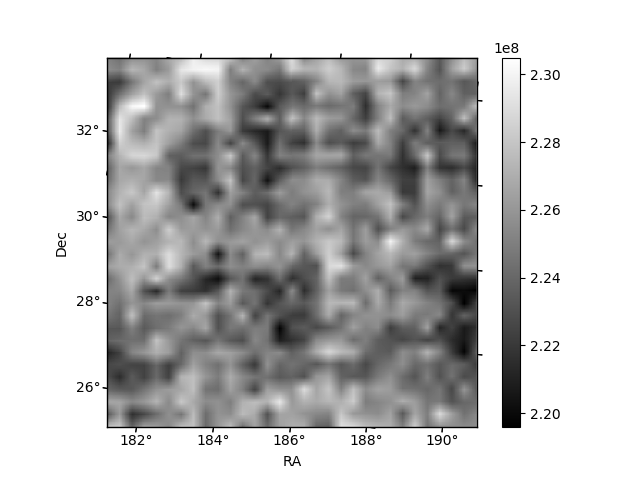
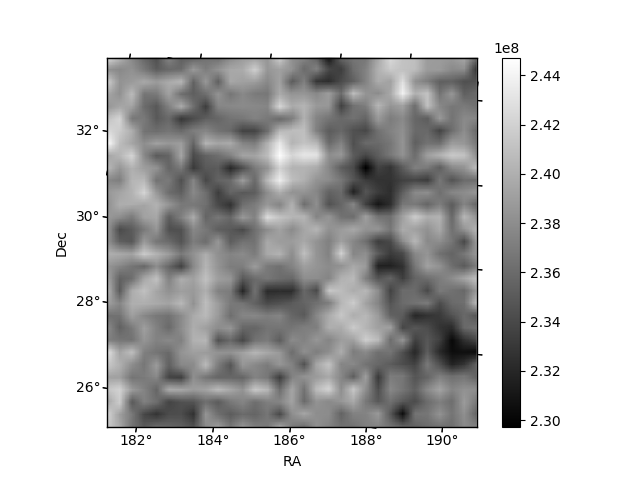
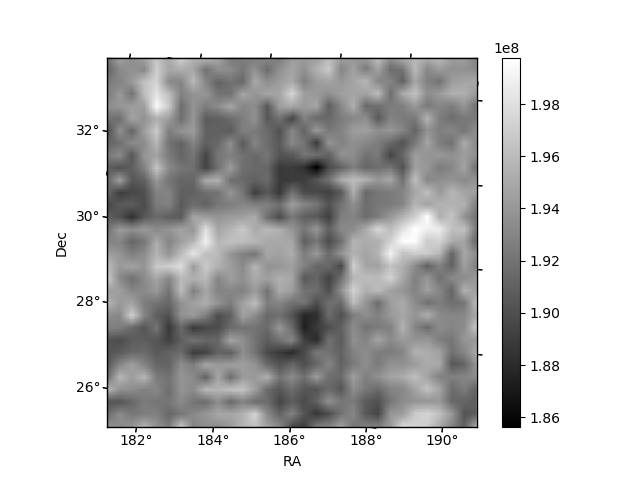
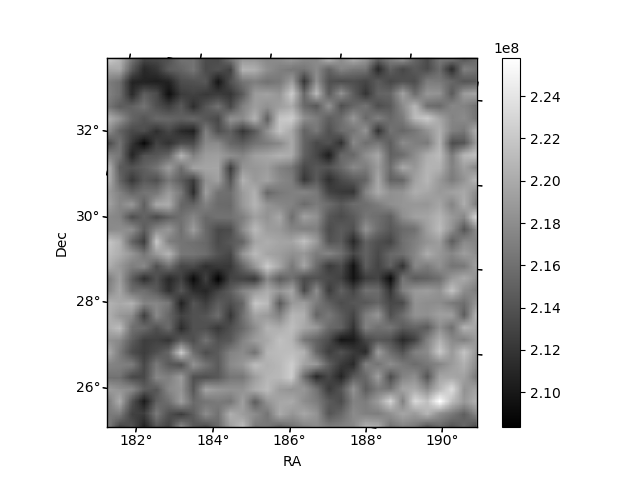
Histogram calculated using DETX and DETY for each event in the final _common_clean file
| Quadrant A |  |
 |
Quadrant B |
|---|---|---|---|
| Quadrant D |  |
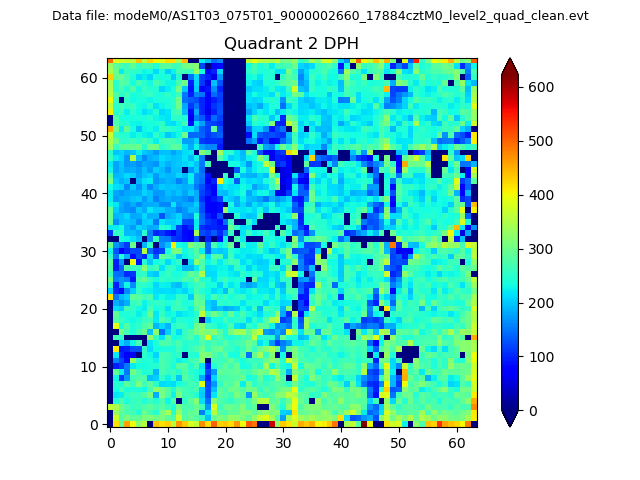 |
Quadrant C |
| Plot type | Count rate plots | Images |
|---|---|---|
| Comparison with Poisson distribution Blue bars denote a histogram of data divided into 1 sec bins. Red curve is a Poisson curve with rate = median count rate of data. |
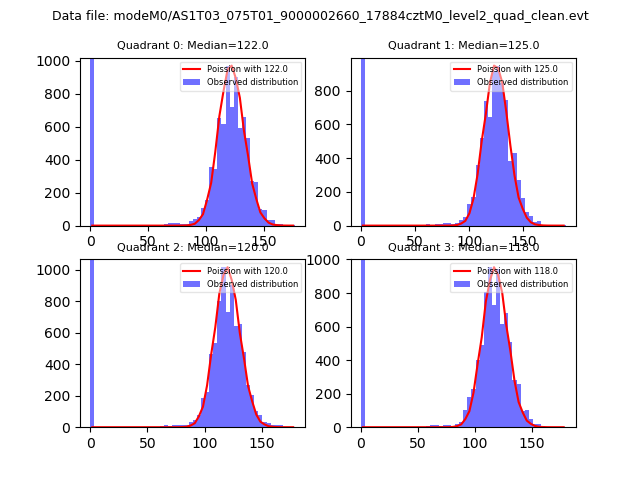 |
 |
| Quadrant-wise count rates Data is divided into 100 sec bins |
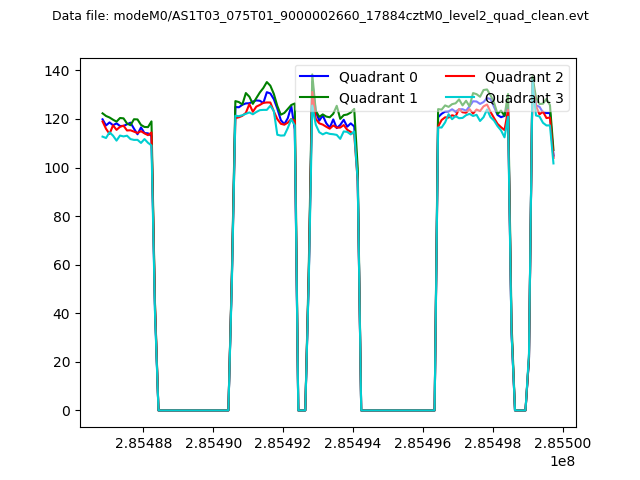 |
|
| Module-wise count rates for Quadrant A Data is divided into 100 sec bins |
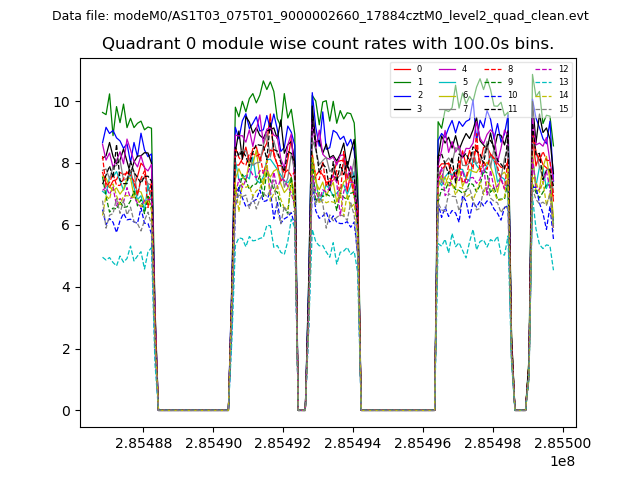 |
 |
| Module-wise count rates for Quadrant B Data is divided into 100 sec bins |
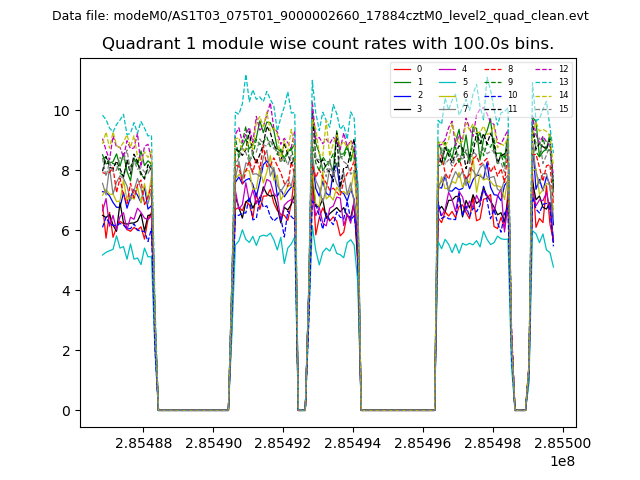 |
 |
| Module-wise count rates for Quadrant C Data is divided into 100 sec bins |
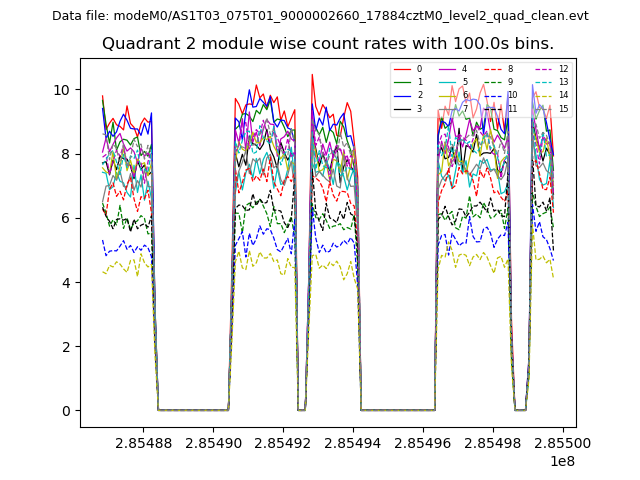 |
 |
| Module-wise count rates for Quadrant D Data is divided into 100 sec bins |
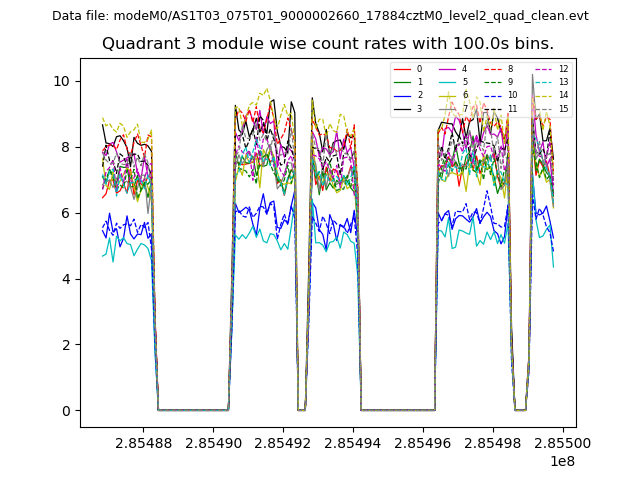 |
 |
| Parameter | Plot |
|---|---|
| CZT HV Monitor |  |
| D_VDD | 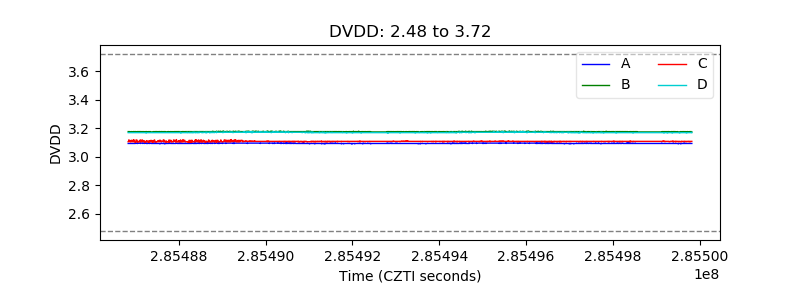 |
| Temperature 1 | 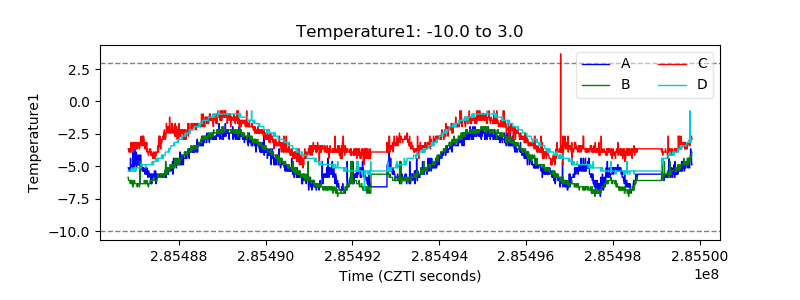 |
| Veto HV Monitor | 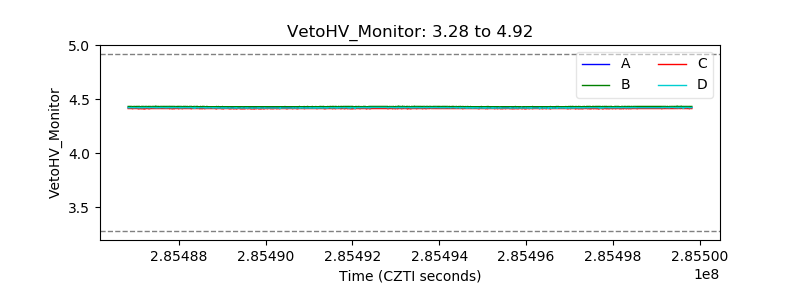 |
| Veto LLD | 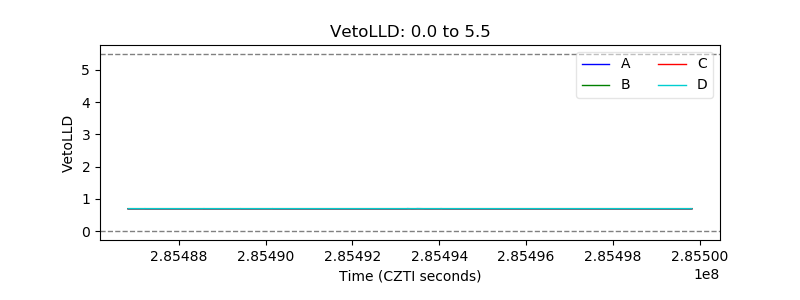 |
| Alpha Counter | 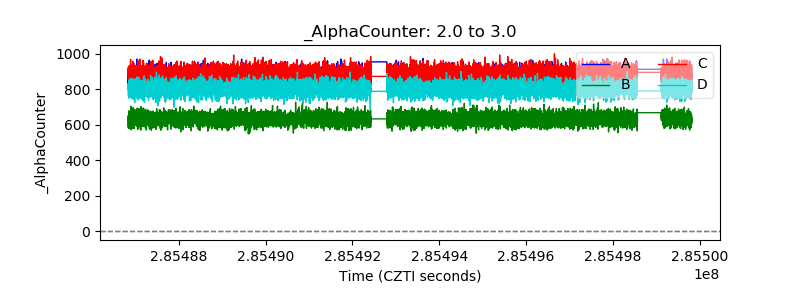 |
| _CPM_Rate | 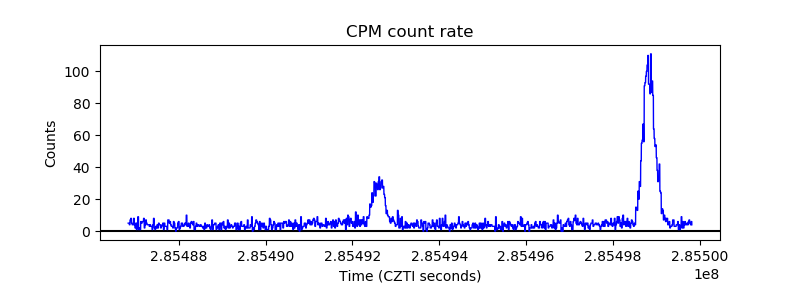 |
| CZT Counter | 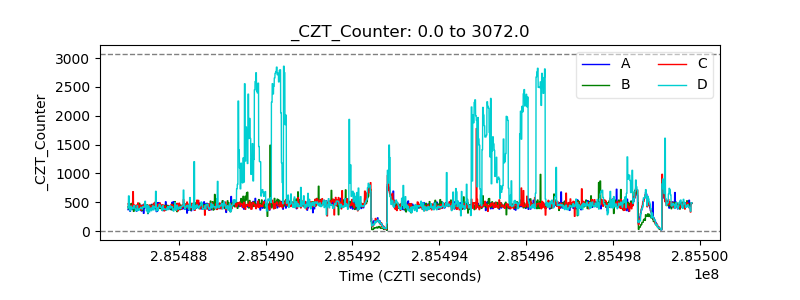 |
| +2.5 Volts monitor |  |
| +5 Volts monitor | 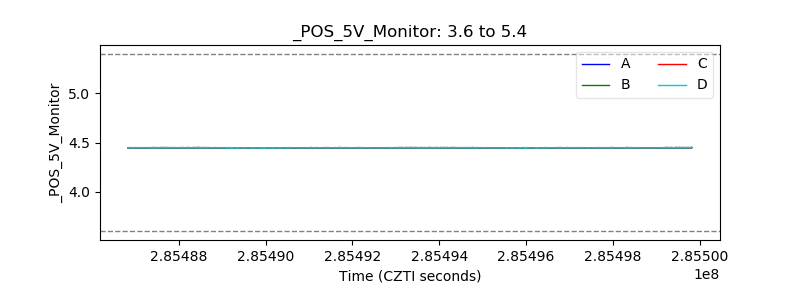 |
| _ROLL_ROT | 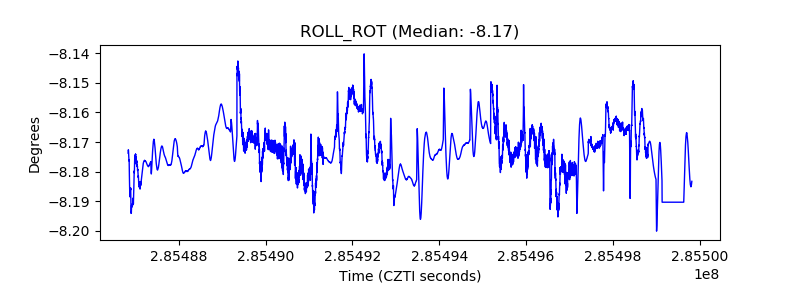 |
| _Roll_DEC | 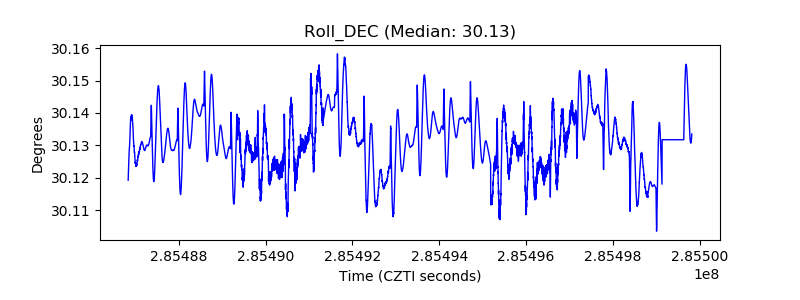 |
| _Roll_RA | 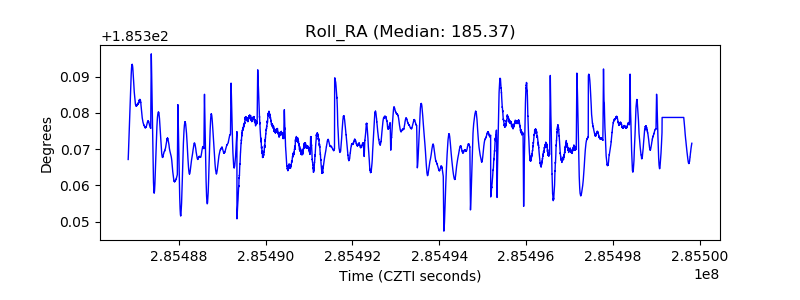 |
| Veto Counter | 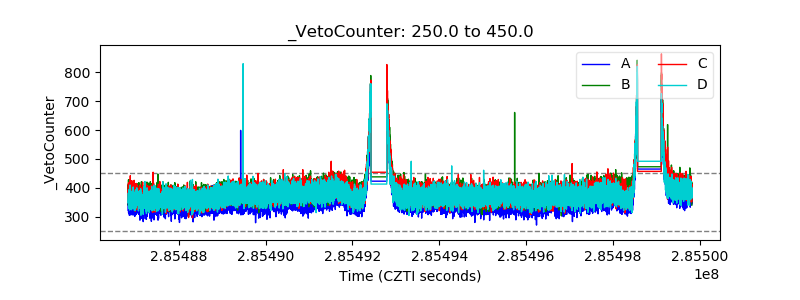 |