| Param | Original file | Final file |
|---|---|---|
| Filename | modeM0/AS1T03_075T01_9000002660_17887cztM0_level2.evt | modeM0/AS1T03_075T01_9000002660_17887cztM0_level2_quad_clean.evt |
| Size (bytes) | 485,438,400 | 63,696,960 |
| Size | 463.0 MB | 60.7 MB |
| Events in quadrant A | 3,260,053 | 374,384 |
| Events in quadrant B | 3,411,108 | 379,887 |
| Events in quadrant C | 3,409,224 | 367,133 |
| Events in quadrant D | 4,172,335 | 346,233 |
| Mode M9 | |||
|---|---|---|---|
| Quadrant | BADHDUFLAG | Total packets | Discarded packets |
| A | 0 | 12 | 0 |
| B | 0 | 13 | 0 |
| C | 0 | 13 | 0 |
| D | 0 | 13 | 0 |
| Mode SS | |||
|---|---|---|---|
| Quadrant | BADHDUFLAG | Total packets | Discarded packets |
| A | 0 | 134 | 0 |
| B | 0 | 134 | 0 |
| C | 0 | 134 | 0 |
| D | 0 | 134 | 0 |
| Mode M0 | |||
|---|---|---|---|
| Quadrant | BADHDUFLAG | Total packets | Discarded packets |
| A | 0 | 13985 | 2 |
| B | 0 | 14441 | 2 |
| C | 0 | 14429 | 2 |
| D | 0 | 16951 | 2 |
| Quadrant | Total seconds | Saturated seconds | Saturation percentage |
|---|---|---|---|
| A | 6609 | 50 | 0.756544% |
| B | 6609 | 84 | 1.270994% |
| C | 6609 | 87 | 1.316387% |
| D | 6609 | 331 | 5.008322% |
Noise dominated data is calculated using 1-second bins in cleaned event files. If a bin has >2000 counts, and if more than 50% of those come from <1% of pixels, then it is considered to be noise-dominated and hence unusable.
| Quadrant | # 1 sec bins | Bins with >0 counts | Bins with >2000 counts | High rate bins dominated by noise | Noise dominated (total time) | Noise dominated (detector-on time) | Marked lightcurve |
|---|---|---|---|---|---|---|---|
| A | 7714 | 6610 | 4 | 4 | 0.05% | 0.06% | 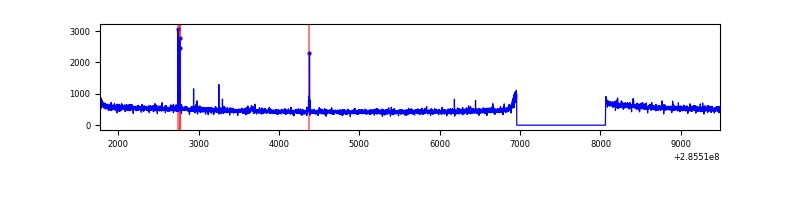 |
| B | 7714 | 6610 | 19 | 19 | 0.25% | 0.29% | 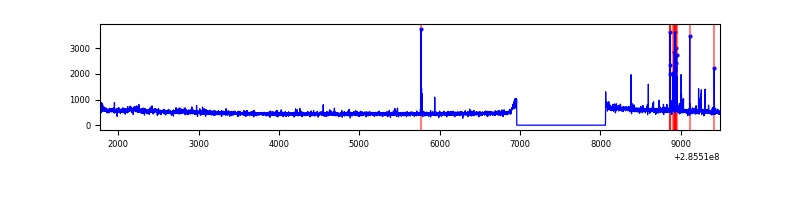 |
| C | 7714 | 6610 | 0 | 0 | 0.00% | 0.00% | 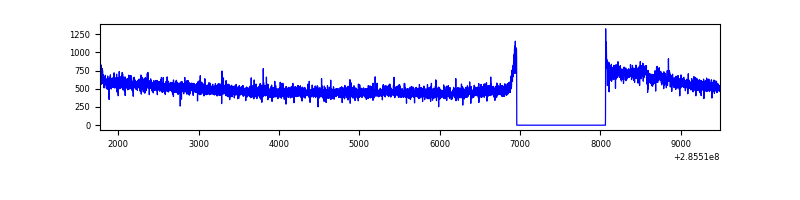 |
| D | 7714 | 6609 | 291 | 291 | 3.77% | 4.40% | 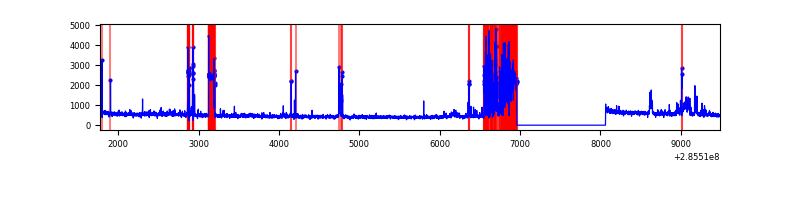 |
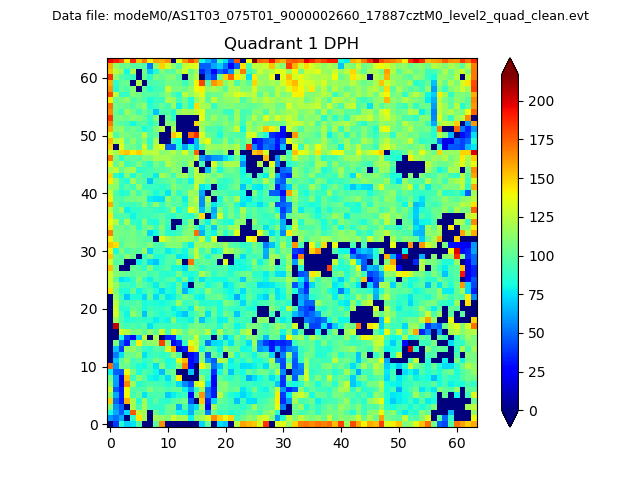
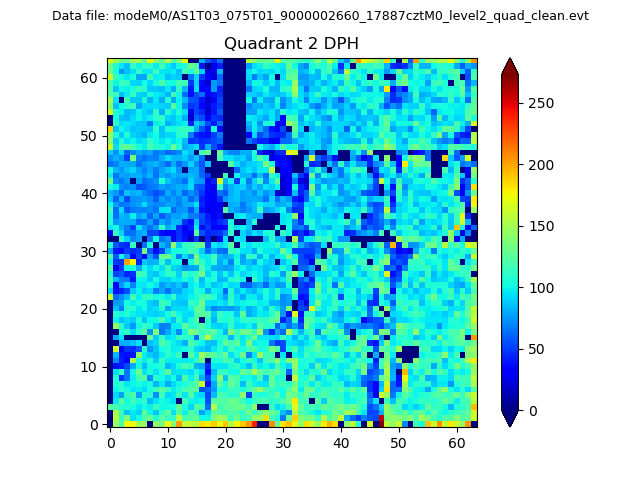
Top three noisy pixels from each quadrant. If the there are fewer than three noisy pixels in the level2.evt file, extra rows are filled as -1
| Pixel properties | Quadrant properties | ||||||
|---|---|---|---|---|---|---|---|
| Quadrant | DetID | PixID | Counts | Sigma | Mean | Median | Sigma |
| A | 15 | 174 | 15631 | 87.04 | 842 | 823 | 170.1 |
| A | 15 | 191 | 8215 | 43.45 | 842 | 823 | 170.1 |
| A | 0 | 226 | 7122 | 37.03 | 842 | 823 | 170.1 |
| B | 7 | 220 | 72121 | 445.01 | 838 | 817 | 160.2 |
| B | 12 | 111 | 18330 | 109.3 | 838 | 817 | 160.2 |
| B | 11 | 111 | 16224 | 96.16 | 838 | 817 | 160.2 |
| C | 14 | 238 | 127226 | 665.74 | 814 | 821 | 189.9 |
| C | 3 | 233 | 105925 | 553.55 | 814 | 821 | 189.9 |
| C | 13 | 61 | 5684 | 25.61 | 814 | 821 | 189.9 |
| D | 7 | 238 | 760846 | 3872.24 | 800 | 777 | 196.3 |
| D | 7 | 38 | 281224 | 1428.76 | 800 | 777 | 196.3 |
| D | 13 | 168 | 45065 | 225.63 | 800 | 777 | 196.3 |
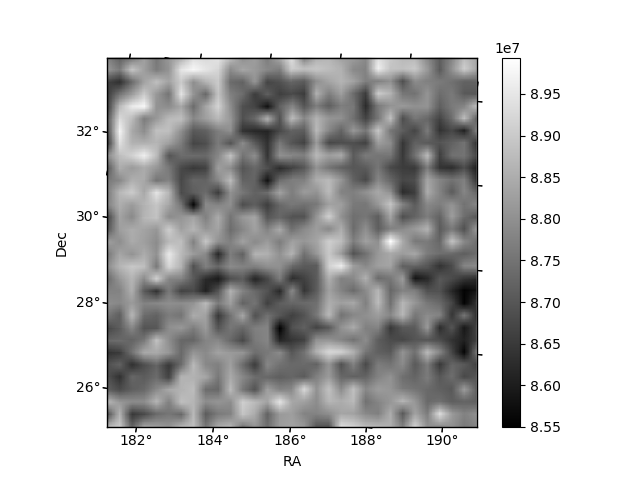
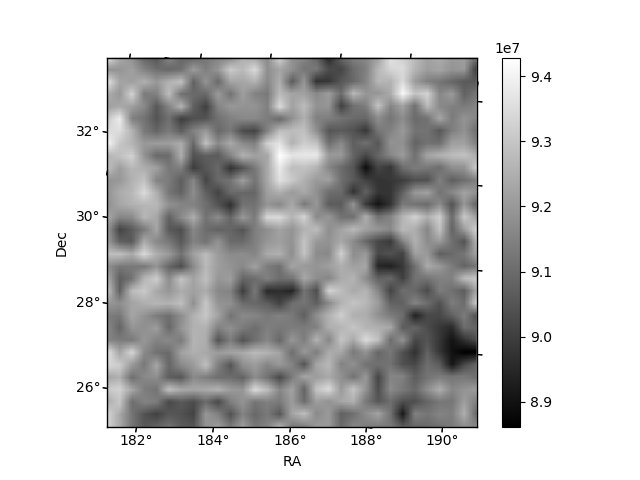
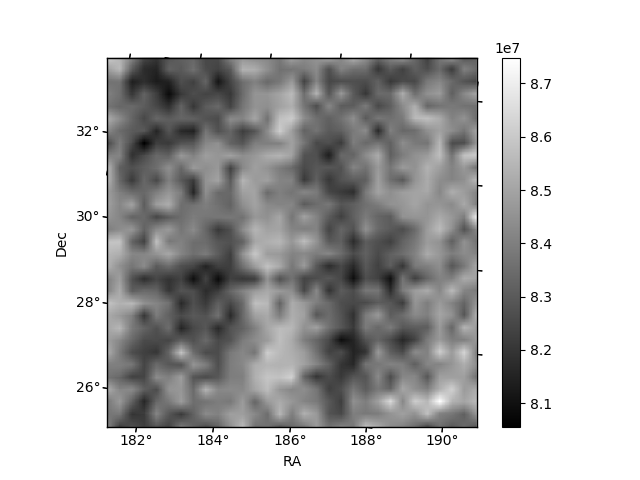
Histogram calculated using DETX and DETY for each event in the final _common_clean file
| Quadrant A | 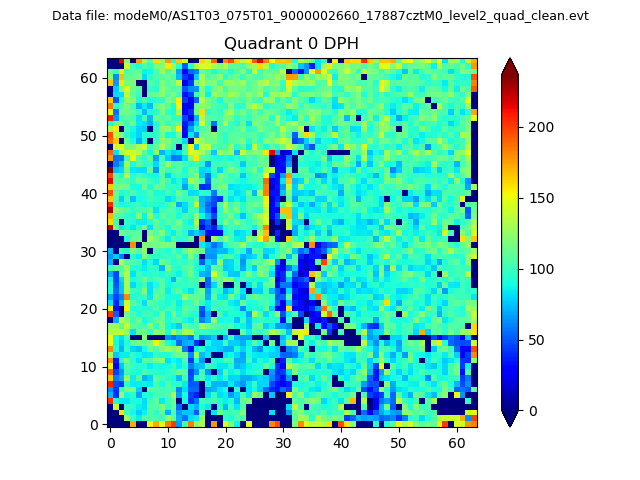 |
 |
Quadrant B |
|---|---|---|---|
| Quadrant D | 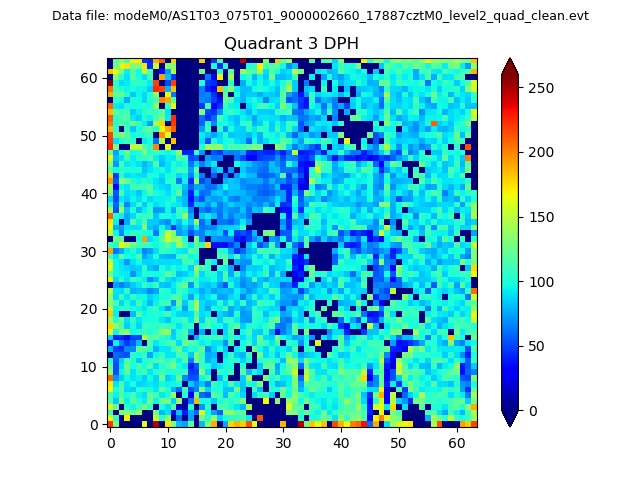 |
 |
Quadrant C |
| Plot type | Count rate plots | Images |
|---|---|---|
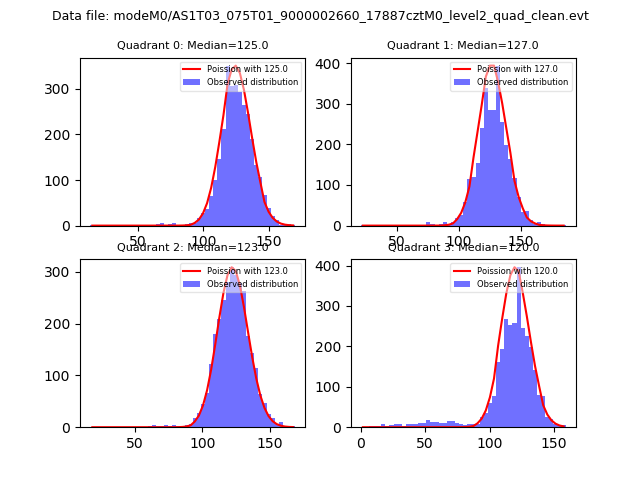
| Comparison with Poisson distribution Blue bars denote a histogram of data divided into 1 sec bins. Red curve is a Poisson curve with rate = median count rate of data. |
 |
 |
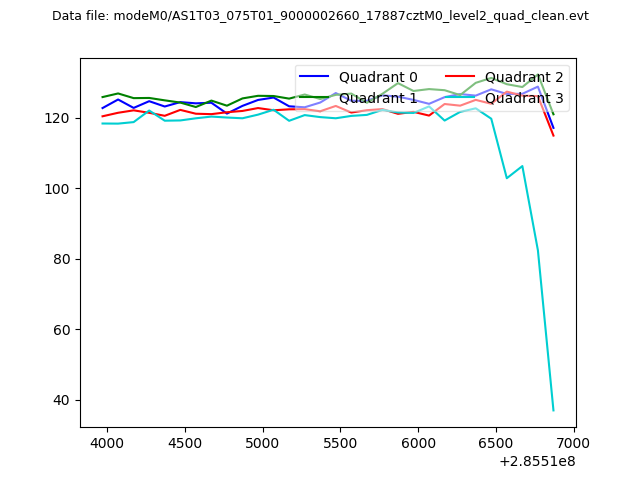
| Quadrant-wise count rates Data is divided into 100 sec bins |
 |
|
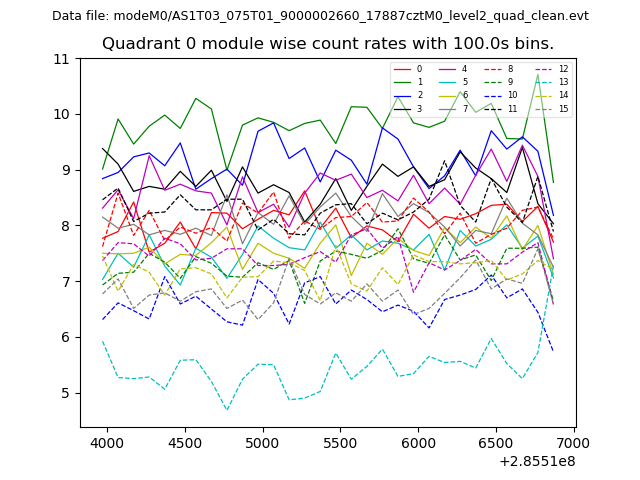
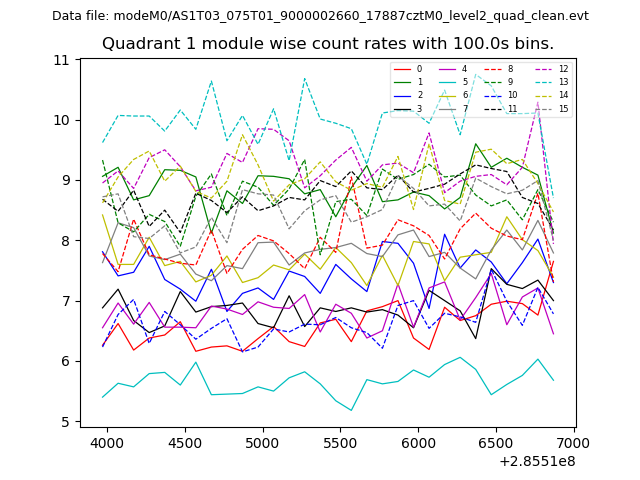
| Module-wise count rates for Quadrant A Data is divided into 100 sec bins |
 |
 |
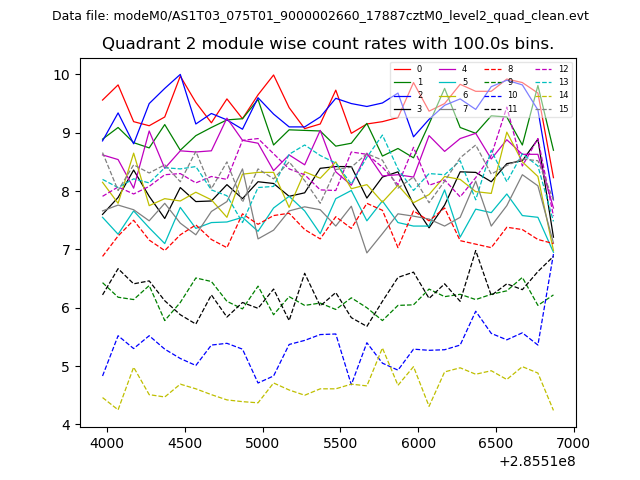
| Module-wise count rates for Quadrant B Data is divided into 100 sec bins |
 |
 |
| Module-wise count rates for Quadrant C Data is divided into 100 sec bins |
 |
 |
| Module-wise count rates for Quadrant D Data is divided into 100 sec bins |
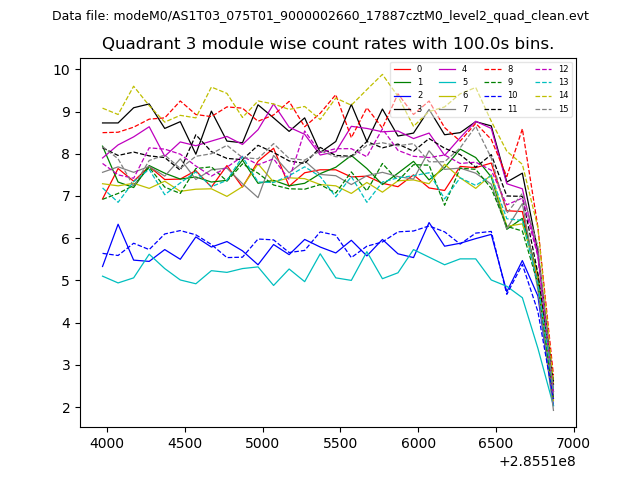 |
 |
| Parameter | Plot |
|---|---|
| CZT HV Monitor | 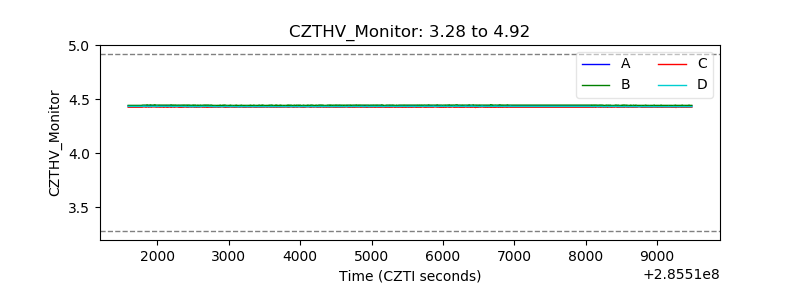 |
| D_VDD | 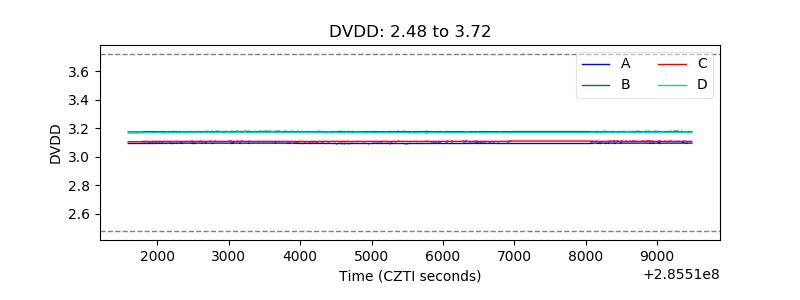 |
| Temperature 1 |  |
| Veto HV Monitor | 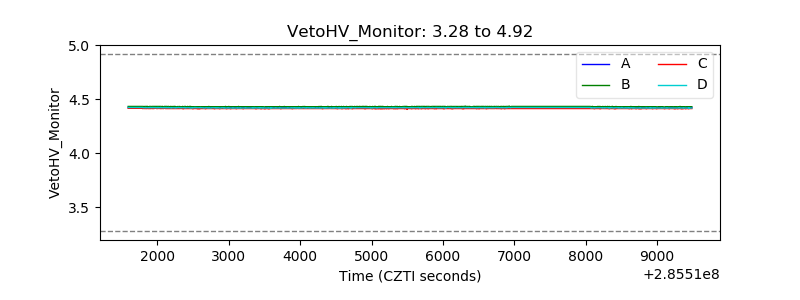 |
| Veto LLD | 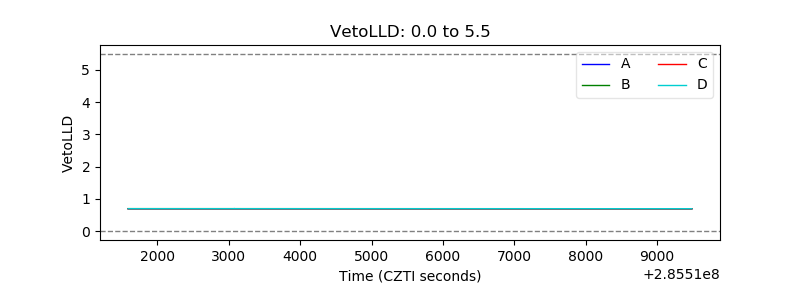 |
| Alpha Counter | 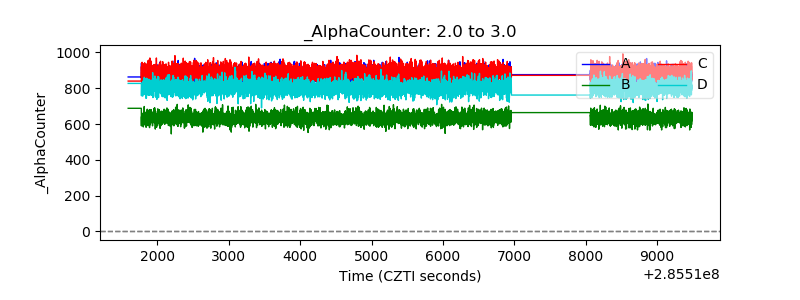 |
| _CPM_Rate | 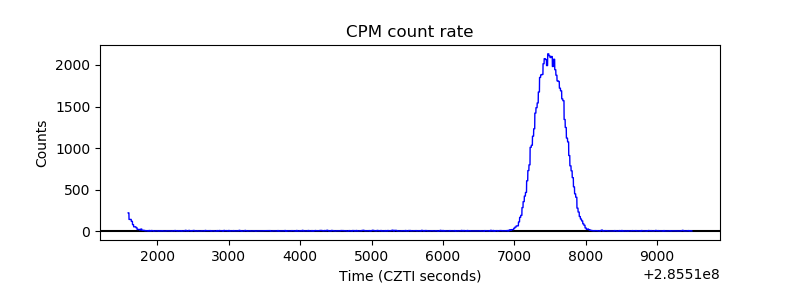 |
| CZT Counter | 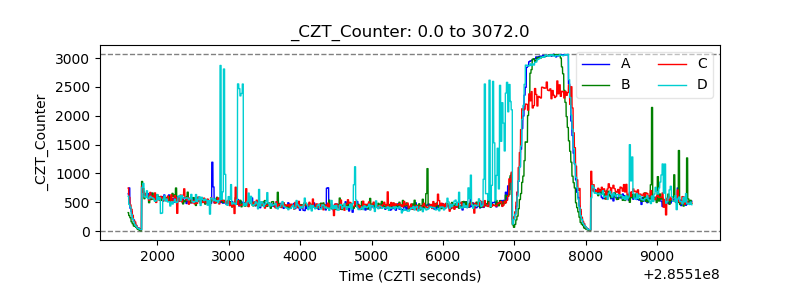 |
| +2.5 Volts monitor |  |
| +5 Volts monitor |  |
| _ROLL_ROT | 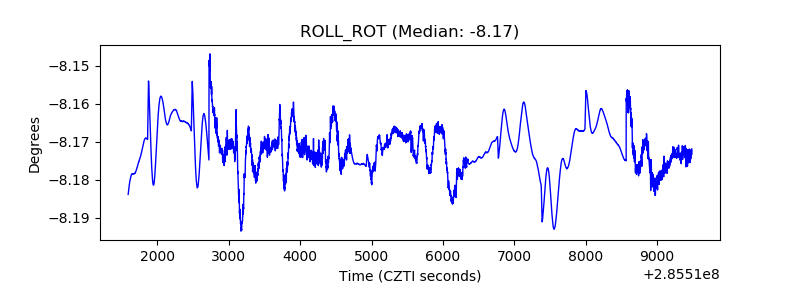 |
| _Roll_DEC |  |
| _Roll_RA | 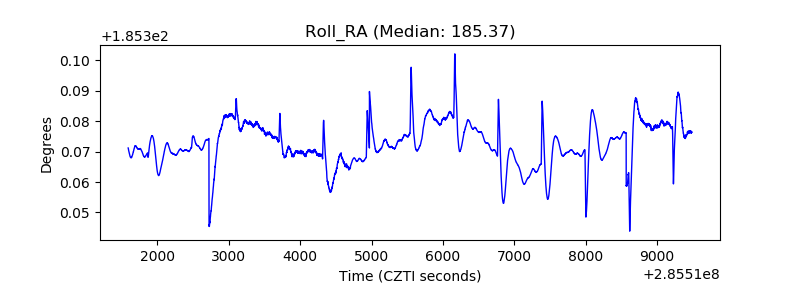 |
| Veto Counter | 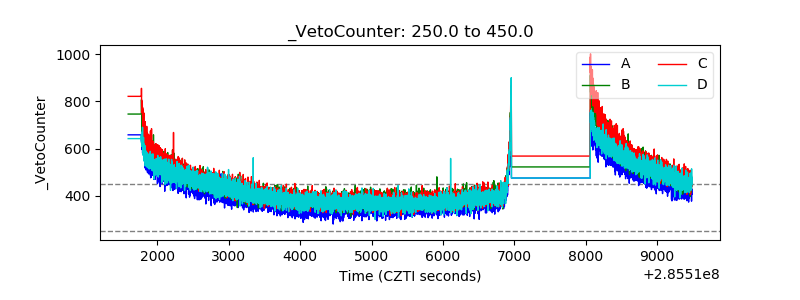 |