| Param | Original file | Final file |
|---|---|---|
| Filename | modeM0/AS1T03_075T01_9000002660_17890cztM0_level2.evt | modeM0/AS1T03_075T01_9000002660_17890cztM0_level2_quad_clean.evt |
| Size (bytes) | 474,649,920 | 97,551,360 |
| Size | 452.7 MB | 93.0 MB |
| Events in quadrant A | 3,321,292 | 629,560 |
| Events in quadrant B | 3,464,065 | 652,276 |
| Events in quadrant C | 3,466,946 | 628,590 |
| Events in quadrant D | 3,700,625 | 610,093 |
| Mode M9 | |||
|---|---|---|---|
| Quadrant | BADHDUFLAG | Total packets | Discarded packets |
| A | 0 | 27 | 0 |
| B | 0 | 27 | 0 |
| C | 0 | 27 | 0 |
| D | 0 | 27 | 0 |
| Mode SS | |||
|---|---|---|---|
| Quadrant | BADHDUFLAG | Total packets | Discarded packets |
| A | 0 | 128 | 0 |
| B | 0 | 128 | 0 |
| C | 0 | 128 | 0 |
| D | 0 | 128 | 0 |
| Mode M0 | |||
|---|---|---|---|
| Quadrant | BADHDUFLAG | Total packets | Discarded packets |
| A | 0 | 13925 | 2 |
| B | 0 | 14285 | 2 |
| C | 0 | 14325 | 2 |
| D | 0 | 15351 | 2 |
| Quadrant | Total seconds | Saturated seconds | Saturation percentage |
|---|---|---|---|
| A | 6217 | 68 | 1.093775% |
| B | 6218 | 92 | 1.479575% |
| C | 6218 | 162 | 2.605339% |
| D | 6217 | 79 | 1.270709% |
Noise dominated data is calculated using 1-second bins in cleaned event files. If a bin has >2000 counts, and if more than 50% of those come from <1% of pixels, then it is considered to be noise-dominated and hence unusable.
| Quadrant | # 1 sec bins | Bins with >0 counts | Bins with >2000 counts | High rate bins dominated by noise | Noise dominated (total time) | Noise dominated (detector-on time) | Marked lightcurve |
|---|---|---|---|---|---|---|---|
| A | 8912 | 6219 | 0 | 0 | 0.00% | 0.00% |  |
| B | 8913 | 6220 | 5 | 5 | 0.06% | 0.08% | 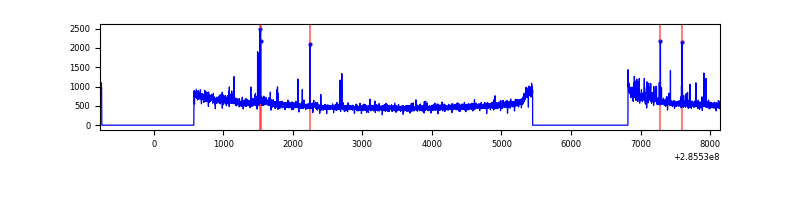 |
| C | 8913 | 6220 | 29 | 29 | 0.33% | 0.47% | 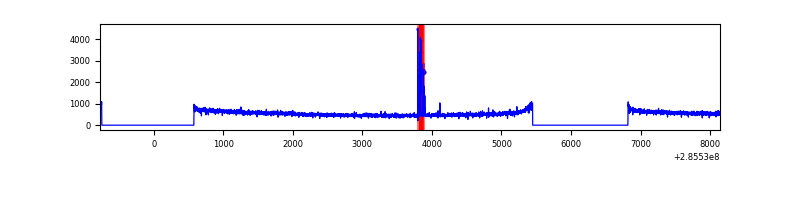 |
| D | 8912 | 6219 | 24 | 24 | 0.27% | 0.39% | 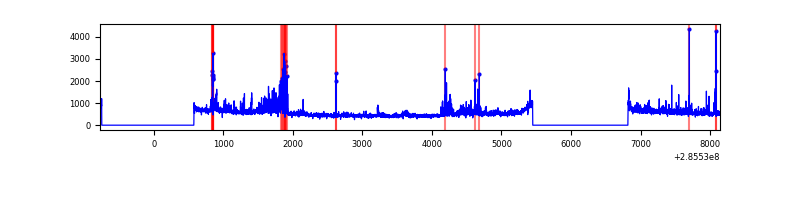 |
Top three noisy pixels from each quadrant. If the there are fewer than three noisy pixels in the level2.evt file, extra rows are filled as -1
| Pixel properties | Quadrant properties | ||||||
|---|---|---|---|---|---|---|---|
| Quadrant | DetID | PixID | Counts | Sigma | Mean | Median | Sigma |
| A | 6 | 16 | 108837 | 651.52 | 834 | 821 | 165.8 |
| A | 0 | 226 | 7273 | 38.92 | 834 | 821 | 165.8 |
| A | 12 | 194 | 6185 | 32.35 | 834 | 821 | 165.8 |
| B | 0 | 189 | 78076 | 486.94 | 847 | 829 | 158.6 |
| B | 0 | 197 | 41876 | 258.75 | 847 | 829 | 158.6 |
| B | 12 | 111 | 18018 | 108.35 | 847 | 829 | 158.6 |
| C | 14 | 238 | 127996 | 668.54 | 819 | 828 | 190.2 |
| C | 9 | 54 | 101585 | 529.7 | 819 | 828 | 190.2 |
| C | 3 | 233 | 25784 | 131.2 | 819 | 828 | 190.2 |
| D | 12 | 110 | 339580 | 1708.53 | 823 | 802 | 198.3 |
| D | 13 | 168 | 91979 | 459.82 | 823 | 802 | 198.3 |
| D | 10 | 70 | 51596 | 256.16 | 823 | 802 | 198.3 |
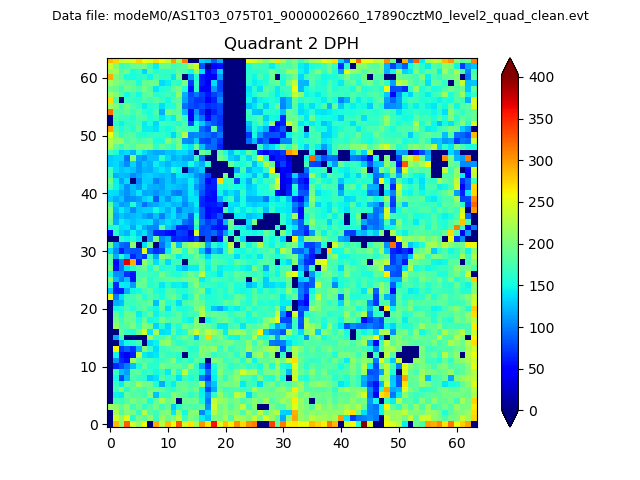
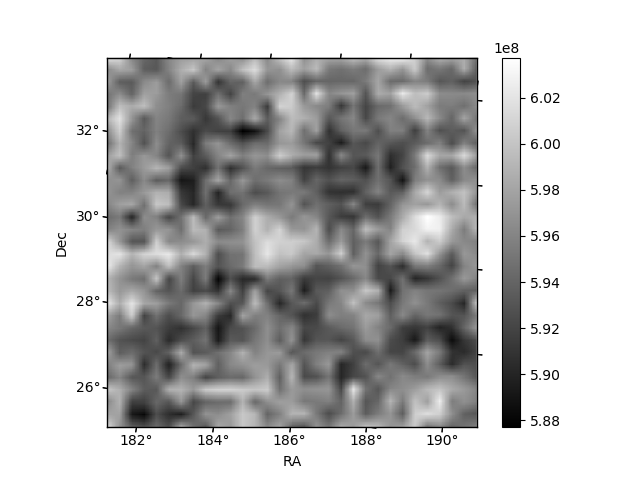
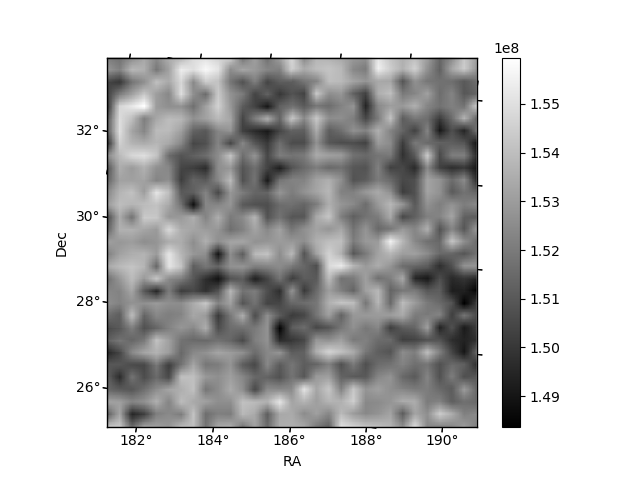
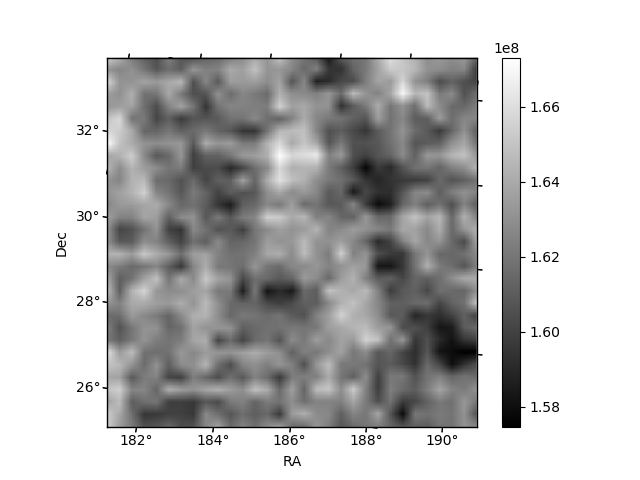
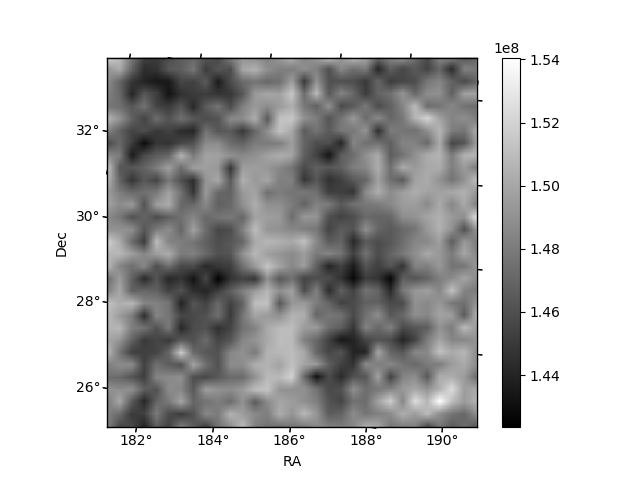
Histogram calculated using DETX and DETY for each event in the final _common_clean file
| Quadrant A | 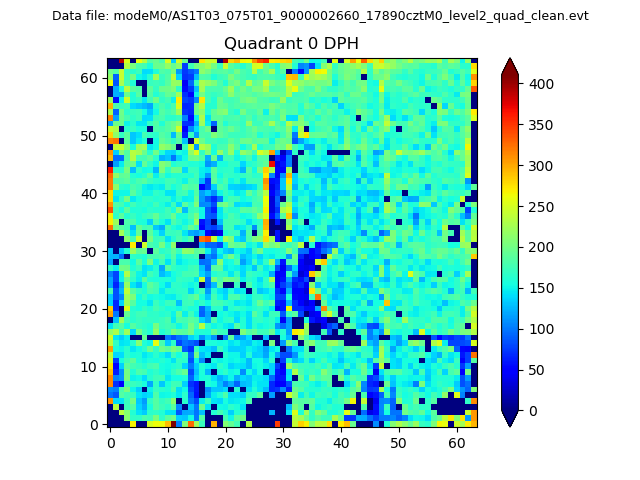 |
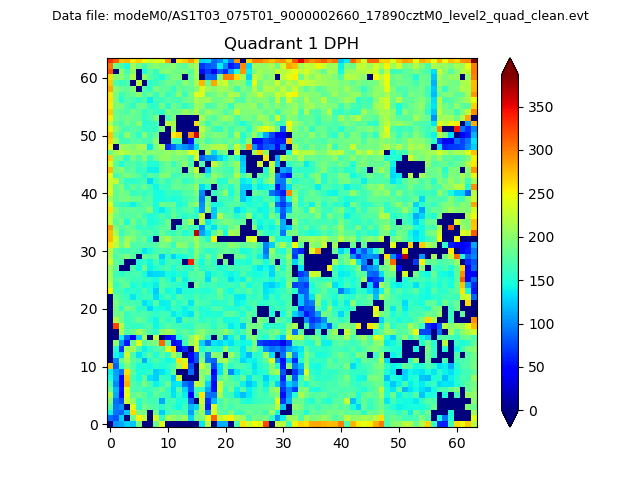 |
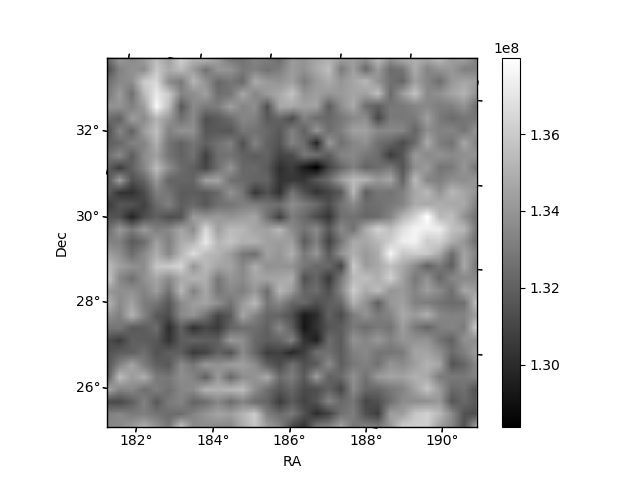
Quadrant B |
|---|---|---|---|
| Quadrant D | 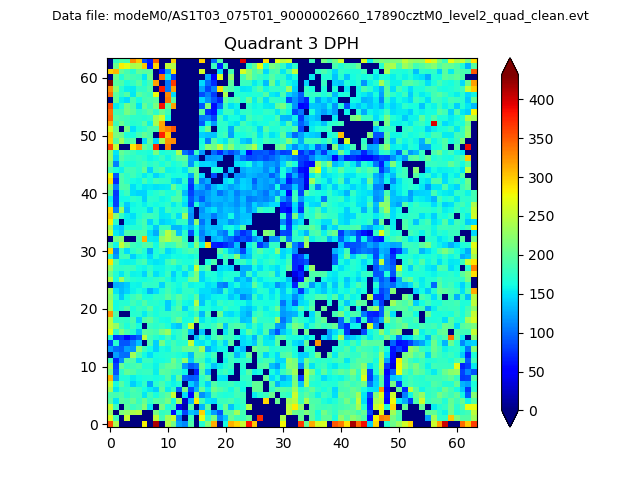 |
 |
Quadrant C |
| Plot type | Count rate plots | Images |
|---|---|---|
| Comparison with Poisson distribution Blue bars denote a histogram of data divided into 1 sec bins. Red curve is a Poisson curve with rate = median count rate of data. |
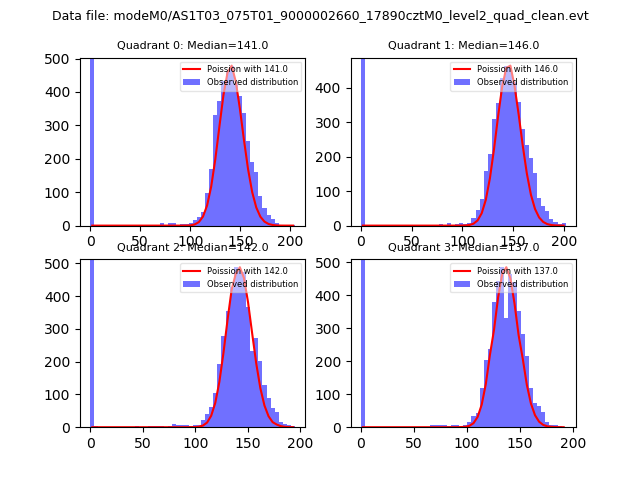 |
 |
| Quadrant-wise count rates Data is divided into 100 sec bins |
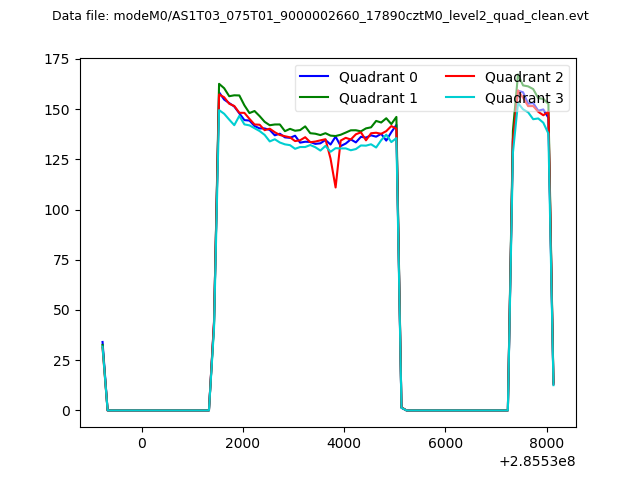 |
|
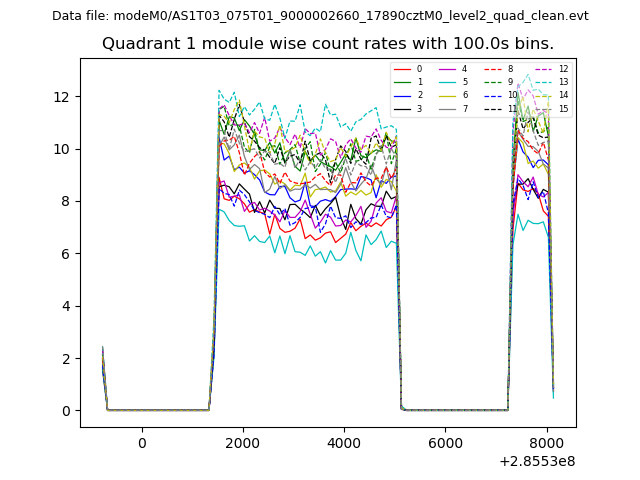
| Module-wise count rates for Quadrant A Data is divided into 100 sec bins |
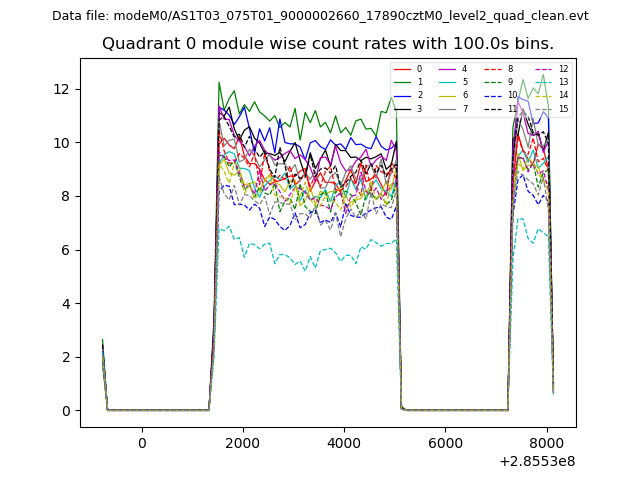 |
 |
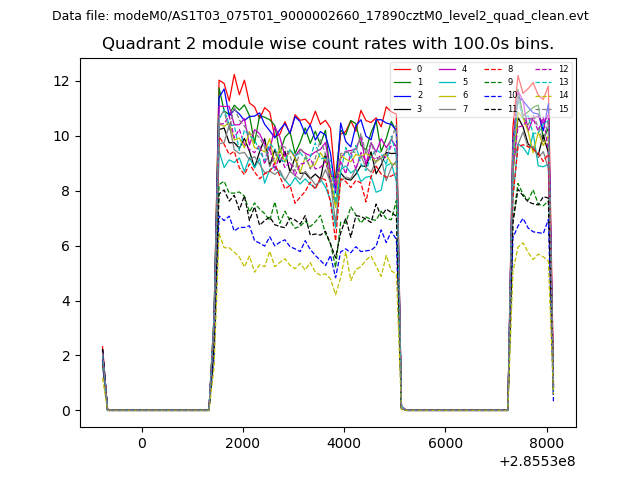
| Module-wise count rates for Quadrant B Data is divided into 100 sec bins |
 |
 |
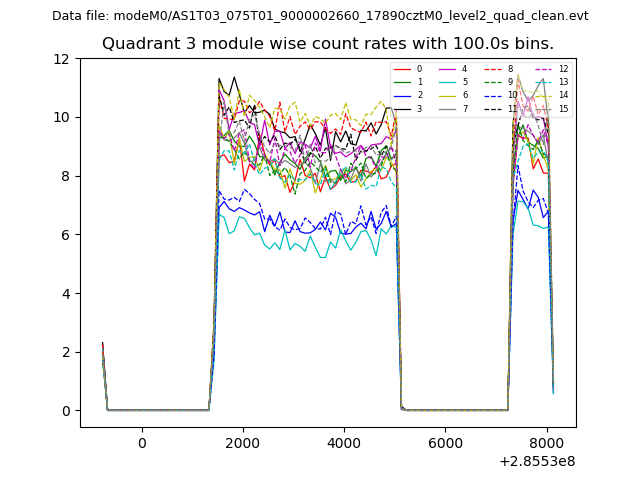
| Module-wise count rates for Quadrant C Data is divided into 100 sec bins |
 |
 |
| Module-wise count rates for Quadrant D Data is divided into 100 sec bins |
 |
 |
| Parameter | Plot |
|---|---|
| CZT HV Monitor | 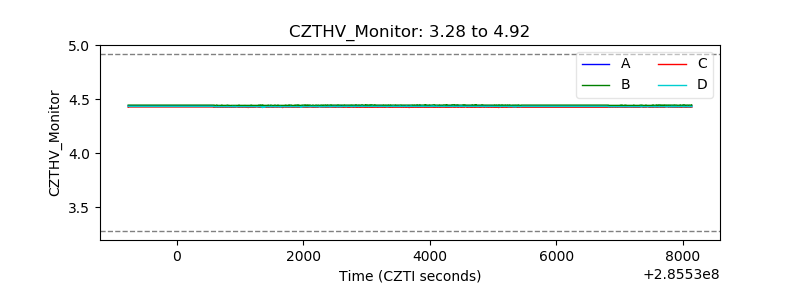 |
| D_VDD | 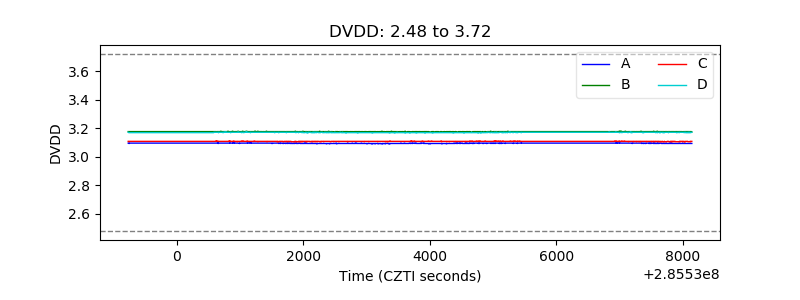 |
| Temperature 1 | 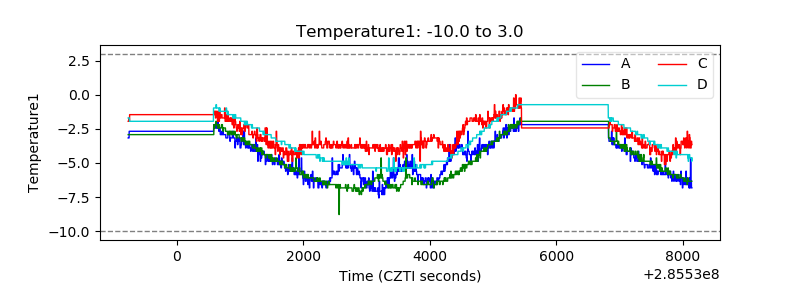 |
| Veto HV Monitor |  |
| Veto LLD | 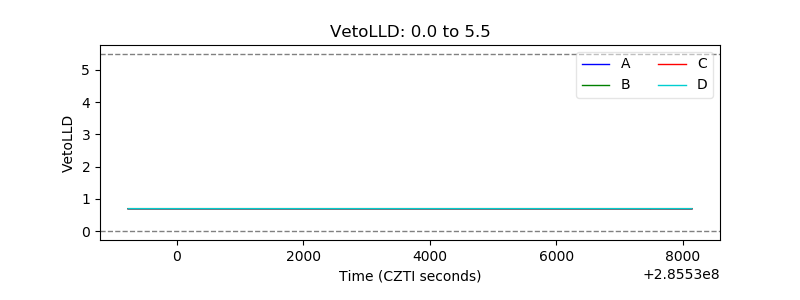 |
| Alpha Counter | 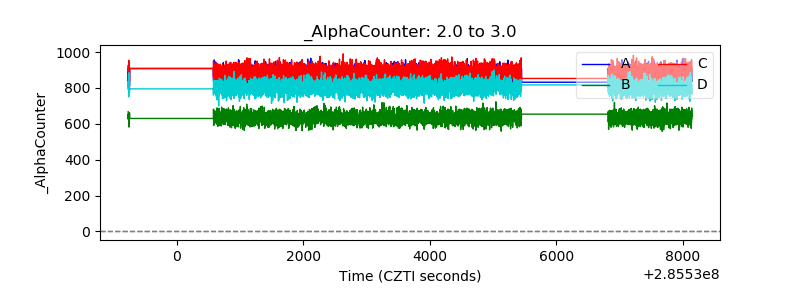 |
| _CPM_Rate | 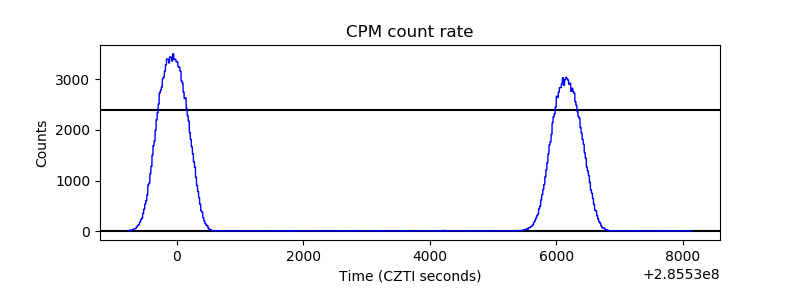 |
| CZT Counter | 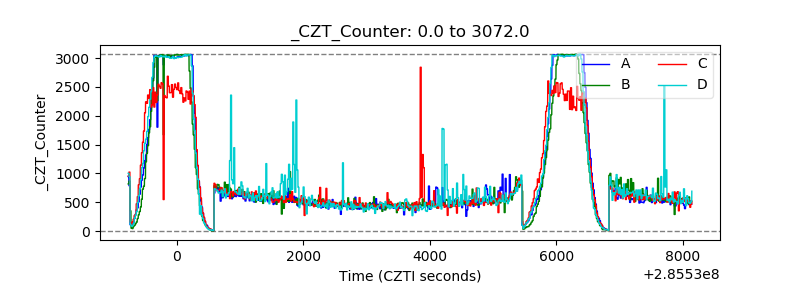 |
| +2.5 Volts monitor |  |
| +5 Volts monitor |  |
| _ROLL_ROT | 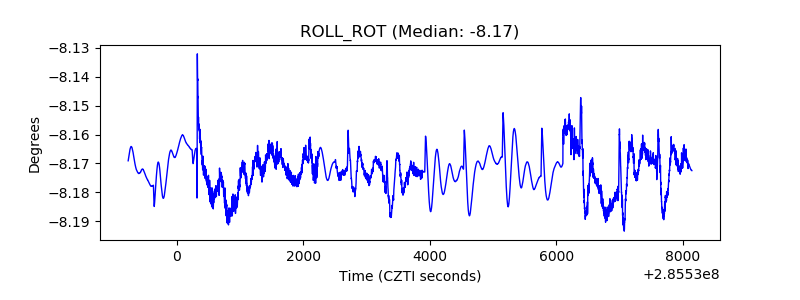 |
| _Roll_DEC | 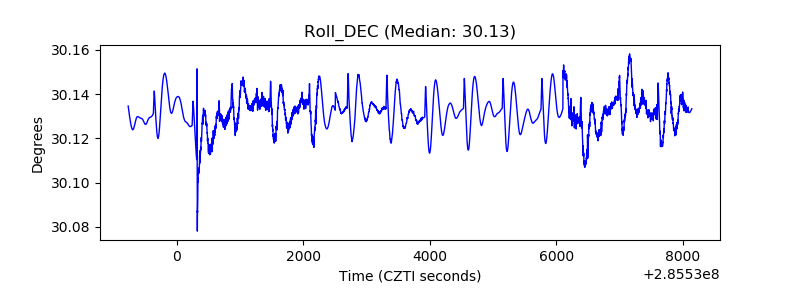 |
| _Roll_RA | 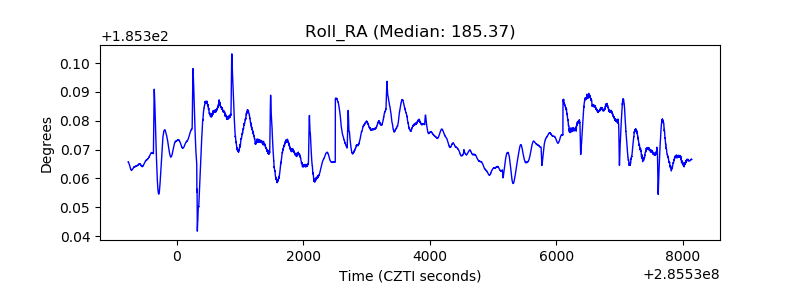 |
| Veto Counter | 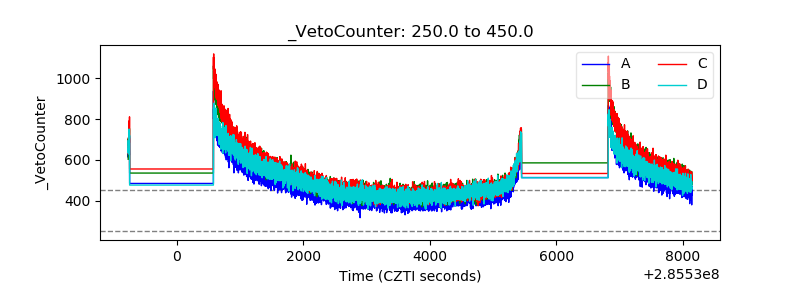 |