| Param | Original file | Final file |
|---|---|---|
| Filename | modeM0/AS1T03_075T01_9000002660_17891cztM0_level2.evt | modeM0/AS1T03_075T01_9000002660_17891cztM0_level2_quad_clean.evt |
| Size (bytes) | 446,307,840 | 102,162,240 |
| Size | 425.6 MB | 97.4 MB |
| Events in quadrant A | 3,098,094 | 664,897 |
| Events in quadrant B | 3,337,528 | 690,131 |
| Events in quadrant C | 3,255,190 | 665,369 |
| Events in quadrant D | 3,406,344 | 642,773 |
| Mode M9 | |||
|---|---|---|---|
| Quadrant | BADHDUFLAG | Total packets | Discarded packets |
| A | 0 | 18 | 0 |
| B | 0 | 19 | 0 |
| C | 0 | 19 | 0 |
| D | 0 | 19 | 0 |
| Mode SS | |||
|---|---|---|---|
| Quadrant | BADHDUFLAG | Total packets | Discarded packets |
| A | 0 | 126 | 0 |
| B | 0 | 126 | 0 |
| C | 0 | 126 | 0 |
| D | 0 | 126 | 0 |
| Mode M0 | |||
|---|---|---|---|
| Quadrant | BADHDUFLAG | Total packets | Discarded packets |
| A | 0 | 13203 | 2 |
| B | 0 | 13838 | 2 |
| C | 0 | 13511 | 2 |
| D | 0 | 14280 | 2 |
| Quadrant | Total seconds | Saturated seconds | Saturation percentage |
|---|---|---|---|
| A | 6170 | 62 | 1.004862% |
| B | 6170 | 115 | 1.863857% |
| C | 6170 | 107 | 1.734198% |
| D | 6170 | 60 | 0.972447% |
Noise dominated data is calculated using 1-second bins in cleaned event files. If a bin has >2000 counts, and if more than 50% of those come from <1% of pixels, then it is considered to be noise-dominated and hence unusable.
| Quadrant | # 1 sec bins | Bins with >0 counts | Bins with >2000 counts | High rate bins dominated by noise | Noise dominated (total time) | Noise dominated (detector-on time) | Marked lightcurve |
|---|---|---|---|---|---|---|---|
| A | 7490 | 6171 | 0 | 0 | 0.00% | 0.00% | 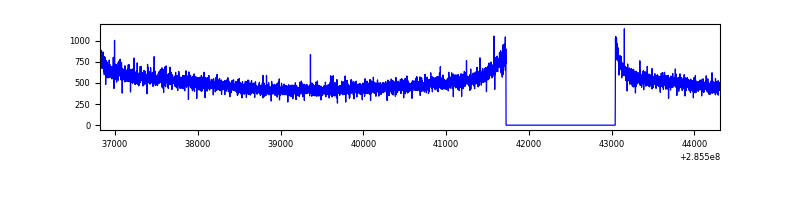 |
| B | 7490 | 6171 | 3 | 3 | 0.04% | 0.05% | 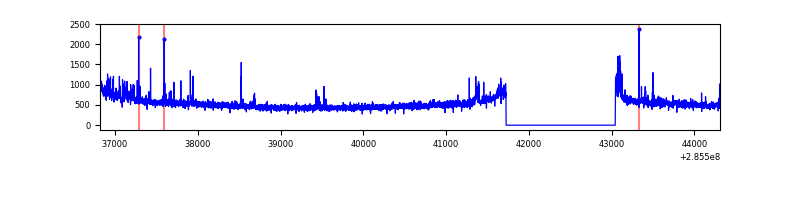 |
| C | 7490 | 6171 | 0 | 0 | 0.00% | 0.00% | 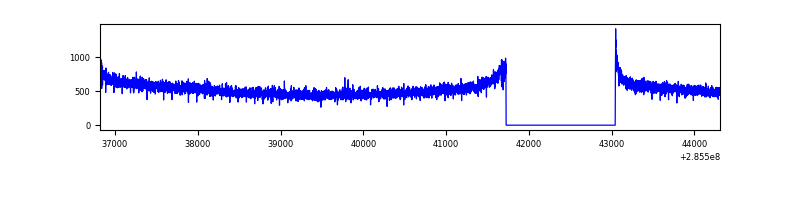 |
| D | 7490 | 6171 | 10 | 10 | 0.13% | 0.16% | 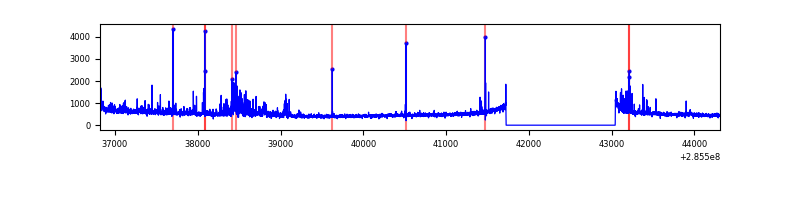 |
Top three noisy pixels from each quadrant. If the there are fewer than three noisy pixels in the level2.evt file, extra rows are filled as -1
| Pixel properties | Quadrant properties | ||||||
|---|---|---|---|---|---|---|---|
| Quadrant | DetID | PixID | Counts | Sigma | Mean | Median | Sigma |
| A | 6 | 16 | 7932 | 44.1 | 803 | 786 | 162.0 |
| A | 0 | 226 | 6916 | 37.83 | 803 | 786 | 162.0 |
| A | 12 | 194 | 5960 | 31.93 | 803 | 786 | 162.0 |
| B | 0 | 189 | 75155 | 485.87 | 814 | 796 | 153.0 |
| B | 0 | 197 | 34012 | 217.04 | 814 | 796 | 153.0 |
| B | 12 | 111 | 17516 | 109.25 | 814 | 796 | 153.0 |
| C | 14 | 238 | 122355 | 666.91 | 787 | 793 | 182.3 |
| C | 3 | 233 | 37547 | 201.64 | 787 | 793 | 182.3 |
| C | 5 | 218 | 23519 | 124.68 | 787 | 793 | 182.3 |
| D | 12 | 110 | 169775 | 888.59 | 786 | 766 | 190.2 |
| D | 1 | 52 | 70100 | 364.53 | 786 | 766 | 190.2 |
| D | 13 | 168 | 67551 | 351.13 | 786 | 766 | 190.2 |
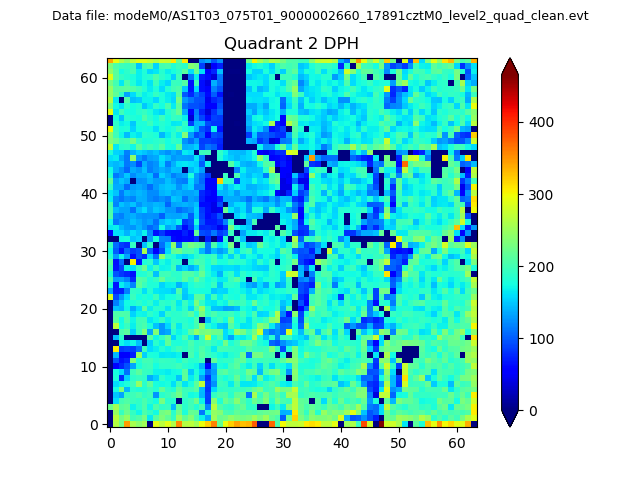
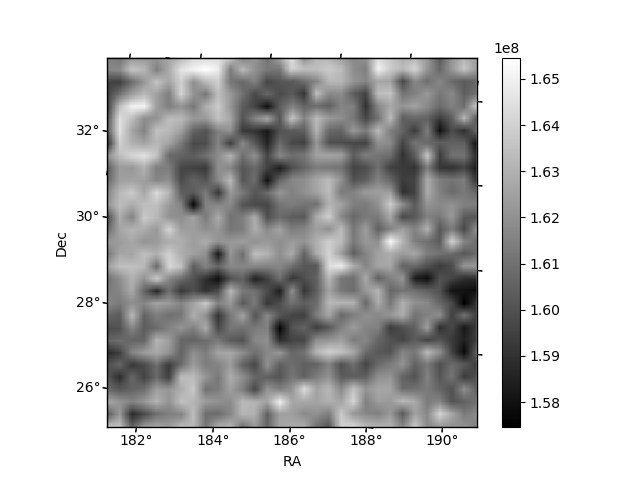
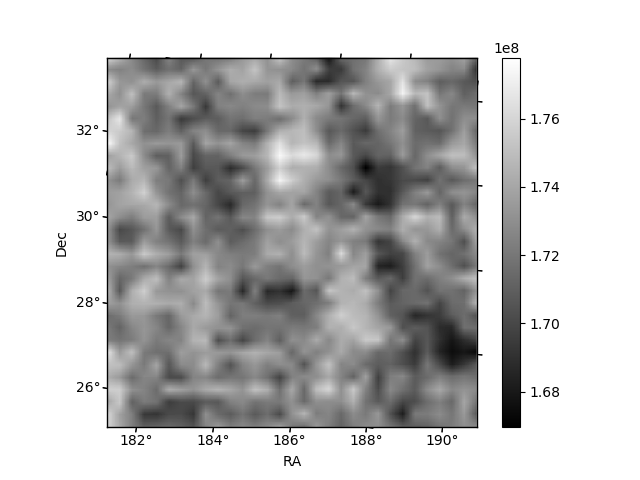
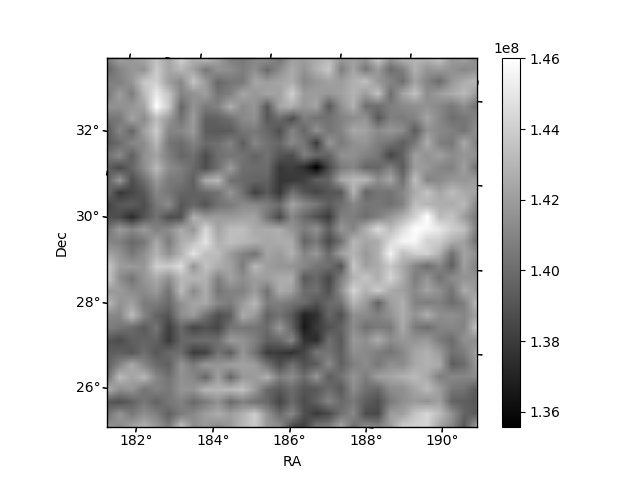
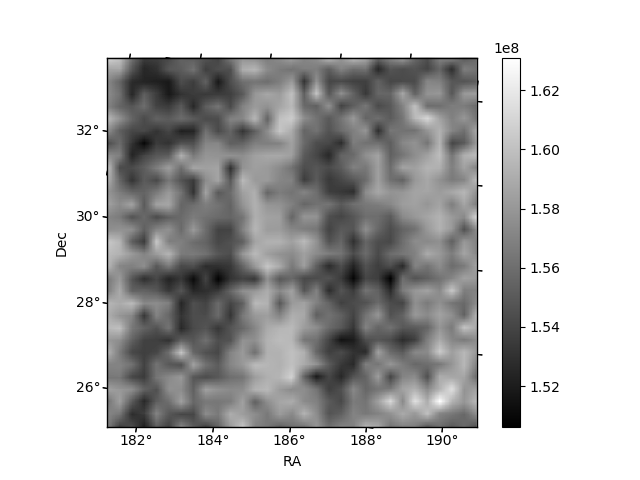
Histogram calculated using DETX and DETY for each event in the final _common_clean file
| Quadrant A | 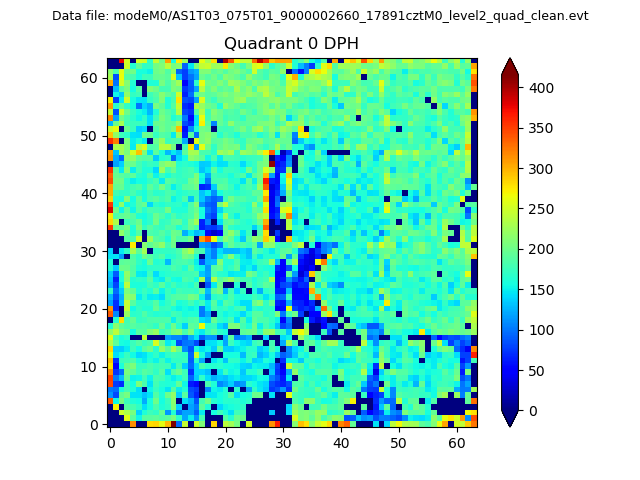 |
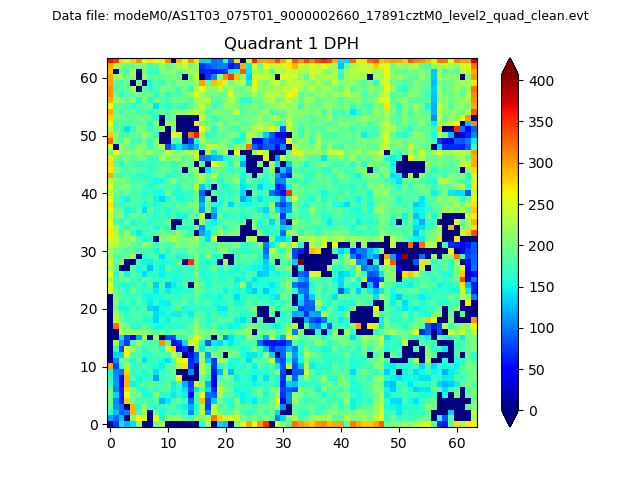 |
Quadrant B |
|---|---|---|---|
| Quadrant D | 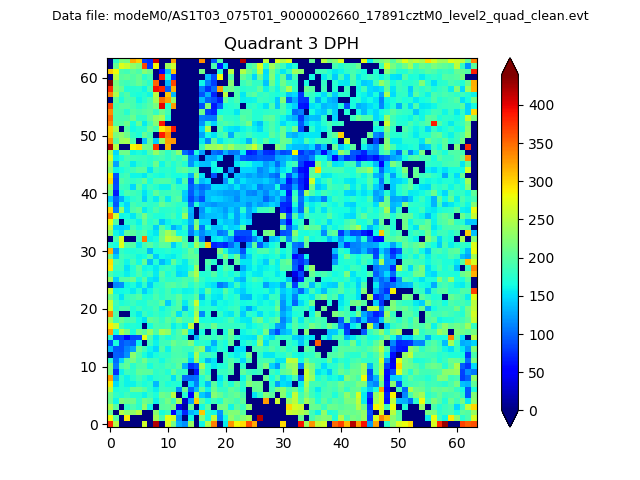 |
 |
Quadrant C |
| Plot type | Count rate plots | Images |
|---|---|---|
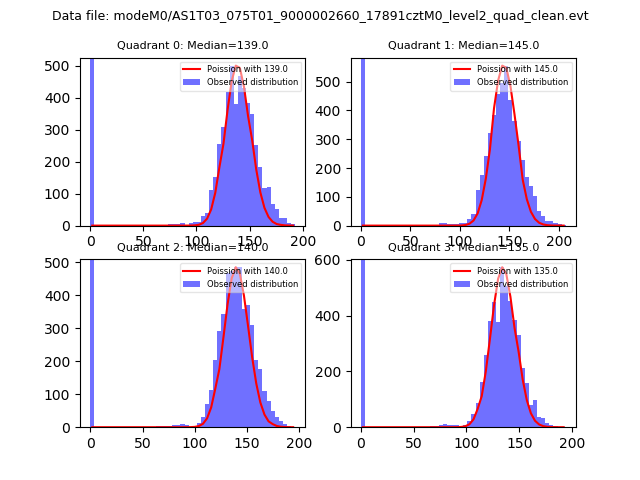
| Comparison with Poisson distribution Blue bars denote a histogram of data divided into 1 sec bins. Red curve is a Poisson curve with rate = median count rate of data. |
 |
 |
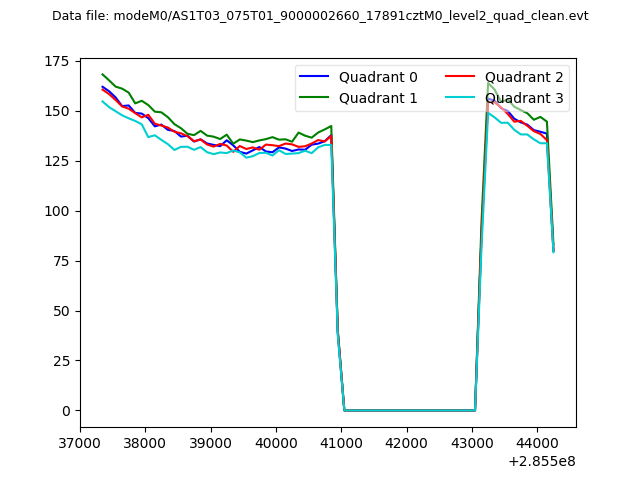
| Quadrant-wise count rates Data is divided into 100 sec bins |
 |
|
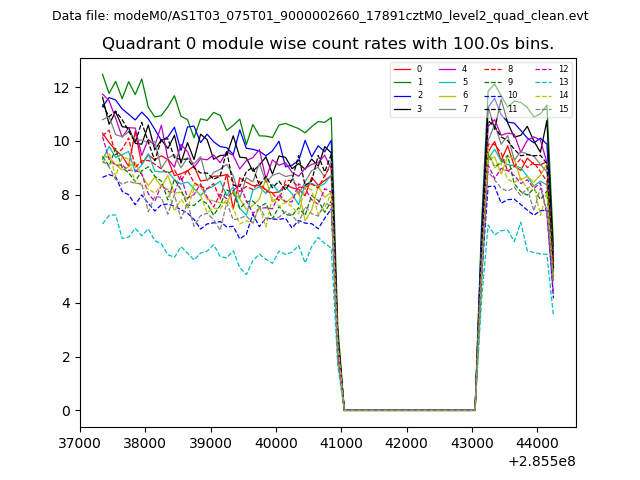
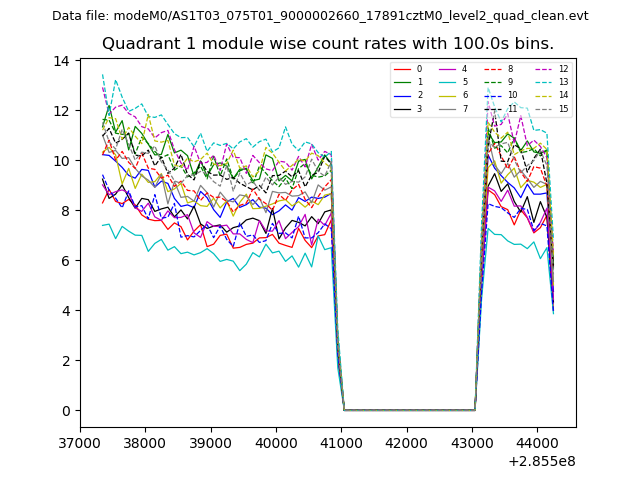
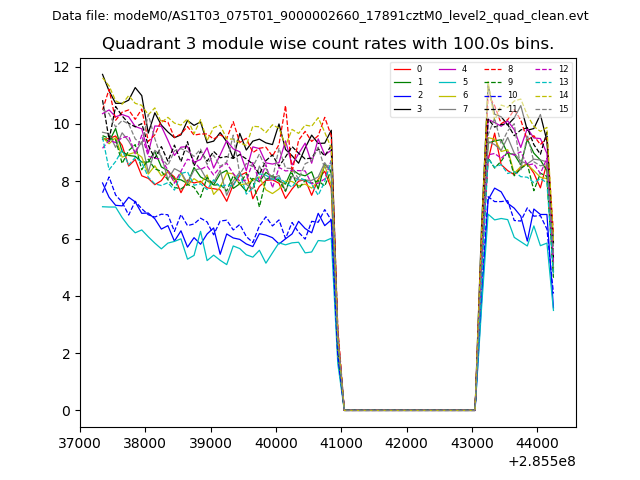
| Module-wise count rates for Quadrant A Data is divided into 100 sec bins |
 |
 |
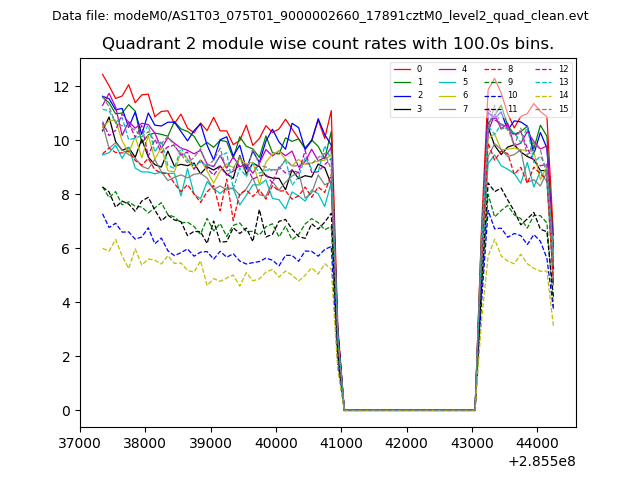
| Module-wise count rates for Quadrant B Data is divided into 100 sec bins |
 |
 |
| Module-wise count rates for Quadrant C Data is divided into 100 sec bins |
 |
 |
| Module-wise count rates for Quadrant D Data is divided into 100 sec bins |
 |
 |
| Parameter | Plot |
|---|---|
| CZT HV Monitor | 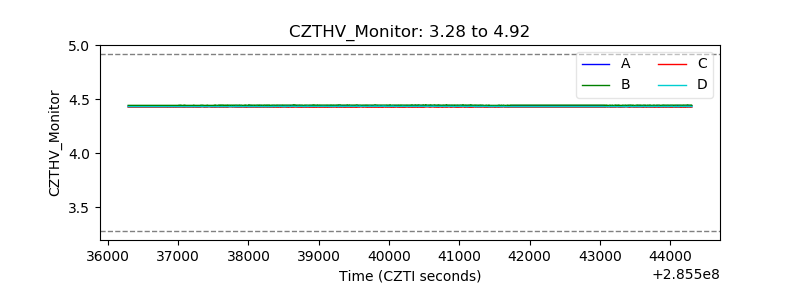 |
| D_VDD | 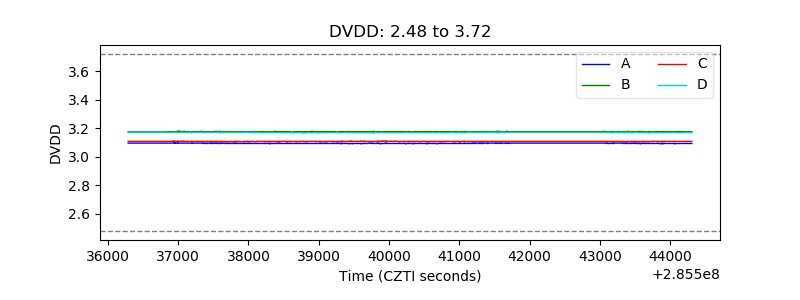 |
| Temperature 1 | 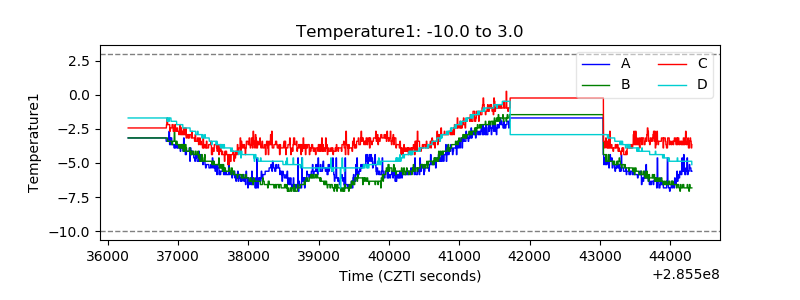 |
| Veto HV Monitor | 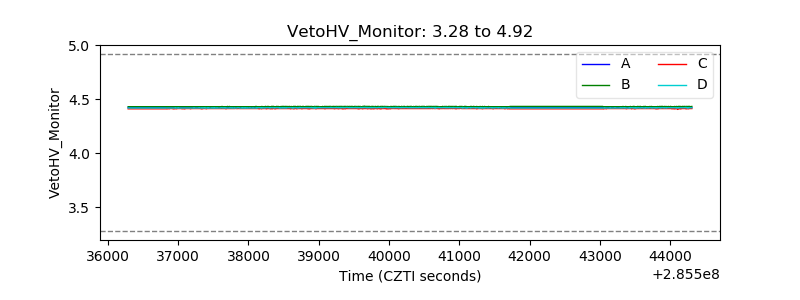 |
| Veto LLD | 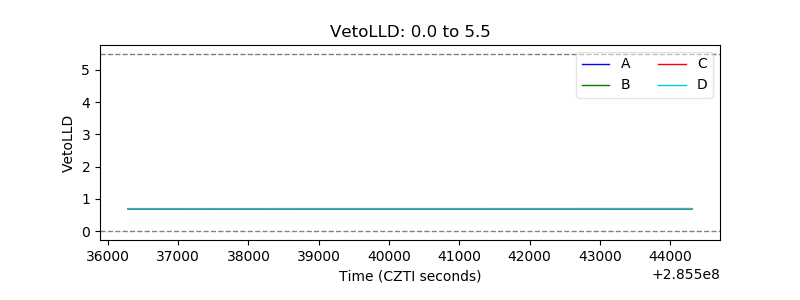 |
| Alpha Counter | 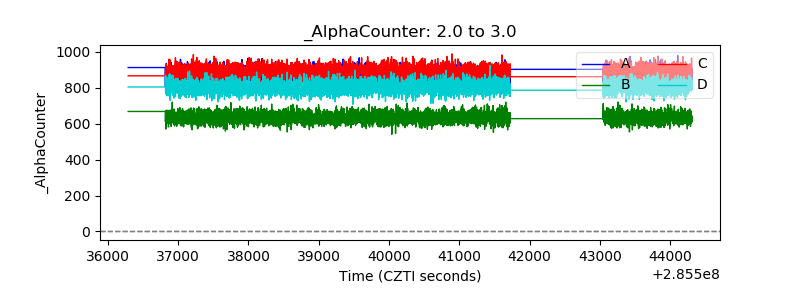 |
| _CPM_Rate | 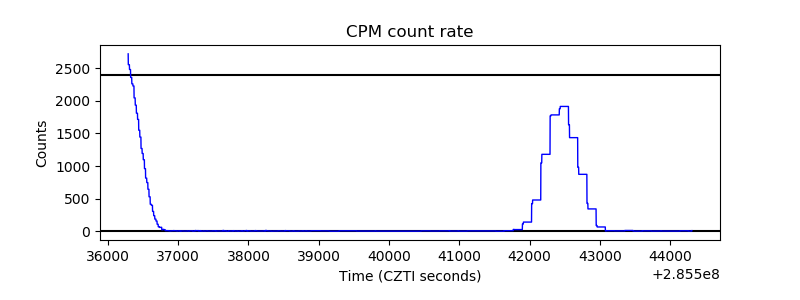 |
| CZT Counter | 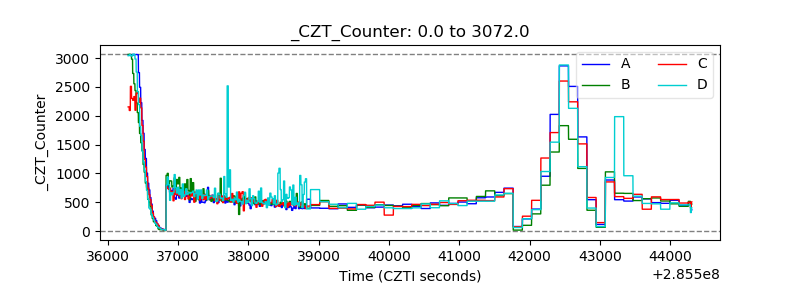 |
| +2.5 Volts monitor |  |
| +5 Volts monitor |  |
| _ROLL_ROT | 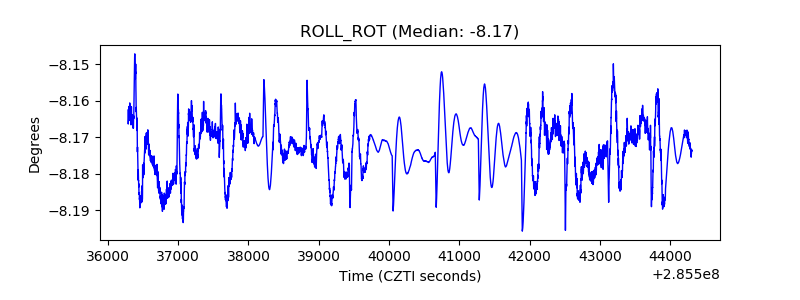 |
| _Roll_DEC | 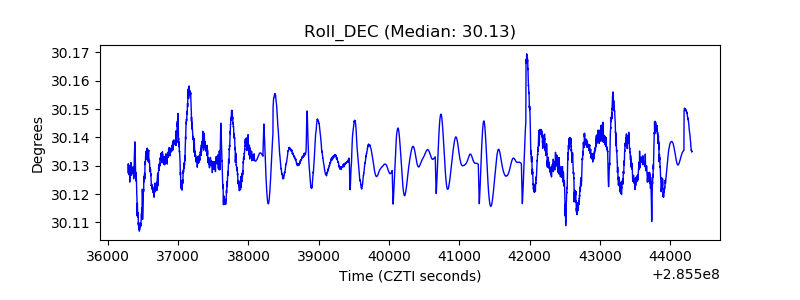 |
| _Roll_RA | 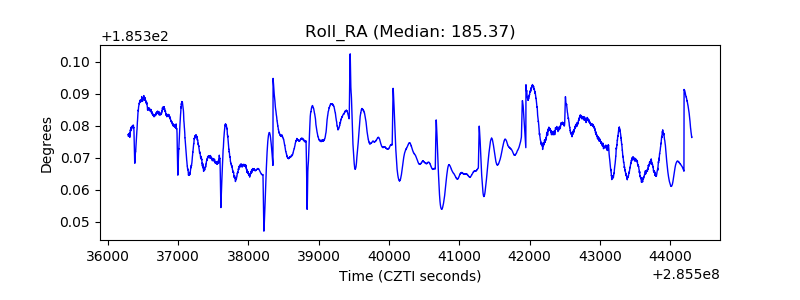 |
| Veto Counter | 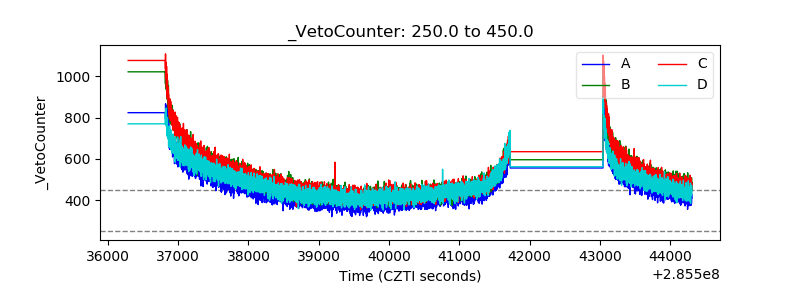 |