| Param | Original file | Final file |
|---|---|---|
| Filename | modeM0/AS1T03_075T01_9000002660_17893cztM0_level2.evt | modeM0/AS1T03_075T01_9000002660_17893cztM0_level2_quad_clean.evt |
| Size (bytes) | 498,813,120 | 101,712,960 |
| Size | 475.7 MB | 97.0 MB |
| Events in quadrant A | 3,535,093 | 642,606 |
| Events in quadrant B | 3,665,400 | 661,920 |
| Events in quadrant C | 3,755,941 | 636,065 |
| Events in quadrant D | 3,644,551 | 621,841 |
| Mode M9 | |||
|---|---|---|---|
| Quadrant | BADHDUFLAG | Total packets | Discarded packets |
| A | 0 | 19 | 0 |
| B | 0 | 19 | 0 |
| C | 0 | 19 | 0 |
| D | 0 | 19 | 0 |
| Mode SS | |||
|---|---|---|---|
| Quadrant | BADHDUFLAG | Total packets | Discarded packets |
| A | 0 | 154 | 0 |
| B | 0 | 154 | 0 |
| C | 0 | 154 | 0 |
| D | 0 | 154 | 0 |
| Mode M0 | |||
|---|---|---|---|
| Quadrant | BADHDUFLAG | Total packets | Discarded packets |
| A | 0 | 15625 | 2 |
| B | 0 | 15846 | 2 |
| C | 0 | 15983 | 2 |
| D | 0 | 16243 | 2 |
| Quadrant | Total seconds | Saturated seconds | Saturation percentage |
|---|---|---|---|
| A | 7438 | 94 | 1.263781% |
| B | 7438 | 154 | 2.070449% |
| C | 7438 | 180 | 2.420005% |
| D | 7438 | 58 | 0.779780% |
Noise dominated data is calculated using 1-second bins in cleaned event files. If a bin has >2000 counts, and if more than 50% of those come from <1% of pixels, then it is considered to be noise-dominated and hence unusable.
| Quadrant | # 1 sec bins | Bins with >0 counts | Bins with >2000 counts | High rate bins dominated by noise | Noise dominated (total time) | Noise dominated (detector-on time) | Marked lightcurve |
|---|---|---|---|---|---|---|---|
| A | 9403 | 7440 | 0 | 0 | 0.00% | 0.00% | 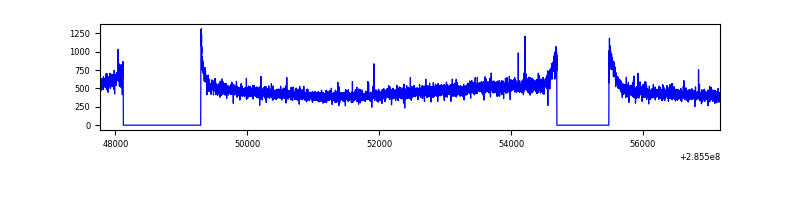 |
| B | 9403 | 7440 | 0 | 0 | 0.00% | 0.00% | 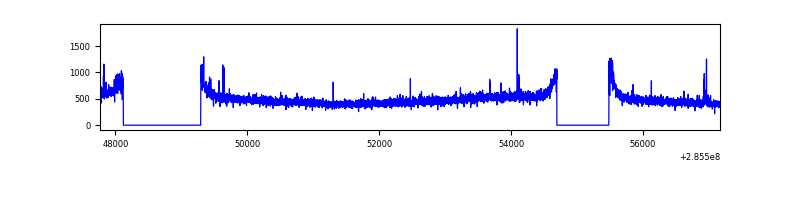 |
| C | 9403 | 7440 | 0 | 0 | 0.00% | 0.00% | 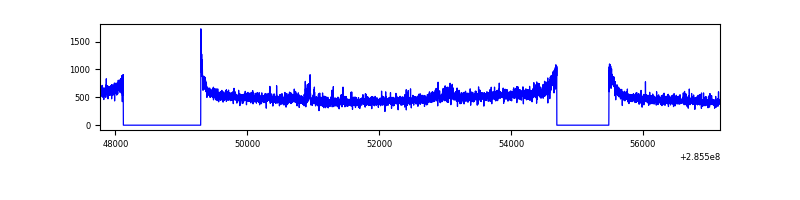 |
| D | 9403 | 7440 | 3 | 3 | 0.03% | 0.04% | 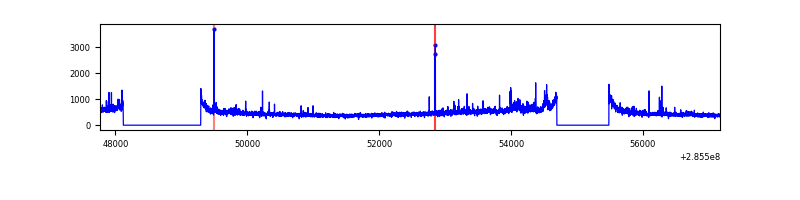 |
Top three noisy pixels from each quadrant. If the there are fewer than three noisy pixels in the level2.evt file, extra rows are filled as -1
| Pixel properties | Quadrant properties | ||||||
|---|---|---|---|---|---|---|---|
| Quadrant | DetID | PixID | Counts | Sigma | Mean | Median | Sigma |
| A | 0 | 226 | 7966 | 37.66 | 918 | 898 | 187.7 |
| A | 3 | 137 | 6901 | 31.98 | 918 | 898 | 187.7 |
| A | 12 | 194 | 6596 | 30.36 | 918 | 898 | 187.7 |
| B | 12 | 111 | 21530 | 116.07 | 924 | 897 | 177.8 |
| B | 0 | 189 | 20321 | 109.27 | 924 | 897 | 177.8 |
| B | 11 | 111 | 18491 | 98.98 | 924 | 897 | 177.8 |
| C | 3 | 233 | 155213 | 738.45 | 888 | 890 | 209.0 |
| C | 14 | 238 | 136204 | 647.49 | 888 | 890 | 209.0 |
| C | 13 | 61 | 6336 | 26.06 | 888 | 890 | 209.0 |
| D | 13 | 168 | 115315 | 525.65 | 894 | 868 | 217.7 |
| D | 7 | 238 | 78639 | 357.2 | 894 | 868 | 217.7 |
| D | 10 | 70 | 28816 | 128.37 | 894 | 868 | 217.7 |
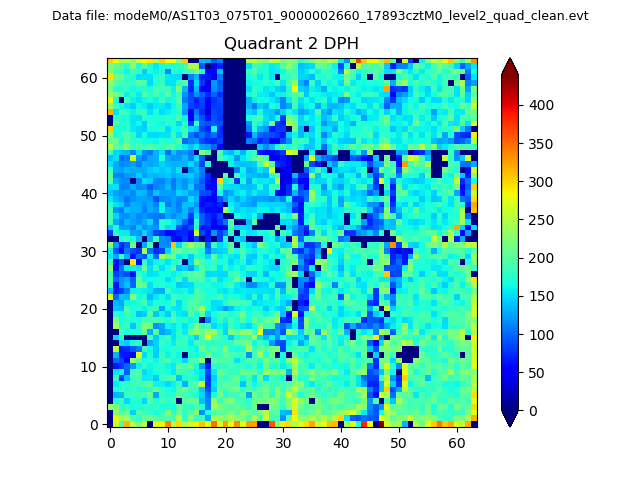
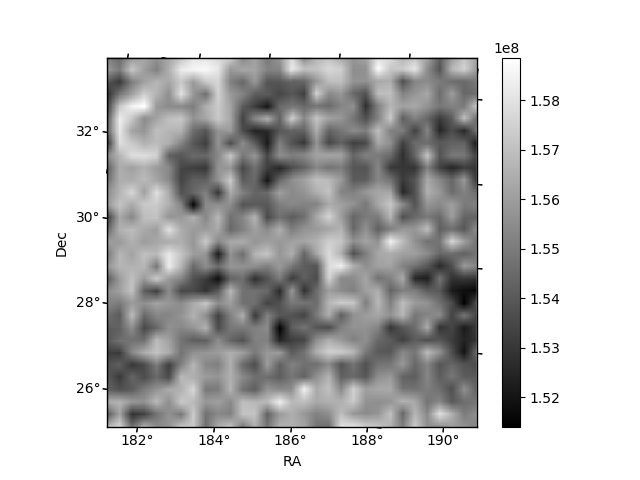
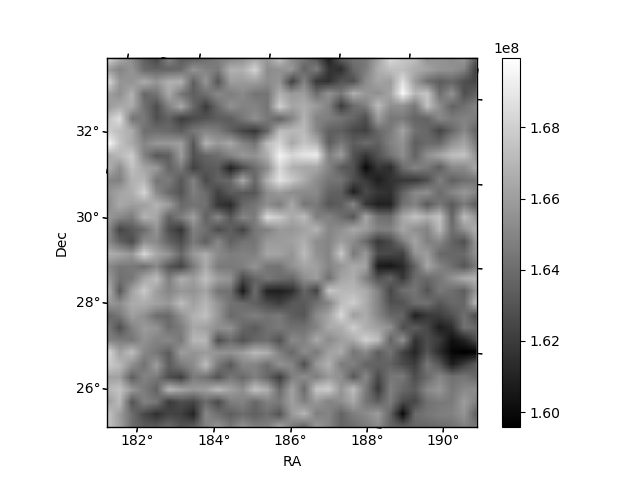
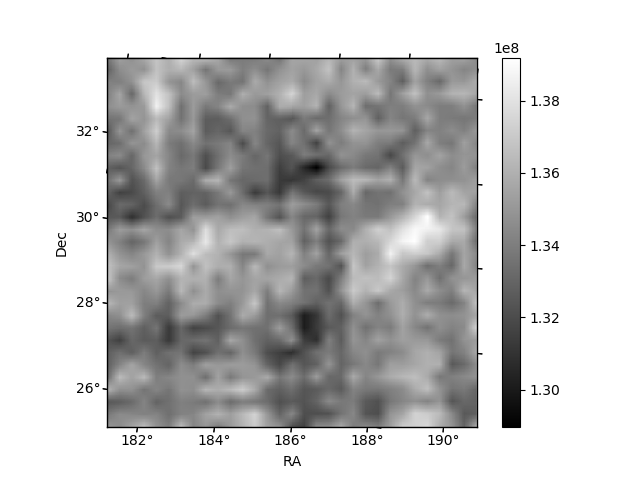
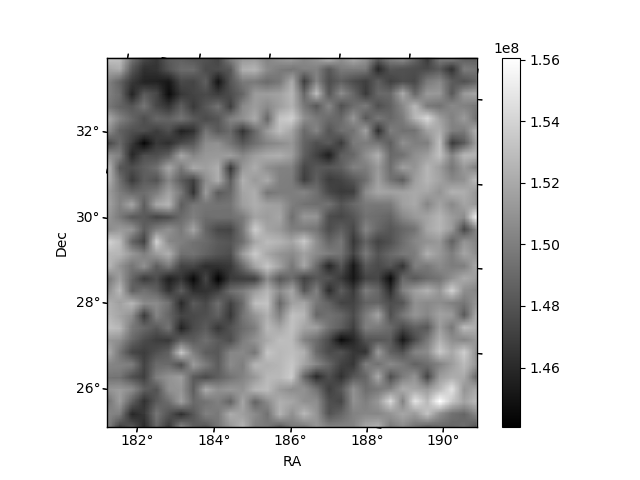
Histogram calculated using DETX and DETY for each event in the final _common_clean file
| Quadrant A | 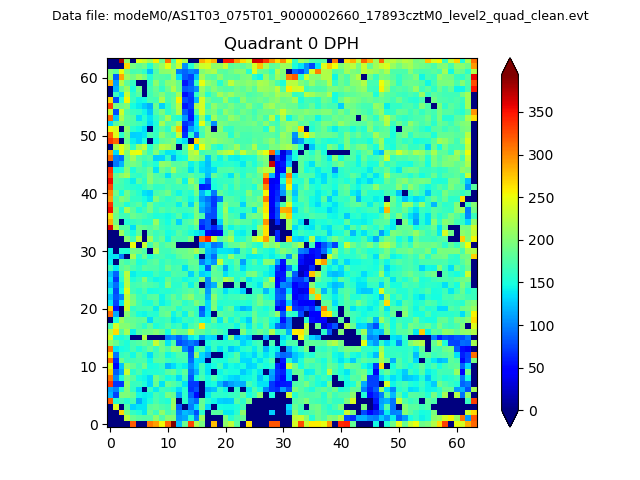 |
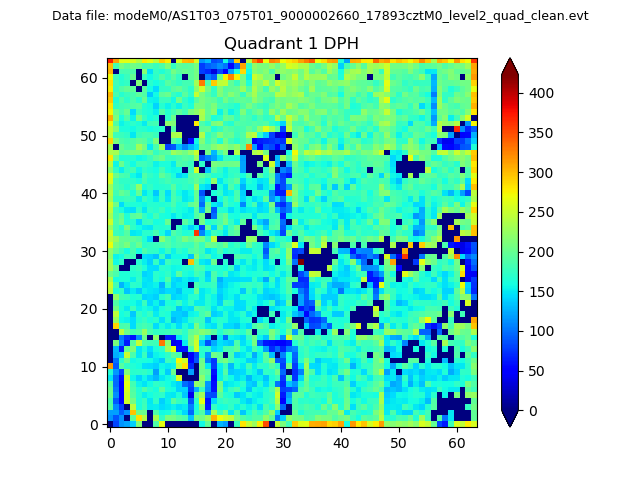 |
Quadrant B |
|---|---|---|---|
| Quadrant D | 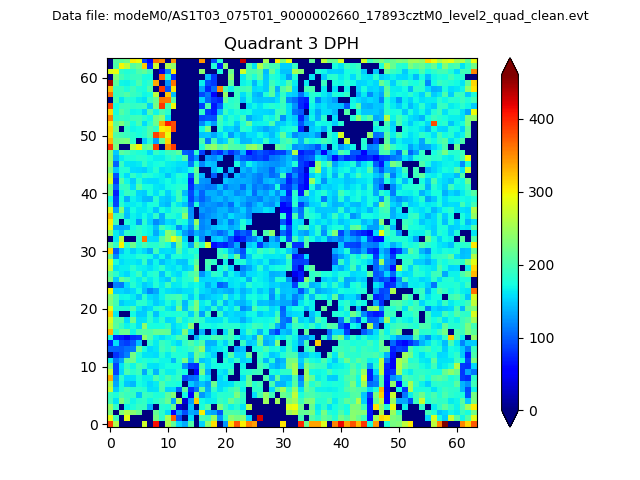 |
 |
Quadrant C |
| Plot type | Count rate plots | Images |
|---|---|---|
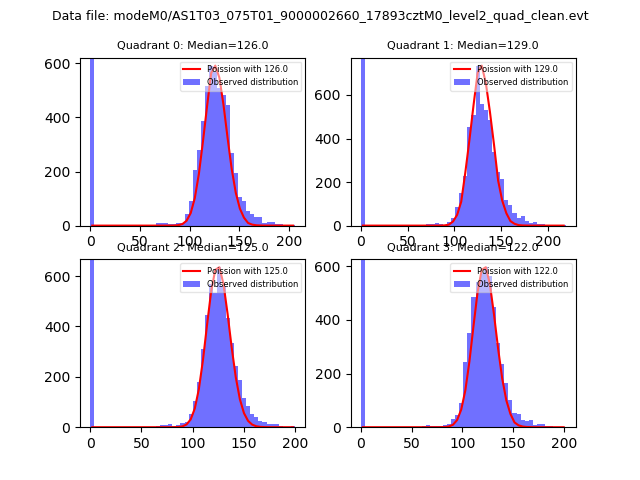
| Comparison with Poisson distribution Blue bars denote a histogram of data divided into 1 sec bins. Red curve is a Poisson curve with rate = median count rate of data. |
 |
 |
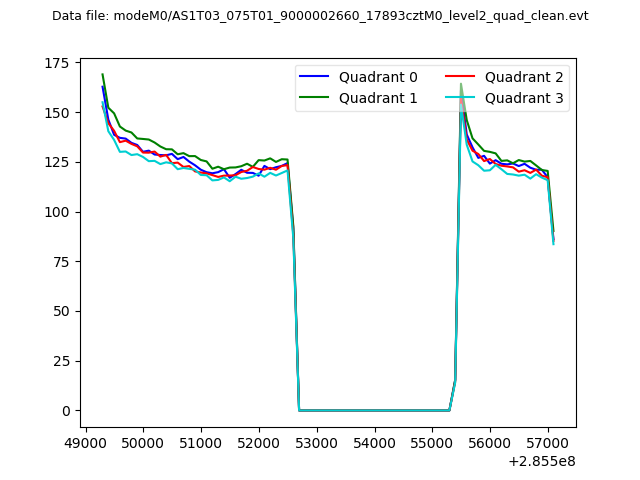
| Quadrant-wise count rates Data is divided into 100 sec bins |
 |
|
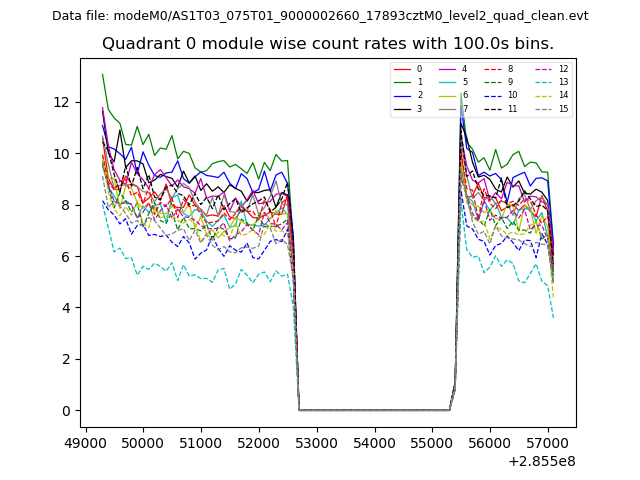
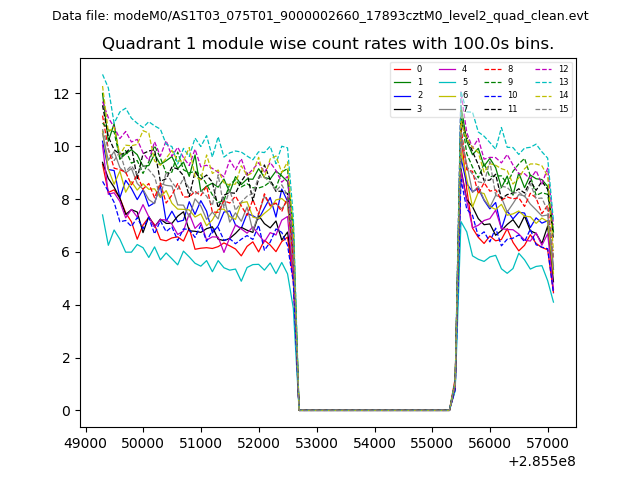
| Module-wise count rates for Quadrant A Data is divided into 100 sec bins |
 |
 |
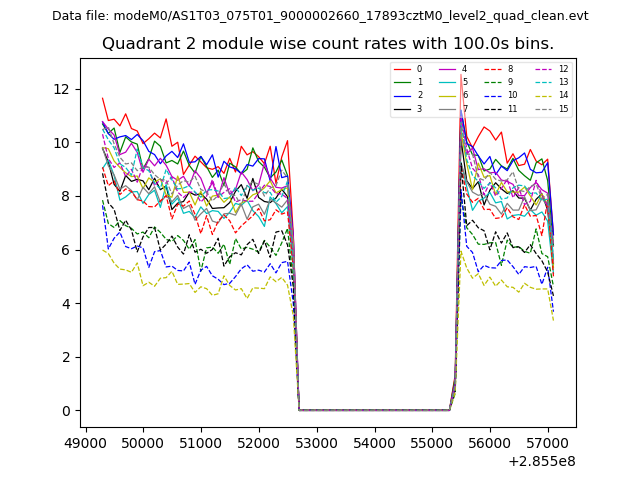
| Module-wise count rates for Quadrant B Data is divided into 100 sec bins |
 |
 |
| Module-wise count rates for Quadrant C Data is divided into 100 sec bins |
 |
 |
| Module-wise count rates for Quadrant D Data is divided into 100 sec bins |
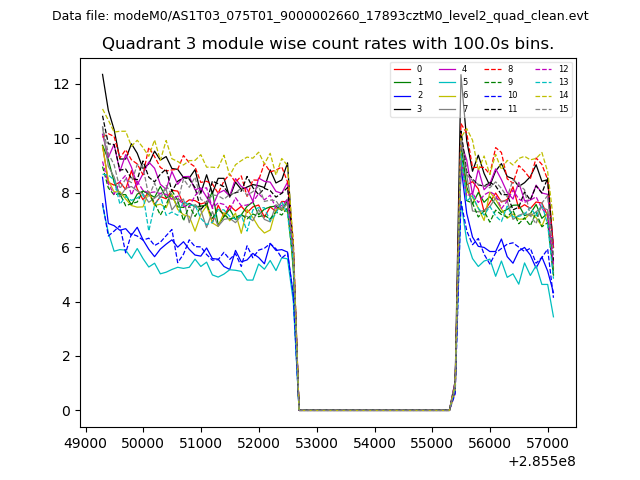 |
 |
| Parameter | Plot |
|---|---|
| CZT HV Monitor | 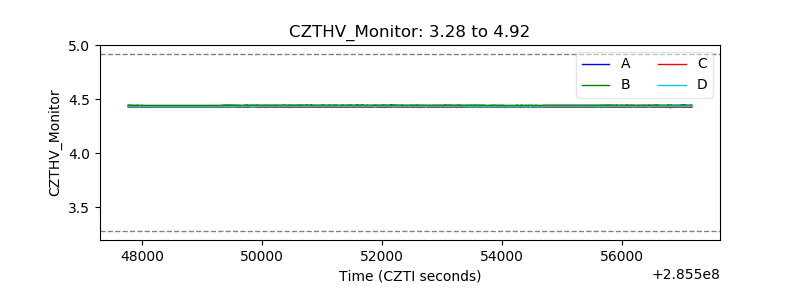 |
| D_VDD | 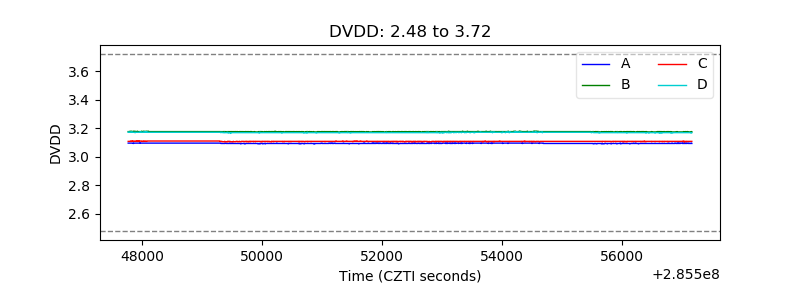 |
| Temperature 1 | 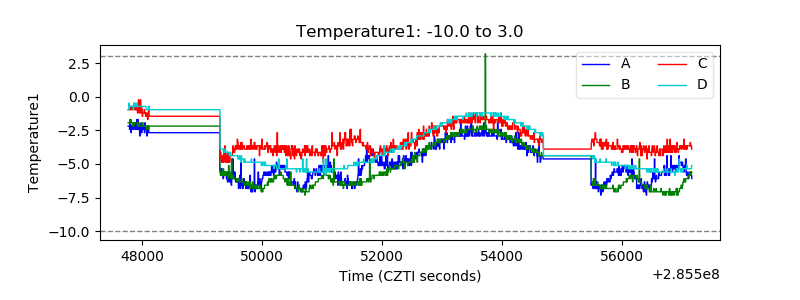 |
| Veto HV Monitor | 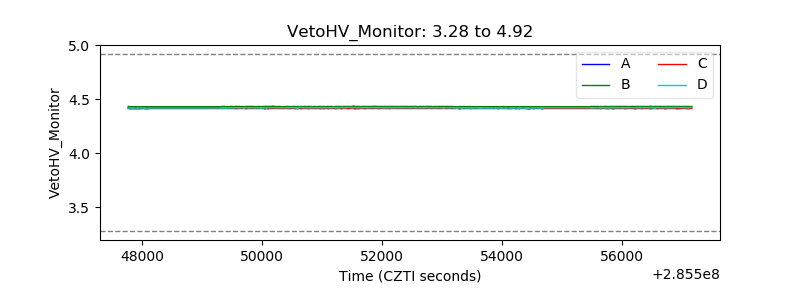 |
| Veto LLD | 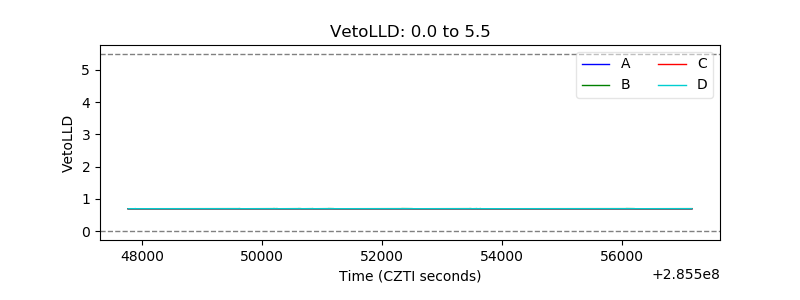 |
| Alpha Counter | 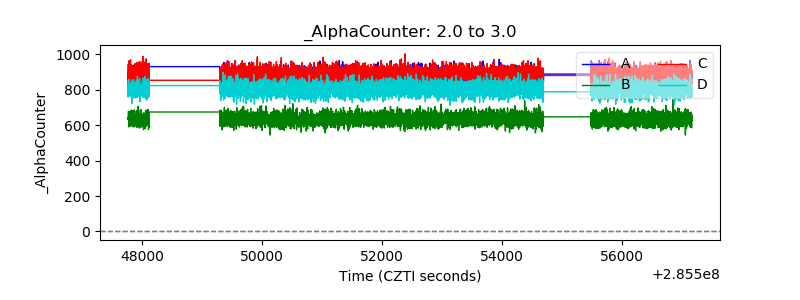 |
| _CPM_Rate | 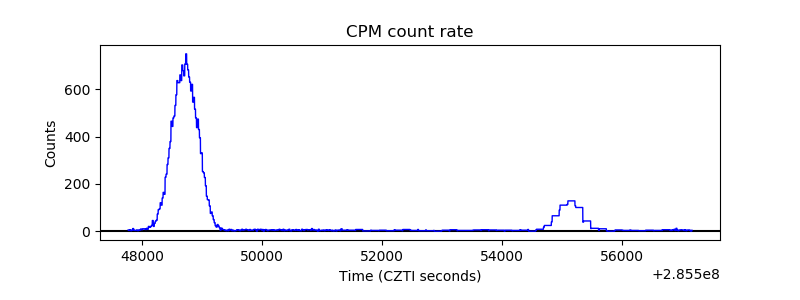 |
| CZT Counter | 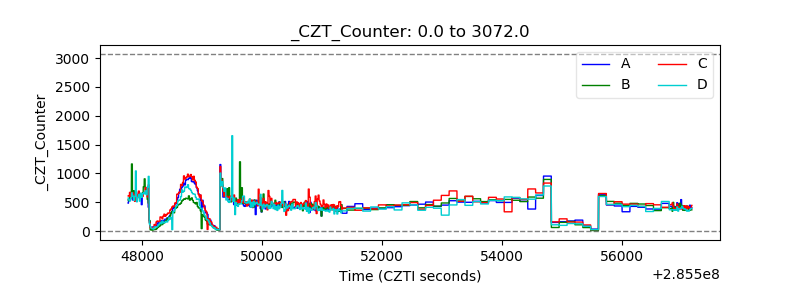 |
| +2.5 Volts monitor |  |
| +5 Volts monitor | 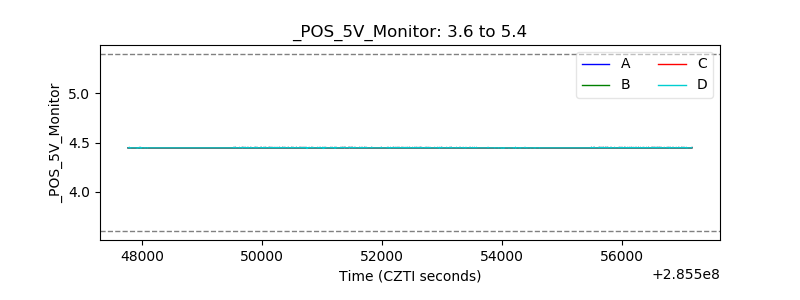 |
| _ROLL_ROT | 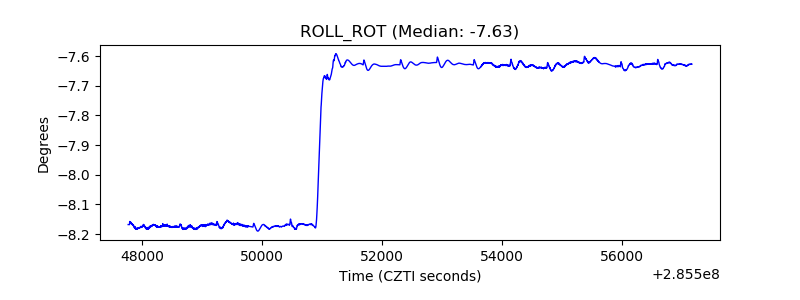 |
| _Roll_DEC | 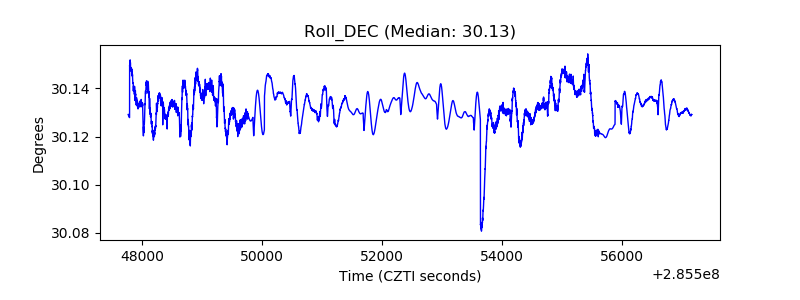 |
| _Roll_RA | 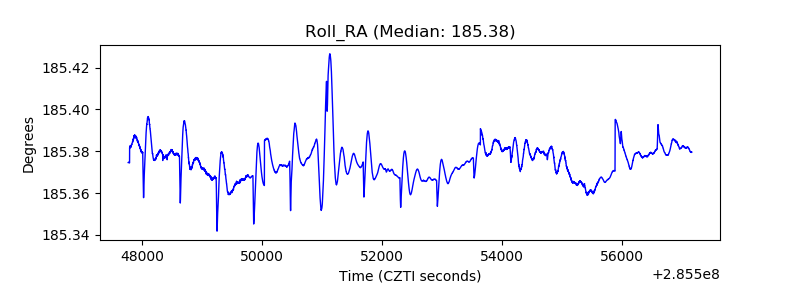 |
| Veto Counter | 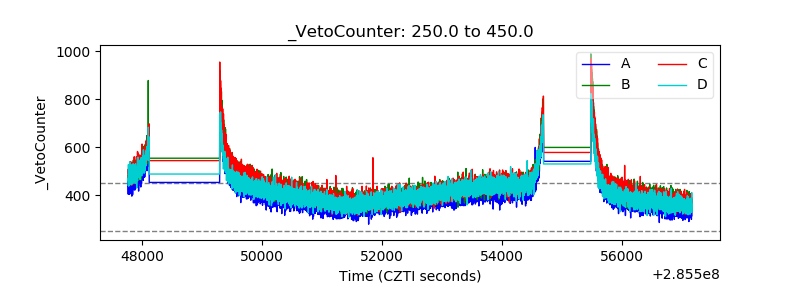 |